[Crypto Trading With Alligator Indicator] -Steemit Crypto Academy | S5W3| Homework Post for @Kouba01
ALLIGATOR INDICATOR
Williams Bill, a well-known man, created the Alligator Indicator. He is well-known for his work in the financial trading industry. He was widely considered as a forerunner in the field of market psychology. As a result of his observation in the market being comparable to that of an alligator, he created Alligator Indicator. He noted that the market is like an animal that takes a break from eating for a while and then eats swiftly when hungry.
The Alligator Indicator is a trend-following indicator that is used to determine the direction of a market asset. It depicts the direction in which an asset is trending. Three lines make up the indicator. These lines, which are colored green, blue, and red, represent moving averages that lag behind the price.
Green represents the lip, blue represents the jaw, and red represents the fangs of the alligator.
Default settings for moving averages vary. Below are the settings.
1.Green (Lips) - A five-period moving average with a three-step adjustment. The Alligator indicator's Green moving average is the indicator's fastest moving average.
2.Blue (Jaw) - A 13-period moving average with an adjustment of 8 is used. The Alligator indicator's Blue moving average is the slowest of the three moving averages.
3.Red (Teeth) – The moving average is established for an 8-period with a 5-adjustment.
The Alligator indicator is based on the animal's concept (Alligator). The shutting of the Alligator's lips, mouth, and teeth due to overfeeding or exhaustion is indicated when the three lines converge (when the moving average crosses or is interwoven). It denotes the termination or weakening of a trend in terms of trends.
The Alligator becomes increasingly hungry the longer he sleeps or closes his mouth. Because the price action trend may be weak or in a range when the Alligator sleeps or the moving averages converge, traders normally do not take a position when the Alligator sleeps or when the moving averages converge. The Alligator is about to feed when the three moving averages diverge, and the deeper the divergence, the stronger the trend. The alligator can choose to feed upward, resulting in an uptrend, or feed downwards, resulting in a downtrend.
ALLIGATOR INDICATOR CALCULATION
Let's look at how the alligator Indicator is calculated. Below is the formula for computing the indicator.
Median Price = (High + Low) / 2
Alligator jaw = Smoothed moving average (Median price, 13, 8)
Alligator teeth = Smoothed moving average (Median price, 8, 5)
Alligator lips = Smoothed moving average (Median price, 5, 3)
Where:
High denotes the candle's highest price.
Low = The candle's lowest price.
SMMAS: Smoothed moving average
The jaw, teeth, and lips of the alligator are then estimated. SMMA, for example, is used for alligator jaw (Median price 13, 8). That is, the smoothed moving average will be calculated over the median Price, with a smoothing period of 13 and an adjustment of 8. The alligator line, teeth, and lips of the remaining alligators are calculated in the same way.
HOW DO YOU ADD THE ALLIGATOR INDICATOR TO A CHART
In this section, I will be doing a demonstration on the required steps to follow in order to add the Alligator indicator to our chart using the trading view platform
1.The first step is to make a visit to the trading view website www.tradingview.com
2.Click on the chart bar at the top of your PC interface
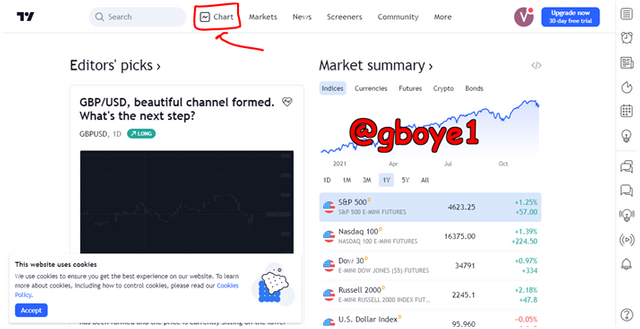
3.After the chart is displayed, you click on the indicator bar at the top of the PC interface

4.Click on the search bar available as highlighted by the arrow in the image below and click on the alligator indicator
5.By following all the steps above meticulously your end result is the addition of the alligator indicator to your chart
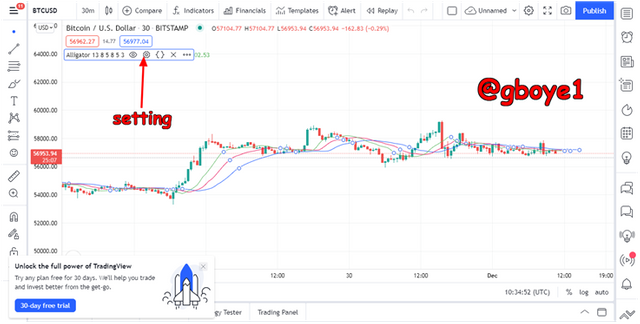
THE ALLIGATOR INDICATOR'S CONFIGURATION
•Click on the Alligator Indicator settings as shown below to configure the Alligator Indicator.
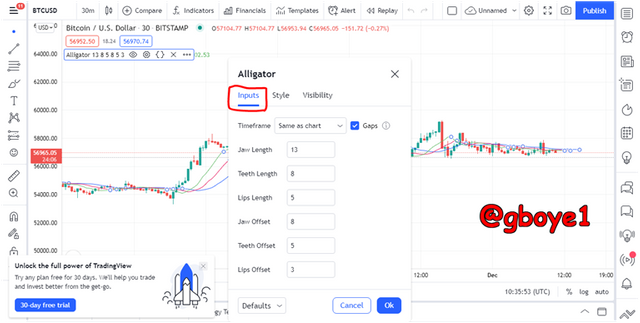
•Select Inputs from the indicator settings. The alligator indicator's default settings are displayed below.
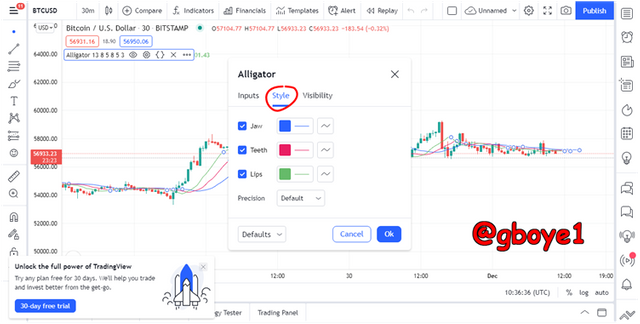
•Then select Style. The default color variations for the jawline, teeth line, and lip line moving averages are shown in the style pop-up with blue for the jawline, red for the teeth line, and green for the lip line moving averages. As indicated in the image below.
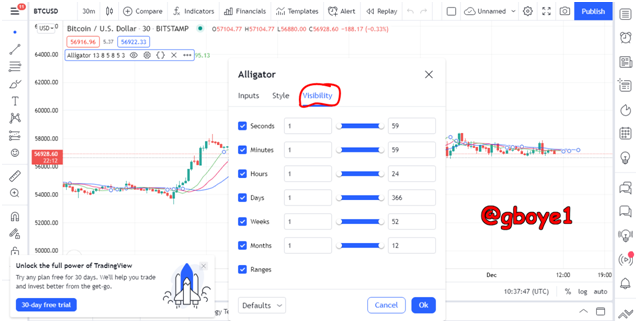
•Finally, go to the visibility options. On the pop-up, the default options are displayed, and then click Ok.
Changing the default settings is not recommended. Because the inputs to each moving average level are Fibonacci numbers, this is the case. When looking for support and resistance, as well as market entrances, these numbers (levels) are crucial.
Furthermore, as compared to the Alligator indicator with default parameters, the accuracy of the trade signal provided by an Alligator indicator with customized settings is low.
INTERPRETING THIS INDICATOR FROM ITS 3 PHASES: THE PERIOD OF REST(OR SLEEP), AWAKENING, AND THE MEAL PHASE
The three phases of the alligator indicator are as follows:
1.Sleeping Alligator phase
2.Awakening Alligator phase
3.Alligator meal phase
SLEEPING ALLIGATOR PHASE
The Alligator's sleep phase occurs when the three moving averages (lip, jaw, and teeth) cross or get interwoven, indicating that the Alligator's mouth has closed (meaning the Alligator is in a resting or sleeping phase primarily due to overfeeding).
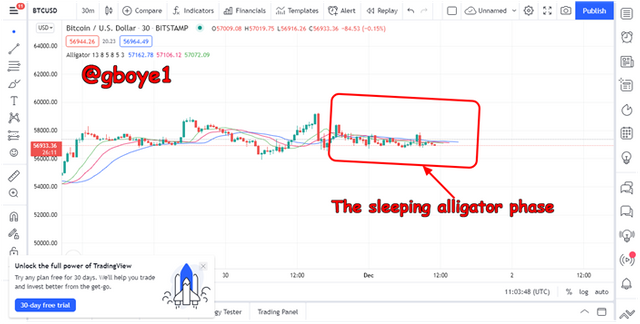
The alligator indicator's rest or sleep phase indicates a weak trend or the end of a current trend. It also signifies a market range, and traders should avoid taking positions during this time; instead, they should cancel open positions if they have made enough profit.
AWAKENING ALLIGATOR PHASE
This is the alligator's mouth opening; after a long or short rest, the alligator opens his mouth, preparing to feed upwards (forming a bullish or uptrend) or downwards (producing a bearish or downtrend) (starting a bearish or a downtrend). The divergence of the three moving averages is represented by the awakening.
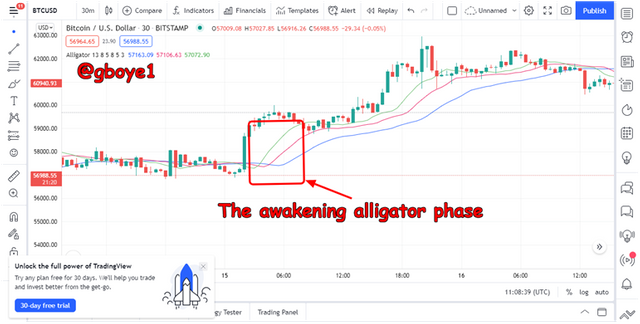
The direction of the trend, or the direction in which the Alligator will feed, is determined by the creation of moving averages. The awakening phase is the continuation or beginning of a new trend.
ALLIGATOR MEAL PHASE
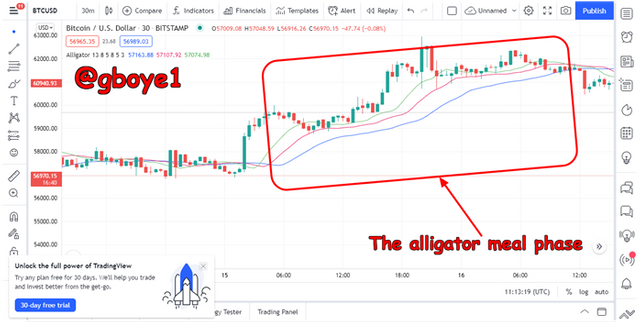
In my perspective, the meal phase can also be referred to as the trend phase, because this is when the Alligator feeds either upward or downward, resulting in a bullish or bearish trend.
Following the awakening phase, the hungry alligator starts to feed, and the path he selects is dictated by the current market trend. As a result, traders can estimate the feeding direction based on the creation of the moving average during the awakening. Traders may also estimate the strength of the trend or how hungry the Alligator is by comparing the length of the rest phase to the distance between the moving averages during the awakening period.
CONSIDERING THE LAYOUT OF ITS THREE MOVING AVERAGES THAT MAKE UP THE ALLIGATOR INDICATOR, HOW CAN ONE PREDICT WHETHER THE TREND WILL BE BULLISH OR BEARISH?
When all three lines are intertwined and the distance between them is narrow, the Alligator is asleep, and so there is no trend, just as I previously stated. The Alligator, on the other hand, is gradually awakening from its slumber as the lines begin to move and the gap between them widens, indicating the beginnings of a new trend.
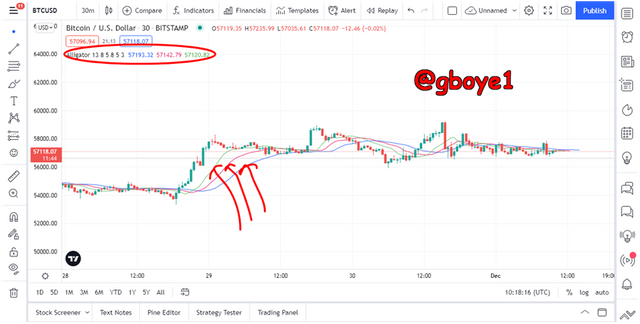
UPTREND
To recognize a bullish trend, keep in mind that the lines will be laid out in the following order.
1.The Green line will be under and closest to the candle sticks above the rest of the lines.
2.The Red Line will be in which the green line and the blue line
3.Then the last line below will be the Blue line, below the red line
These explained above are shown in the image below
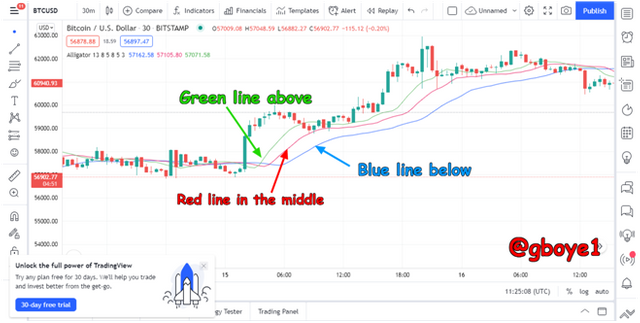
This can be seen right from the start of the bullish trend. The layout is simple. It's time to ride along with the bullish trend once those lines have been identified.
DOWNTREND
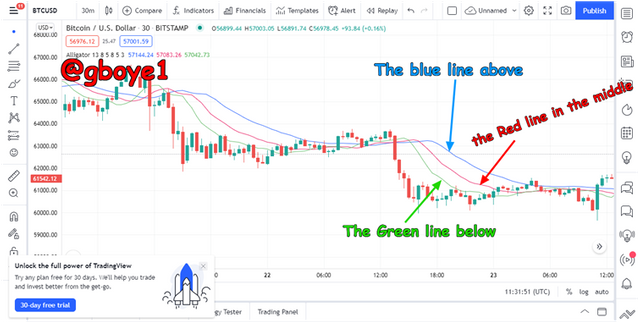
This is the reverse of the layout we had in the uptrend above.
We need to watch out for the following layout to observe a negative trend.
1.The blue line will be above the other lines
2.The red line will be in the middle
3.The green line will be below the two other lines
The points above are demonstrated for easy understanding in the image above.
As a result, once a trader notices the above-mentioned patterns building in either direction, predicting the trend's direction becomes easy.
** HOW TO USE THE ALLIGATOR INDICATOR TO UNDERSTAND SELL/BUY SIGNALS**
When utilizing an indicator, every trader wants to predict trends and find entry (buy and sell) signals. The Alligator indicator is no exception, as it is utilized to accurately detect buy and sell signals on an asset.
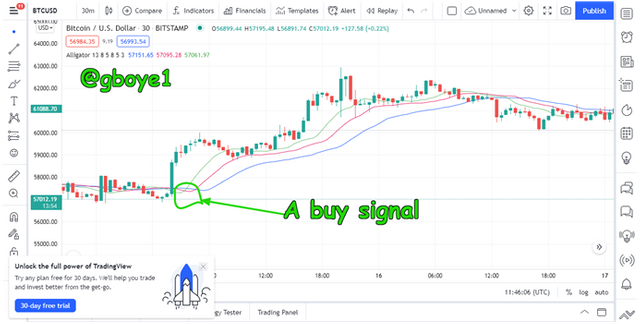
THE BUY SIGNAL
The buy signal is discovered using the Alligator indicator when the green moving average moves to the top of the other moving averages. When the green moving average or the lip goes to the top during divergence during the awakening stage, a buy signal is discovered.
THE SELL SIGNAL
The Alligator indicator notice a signal to sell when the blue moving average goes to the top of the other moving averages. When the blue moving average or the jaw advances to the top during divergence during the awakening phase, for example, a sell signal is discovered.
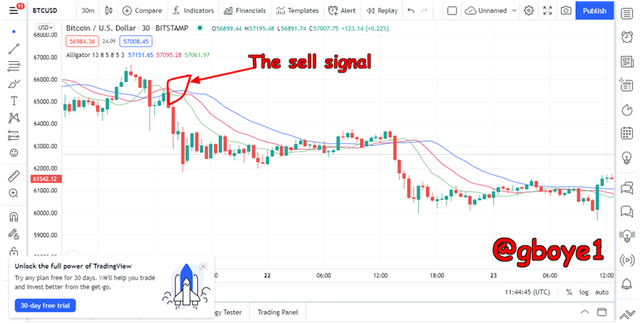
To confirm current trend strength and avoid establishing a position based on false signals, a trader should wait for at least three candles.
DO YOU BELIEVE THAT EMPLOYING THE ALLIGATOR INDICATOR IN A SCALPING TRADING TECHNIQUE IS EFFECTIVE? EXPLAIN THIS USING A CLEAR EXAMPLE.
Scalping trading is a popular trading approach that involves entering and exiting a trade position in a short amount of time. Scalping trading is the practice of taking modest profits from day-to-day price fluctuations.
The Alligator indicator is one of the most useful indicators for scalpers when it comes to identifying entry and exit positions in an asset.
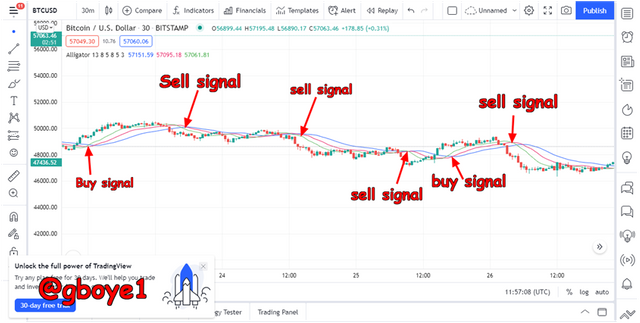
An example of 6 scalping trade opportunities can be seen on the BTCUSD chart. In addition, in a range market, the Alligator indicator provided precise buy and sell indications.
IS IT REQUIRED TO ADD ANOTHER INDICATOR TO HELP THE INDICATOR OPERATE AS A FILTER AND ELIMINATE UNNECESSARY AND FALSE SIGNALS?
As with any indicator, there is always the potential of false signals for one reason or another, and they must be used in conjunction with other indicators to assist in eliminating false signals and confirm trade signals. Because the Alligator indicator's timing delays due to its future positioning, it's vital to match it with other indications like the stochastic indicator.
The stochastic oscillator is an oscillator-based indicator that reveals whether a security has been overbought or oversold. It's also used to predict when a trend will change and to provide buy and sell signals. The stochastic oscillator is made up of two lines that move up and down in the indicator window.
It has a scale of 0 to 100. Oversold refers to a value of 0 to 20, overbought refers to a reading of 80 to 100, and neutral refers to a reading of 20 to 80. When the line crosses 20 and lower, it indicates that the asset has been oversold, that the sellers have run out of energy, and that buyers may take over. The point in the oversold region where the two lines cross is referred to be the buy signal.
When the Stochastic lines cross 80 and above, on the other hand, it indicates that the bullish trend is weakening, that the buyers are becoming weary, and that the sellers may take over. The point in the overbought zone where the two lines cross is sometimes referred to as a sell signal. Let's combine this Indicator (Stochastic oscillator) with Alligator and see how they work together now that we know how to read it.
You can see that I've added the Alligator Indicator and the Stochastic oscillator to the BTCUSD chart in the screenshot below.
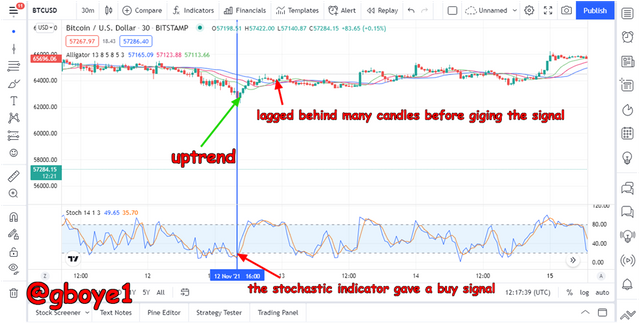
In the screenshot above, the alligator indicator produced a late signal which was detected by the stochastic indicator, so using these two indicators will minimize the loss rate of a trader
ADVANTAGES AND DISADVANTAGES OF THE ALLIGATOR INDICATOR
ADVANTAGES
1.The Alligator indicator is simple to grasp, especially for a novice traders, and has simple interpretation principles.
2.When compared to indicators using 1 or 2 moving averages, the Alligator indicator produces less false signals.
3.For scalping trading, the Alligator indicator is useful.
4.The indicator is uses the market's present behavior to predict its future outcome.
DISADVANTAGES
1.Like all other indicators, the Alligator Indicator generates false indications.
2.Alligator is always lagging because it is made up of three moving averages. This means that traders may miss out on an entry since the price has shifted before the signal is generated.
3.In a choppy or trendless market, the Alligator indicator does not perform well.
CONCLUSION
Technical Indicators are one of the techniques used in technical analysis to predict an asset's price movement. Bill Williams, a well-known man, devised the Alligator Indicator. The trend of a market asset is determined by the indicator. It indicates if the market is consolidating or trending. It is made up of three moving averages: alligator jaw (blue line), teeth (red line), and lips (green line) (green line). The indicator is in the sleep phase when the lines converge or are near to each other, and when they separate, a trend is forming. This indicator provides buy and sell signals. However, it, like other indicators, provides false signals. As a result, different indicators or tools must be combined to filter out false signals and boost the success rate.
Unfortunately @gboye1, your article contains plagiarized/Spun content
Rating Total|0/10
Source:
https://steemit.com/hive-108451/@reminiscence01/crypto-academy-season-5-week-3-advanced-crypto-trading-with-alligator-indicator
The Steemit Crypto Academy community does not allow these practices. On the contrary, our goal is to encourage you to publish writing based on your own experience (or as per the mission requirements). Any spam/plagiarism/spun action reduces PoB's idea of rewarding good content.
Thank you.
Cc: -@endingplagiarism @sapwood
Hello professor @kouba01
First of all I want to apologize for this!
Actually I never knew it is called spanning. I was trying to consult his work to apply his idea of how to do it couple with my research.
If you notice not all the post are similar. The only fault I made was that during the process, I copied his format which I admit is wrong.
I just want to look how he do his own homework since I don't have sufficient idea on how to do mine and also apply the idea to my already found research on the homework.
It wouldn't repeat itself again
Thank you