[How to Trade Cryptocurrencies Profitably Using TD Sequential]-Steemit Crypto Academy | S4W8 | Homework Post for @reddileep
INTRODUCTION TO TD SEQUENTIAL INDICATOR
Cryptocurrencies are highly volatile assets, and if caution is not exercised, one might lose all of his funds in a matter of minutes. This forces traders to conduct extensive research prior to making a trading decision. Asset analysis provides traders with the confidence to enter a market, whether it is to sell or buy. How do traders, on the other hand, conduct their analysis?
A fundamental or technical analysis of an asset can be performed. The term "fundamental analysis" refers to analysis that is done in its most basic form. Traders analyze the asset by looking at the project from the beginning, the team behind the project, the project's financial metrics in terms of circulating supply, total supply, maximum supply, the asset's current price, and lastly the project's or asset's onchain metric.
Technical analysis is the second type of analysis used in crypto trading. This form of analysis is carried out by looking at the asset's graph and chart. On the chart of an asset, several technical tools such as line, graph, and point are used to identify the price movement over time, the possibility of a price reversal, and the future direction of the assets under consideration.
Technical indicators are one of the tools that are used in technical analysis. Technical indicators are chart analysis tools that help traders understand an asset's volume, velocity, and volatility, as well as its price movement and future direction.
TD SEQUENTIAL INDICATOR
Many indicators have been developed to assist traders in making sound market decisions. The TD Sequential Indicator is one of the most notable. The TD Sequential indicator is a technical indicator created by Tom Demark, a technical analyst. It's a trend-following indicator. It detects or depicts the reversal of the trend as well as exhaustion. In essence, the TD Sequential indicator signals when an asset's price is about to turn around.
The TD Sequential Indicator is a popular technical indicator among cryptocurrency traders. We know that when an asset trades in one direction for a long time, say upward, it is ideal for the price to halt for a while and do a small retracement before continuing in that direction, or the price may entirely reverse and turn from upward to the downward direction.
The sequential indicator is made up of numbers that appear below the candle in a downtrend and above the candle in an uptrend, counting from 1 to 9 for the setup phase and 13 for the countdown period.
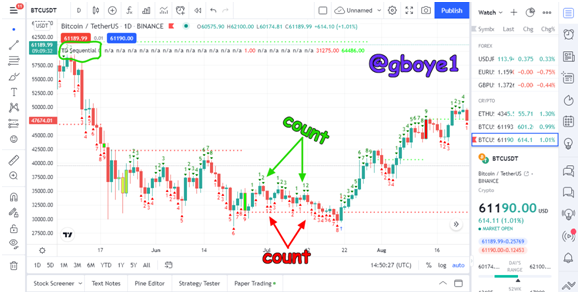
The setup phase and the countdown phase are the two key phases of the indicator. After a price flip, the setup phase begins, with a count of 9 above the candle in an uptrend and below the candle in a downtrend. For traders, the end of the ninth count is frequently a trading signal. The countdown phase is intertwined with the setup phase. It's only valid if the setup has taken place, and it's worth 13 counts.
Because the setup phase is a common phase in this indicator, we should pay greater attention to it. There's a buy setup and a sell setup now in the setup phase. We know that when selling an asset, the price should be at a premium, or when the asset is overbought, and that when buying an asset, the price should be at a discount, or when the asset is undervalued. This indicator can be used to set up a buy or sell order.
THE PSYCHOLOGY BEHIND TD SEQUENTIAL
The TD sequential indicator, as previously said, is majorly used to determine the point of trend exhaustion or price reversal. The indicator is made up of special counts ranging from 1 to 9 that appear below and above each candle.
Because the counts are intended for each candle or bar featured in a chart, the Japanese candlestick or bar chart is utilized to display this indicator. The numbers used to customize this indicator are used to form it. The setup phase and the countdown phase are two independent phases of the indicator.
When the market moves in the downward direction, TD Buy Setup occurs, and when the market moves in the upward direction, TD Sell Setup occurs. The TD Setup Phase is made up of 9 numbers that are placed above or below the Candles. A market reversal or correction may occur after the 9 digits.
For the TD Buy Setup, when the market is trending downward and the numbers are below the Candles, there may be a correction or reversal after 9 numbers, at which point we can open a Buy Position.
When the market is trending upward and the numbers are above the candles, we can expect a correction or reversal after 9 numbers, at which point we can enter a sell position.
The TD Countdown Phase comprises 13 numbers above or below the Candles, which often signify Support and Resistance levels after 13 numbers.
THE TD SETUP DURING A BULLISH AND A BEARISH MARKET
In this part, I will be explaining the procedure to run the TD setup during a bullish and bearish market.
TD SETUP FOR BULLISH MARKET
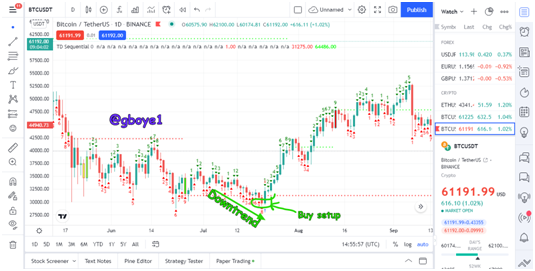
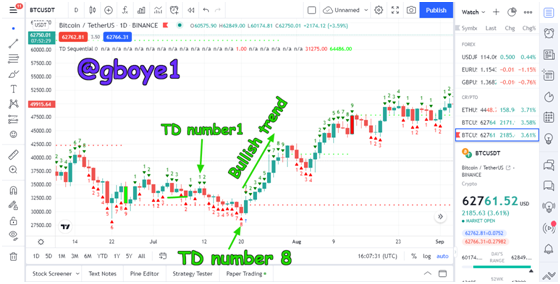
When the market moves downwards, it creates a bullish market point or a buy setup. When the market is trending downward, we can use TD Setups to determine the reversal point and hence indicate a bullish market.
To do so, we must examine the TD Number 1 Candle, which closing must be lower than the closing of the previous four candles, and then all candles from Number 2 should be in a downward direction.
There will be a reversal in the market after TD Number 8 or 9, which will be a Bullish Market, and we may begin a Buy Position there.
Here's an example of the TD Setup in a Bullish Market:
TD SETUP BEARISH MARKET
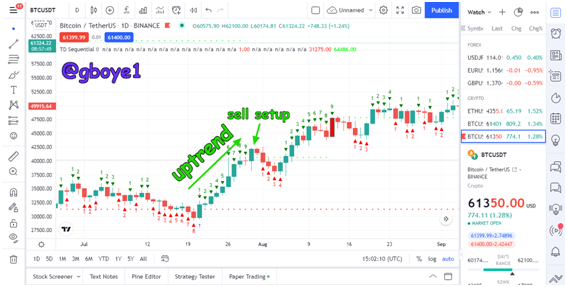
To begin, add the TD Sequential Indicator to the chart, and then, as we all know, TD Sell Setup occurs when the market moves upward. We must examine the Chart Candles for this Setup in order to do this. Bearish Market or Setup requires certain conditions to be met.
In TD Setup, there are numbers above and below the candles. So, we must look at the TD Number 1 Candle, which must be a bullish candle, and the closing of the TD Number 1 Candle must be higher than the close of the previous 4 Candles, all of which must be in a bullish direction, indicating that the market is overextended.
And, starting with the first candle, the next four candles should close above the previous four candles, and then, when 8 or 9 candles have formed, there will be a reversal, indicating a Bearish Market, where we can open sell positions.
Here's an example of the TD Setup in a Bearish Market.
HOW TO IDENTIFY A TREND REVERSAL USING TD SEQUENTIAL INDICATOR IN A CHART GRAPHICALLY
I'll describe how to use the TD sequential indicator to identify trend reversal in this section of the question. To illustrate it, I'll use a chart, thus Tradingview will be the platform I will use.
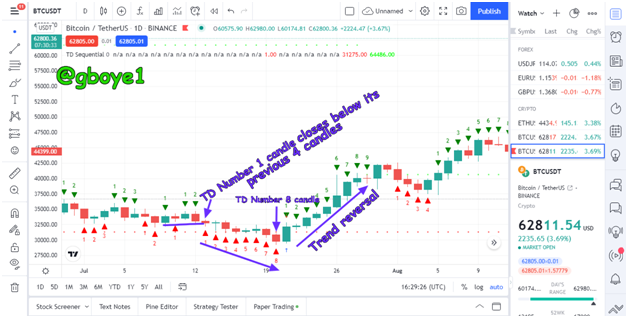
DOWNTREND REVERSAL
We must first add the TD Sequential Indicator to the chart and then examine it. The market should be trending downward, i.e. its price should be falling.
Numbers will be added to the Candles of the Chart after using the TD Sequential Indicator. We will look for Candles to identify trend reversal if there is an ongoing downward trend.
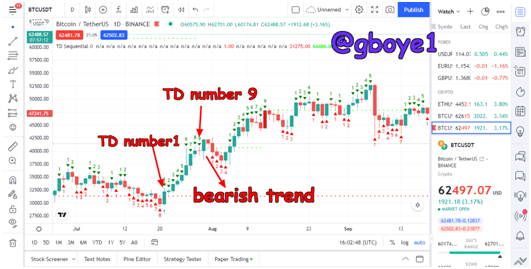
We need to look at the TD Number 1 Candle, and its closure must be lower than the closing of the previous 4 Candles.
As a result, the TD Number 1 Candle will travel downward, and it will continue to move downward until it reaches TD Number 8 or 9, after which there will be a Trend Reversal, and the market will go upward.
UPTREND REVERSAL
There should be an ongoing uptrend before we look for Candles to indicate a trend reversal.
We must examine the TD Number 1 Candle, and the TD Number 1 Candle's closing must be higher than the closing of the previous 4 Candles.
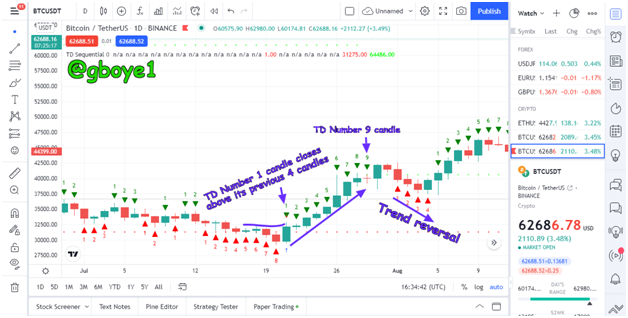
As a result, the TD Number 1 Candle will rise upward, and it will continue to do so until it reaches TD Number 8 or 9, at which point there will be a Trend Reversal, and the market will go downward.
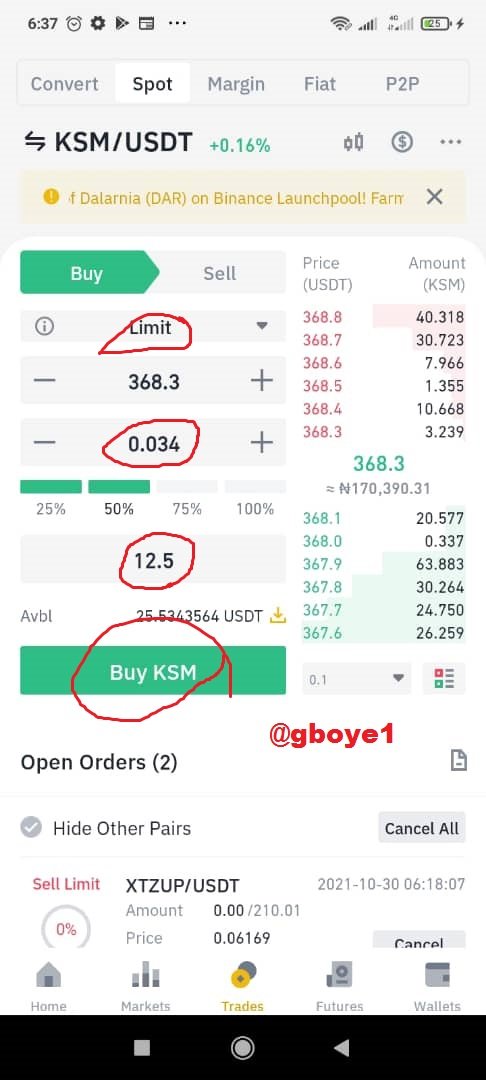
TRADING KSM/USDT ON BINANCE USING TD SEQUENTIAL AND RSI INDICATOR
The technical analysis is found below:
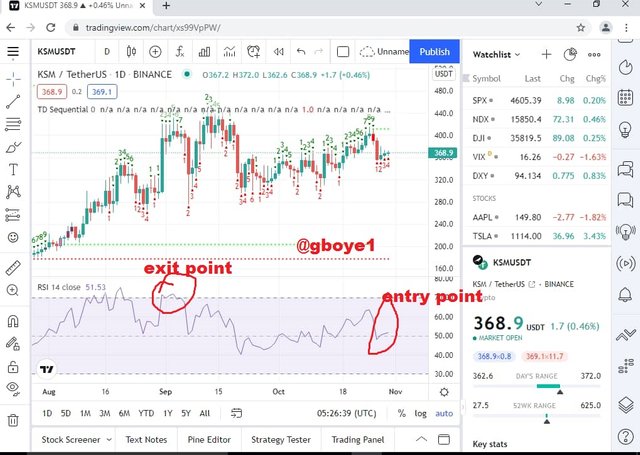
The coin according to the indicators was heading for a bull run, as shown in the chart above the exit is determined by the uptrend above the indicator line and the entry point was the movement just below the line. therefore I made the purchase.
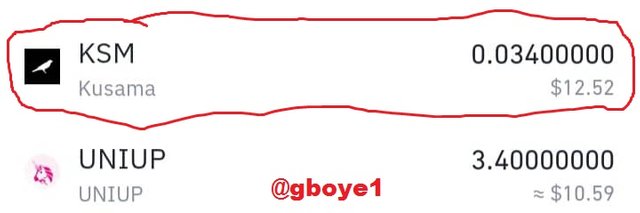
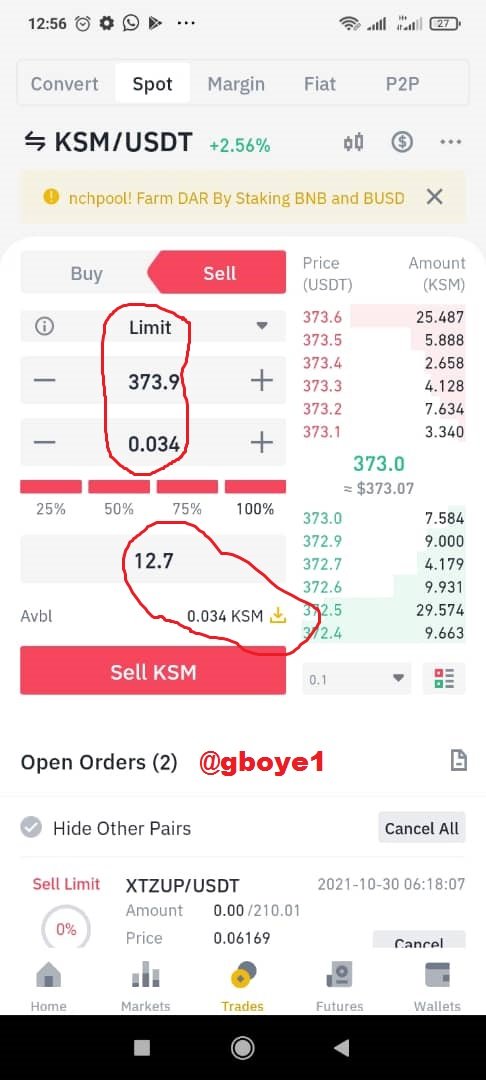
The below are the trade on Binance:
CONCLUSION
The TD sequential indicator is a good crypto trading indicator that confirms trend exhaustion and asset price reversal. It should be highlighted, however, that no single indicator should be employed, therefore it is advisable to use the TD sequential indicator with another indicator.
#club5050 😀