Metrics Indicator - Crypto Academy / S5W2 - Homework Post for @pelon53
INDICATE THE CURRENT VALUE OF THE PUELL MULTIPLE INDICATOR OF BITCOIN
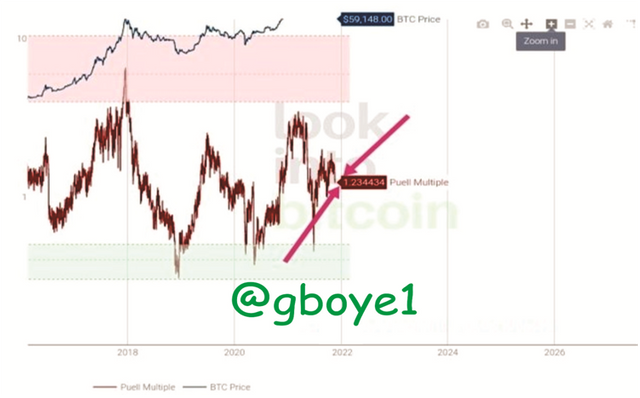
The Puell Multiple indicator is a market metric that measures the amount of sell tension in the market caused by miners.
Traders frequently employ the Puell Indicator to forecast the direction in which a certain cryptocurrency asset will move next. I'll expand on this as the discussion progresses.
THE USE OF PUELL MULTIPLE INDICATOR
Traders can use the Puell Multiple Indicator to swiftly calculate a distant worth that captures how strong mining income is on any one day compared to a wide range of prior days in the year.
A high Puell multiple could indicate that sellers have less sell tension, while a low Puell multiple could indicate that miners have a lot of sale tension. Given the volume of bitcoin mined, determining how much pressure miners are under to sell could indicate where the price is headed in the short term.
THE PRESENT WORTH OF THE PUELL MULTIPLE INDICATOR IN REGARDS TO BITCOIN
The puell multiple indication was worth $1.234434 at the time this task was written.
USING THE PUELL MULTIPLE, PERFORM A TECHNICAL ANALYSIS OF THE LTC
Now I'll use the Puell Multiple Indicator to perform technical analysis on the LTCUSD pair.
Don't forget that this indicator shows two stripes. The upper stripe (directed at with the second arrow) is red in color, indicating that the miners have a high likelihood, while the lower stripe (pointed at with the first arrow) is green, indicating that the miners have a limited capacity.
Let's get down to business with the analysis.
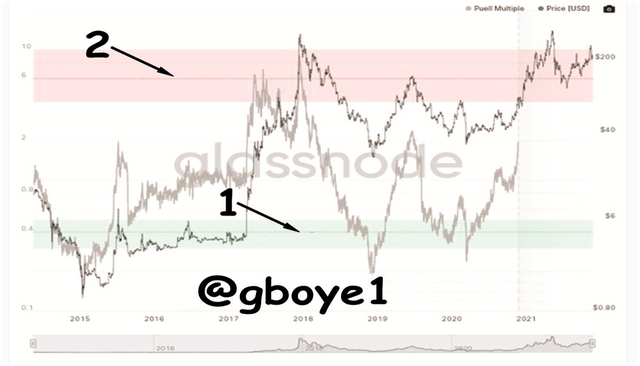
The indicator crossed the green zone, the lower stripe, in the year 2015, and we all know that this is a buy signal for investors. Now, the cost is roughly $1. So, when the initial buy signal came in, investors bought litecoin from the stated amount up to $6 before the asset saw a large pullback and reached the bottom zone, where investors accumulated more of the asset at around $4. Since then, buyers have been buying the asset all the way up to the red zone, which is around $90. Buyers exit buy trades by selling their assets and taking a profit.
In mid-2017, sellers stepped in and sold litecoin for around $20 until a small buy sent the currency back into the red in 2018. Since then, litecoin has been on a strong downward trend. The sellers took control of the asset at a price above $200, and the sale lasted until the year 2019, when the price closed at around $25, and the indicator entered the green zone, signaling a buy entry for investors.
From that year through the mid-year close of $155 in 2019, investors acquired litecoin, and the asset then turned downward, returning to the green, lower stripe in 2020, giving investors another chance to spend more.
The price of litecoin has been rising since February/March 2020. During this moment, the rally movement begins at a price of around $30. From this pricing, litecoin has continued to rise, reaching an all-time high of $412 in May of 2021. It has fallen a little to the downside at times, and it is currently a touch above $200 in November. To be more specific, the current value of this asset, litecoin, is $211 at the time of this analysis.
Time will tell if the price will continue to rise. However, the Puell Multiple Indicator is currently set to a scale of 2. That is to say, it is not yet near to the upper stripe. Until the Indicator reaches the top stripe, investors still have a chance to take it high. The start of the upper stripe should be the exit point for the purchase entry because this is when investors normally sell the asset. The blue horizontal line denotes it. A red horizontal line marks the end of the lower stripe for sell entry, whereas a red horizontal line marks the end of the lower stripe for buy entry.
WHAT IS HALVING?
Bitcoin halving is a programmed process that divides the bitcoins that miners receive as a reward for creating a new block. It was created with the goal of energizing mining through proof of work.
Bitcoin was the first digital currency to implement a halving mechanism. This is due to the fact that the number of bitcoins that may be created is limited, with a ceiling of 21 million bitcoins established in the Bitcoin code.
This programmed cycle is known as halving, and it is used to designate a specified time for the coin's issue to end.
The Bitcoin halving began in 2012, when the mining incentive was halved from 50BTC to 25BTC. This reward halving will continue every four years until the circulating supply of bitcoin has been reached.
WHAT IS THE IMPORTANCE OF HALVING?
The practice of halving is employed to regulate the supply of coin in circulation. The Bitcoin supply is limited to 21 million BTC, after which no further coins will be issued. We all know that as a commodity's supply drops, its value rises due to scarcity. As a result, halving is one of the methods for regulating cryptocurrency supply.
The reward for miners decreases as the number of BTC added to circulation decreases when halving occurs. Despite the fact that the reward has been half, the price has increased, keeping the miners' incentive up. As a result, halving increases the scarcity and value of Bitcoin.
THE NEXT REWARD VALUES THAT MINERS WILL HAVE
The following reward analysis will be presented in a tabular manner. As previously said, a new block is mined every 10 minutes, resulting in the halving of bitcoin every four years when 210,000 blocks are formed, and the reward of miners is halved after successful completion of every 210,000 blocks made.
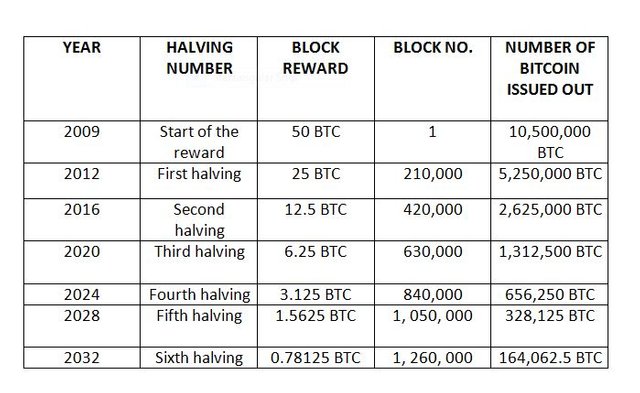
This process will repeat every four years until the bitcoin supply reaches its maximum. The last halving is anticipated in the year 2140, when bitcoin's total supply will be 2 million BTC.
ANALYZING THE HASH RATE INDICATOR USING ETHEREUM
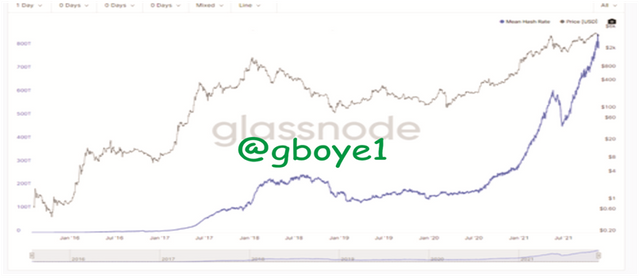
The hash rate indicator can be thought of as a metric for calculating the overall processing power employed by miners to validate transactions on the Blockchain. The amount of miners actively engaging in Blockchains like Ethereum and Bitcoin that employ the POW consensus process secures the Blockchain; the more miners, the higher the hash rate, and hence the more secure the Blockchain. To compute the Hashrate of a Blockchain, the Hash rate indicators use the number of blocks being mined and the difficulty of the blocks being mined.
Although the hash rate indicator does not precisely show the hashing data, it is a measure of how many miners are actively engaging in mining and verifying transactions on the Ethereum Blockchain. The hash rate of ethereum is currently 802,373,848,944 per second.
The number of hashes estimated is used to calculate the value the miners in the ethereum blockchain produce per second.
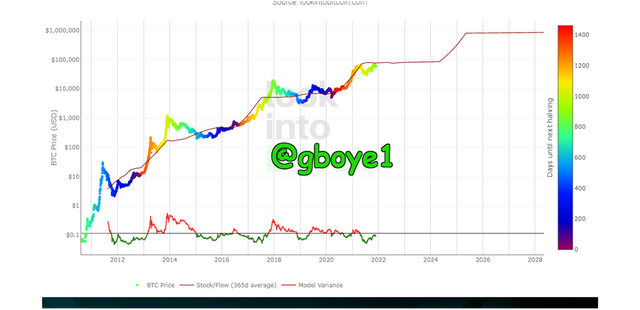
CALCULATE THE CURRENT STOCK TO FLOW MODEL. EXPLAIN WHAT SHOULD HAPPEN IN THE NEXT HALVING WITH THE STOCK TO FLOW. CALCULATE THE STOCK TO FLOW MODEL FOR THAT DATE, TAKING INTO ACCOUNT THAT THE MINERS' REWARD IS REDUCED BY HALF. SHOW SCREENSHOTS. REGARDING BITCOIN
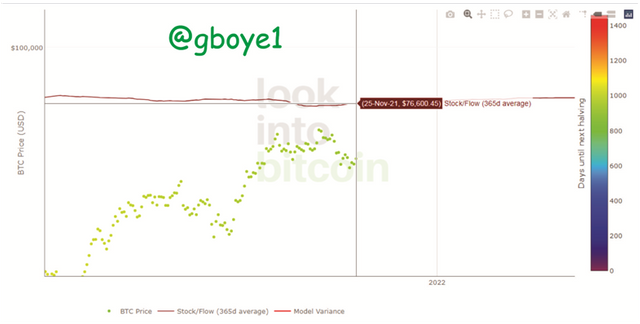
I'll calculate the current stock flow and the stock flow in the following halve in this task. So, without further ado, let's get to work on the calculations.
The calculation used for stock to flow is:
SF = STOCK / FLOW
And Flow can be calculated as;
FLOW= REWARD / BLOCK X ANNUAL BLOCKS PRODUCED.
And we know that the current reward of mining a block is 6.25BTC
Now to now the annual block production, let's see the calculation below:
1 block is mined every 10 Minutes
144 block is mined every 24 hours
Therefore the annual block mined will be 144x365 = 52,560 Blocks
So the annual block production is 52,560 and the current reward is 6.25BTC
Now let's calculate flow
Flow= Reward / Block x Annual blocks produced.
Flow = 6.25 x52,560
Flow = 328,500 BTC
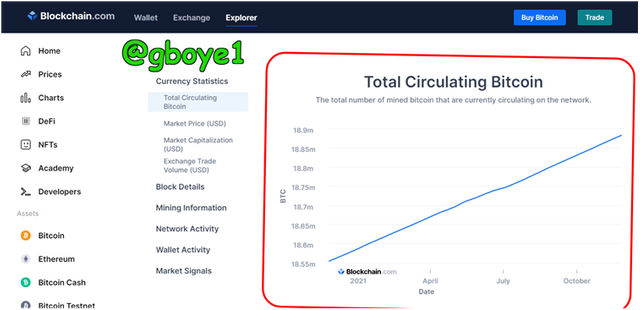
The current circulating supply of BTC is 8,882,000, as shown in the image above. This is the Bitcoin that is in stock. As a result, the current stock is 18,882,000
Thus,
SF = Stock / Flow
SF = 18,882,000/382,500
SF = 57.479452055
Now The Stock to Flow Model can be calculated by using;
Stock to Flow model = 0.4 x SF ^ 3.
SF model = 0.4 x (57.479452055)^3
SF Model = 0.4 x 189905.63789446812
SF Model = 75962.25515778725
SF Model = 75,962.26 BTC
In the year 2024, the next halving will take place. The reward for mining a block will be reduced to 3.125 BTC in the near future, and 656,250 BTC (3.125BTC x 210,000) will be added to the existing BTC circulating supply.
Now let's calculate stock to flow for this.
SF = Stock/Flow
Stock in the next halving = Current stock + the one that will be added
= 18,882,000 + 656,250
Stock in 2024 = 19,538,250
Flow =Reward in 2024 x Block added in a year
Flow = 3.125 x 52,560
Flow = 164,250
SF = 19,538,250 /164,250
SF = 118.954
Now let's calculate Stock to Flow model
Stock to Flow model = 0.4 x SF^ 3.
Stock to Flow model = 0.4 x (118.954)^ 3.
SF Model = 0.4 x 1683205.53
SF Model = 673,282.21
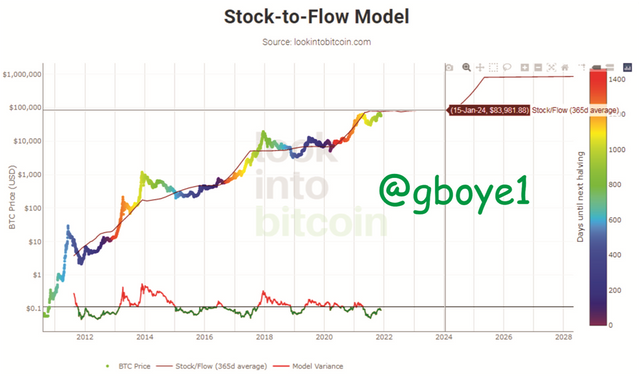
As can be seen, the Stock to Flow model would expand from 75,962.26 BTC to 673,282.21 BTC in 2024. The stock to flow model chart likewise shows an increase in the table above.
CONCLUSION
The Puell Multiple indicator has proven to be very useful in the crypto market, as it can assist traders in determining the best position in which to execute a trade (Enter or Exit), and the Hash rate indicator can also signal to us the amount of people investing in crypto coin mining, which we can use to make a position with, in a scenario where we can make an investment when we see the Hash signal forming up and avoid making an investment when the hash rate indicator is not forming up.
As the SF ratio is the proportion of the availability to the current Flow of the market, the Bitcoin Stock Flow can also tell us what position bitcoin will take next.