Starting Crypto Trading - Steemit Crypto Academy |S6W1 - Homework Post for Professor @pelon53
Question 1
In your own word, what is fundamental analysis? Do you think it's important for a trader? Justify the answer
Answer
I will be explaining the meaning of fundamental analysis and also offer my opinion on how relevant it is to a trader.
Fundamental Analysis also known as macroeconomic event analysis is one of the techniques used by traders in the financial world to foresee the price direction and movement. You see, the financial market is known to be very volatile and tends to move in trends.
These trends do not happen on their own, they are influenced by some circumstances or factors such as;
• supply and demand of the coin
• investor sentiments
• regulations from the government
• media promotions
• Cryptocurrency partnership with major brands.
• Announcement of its listing on exchanges
• Burning of coins to reduce its supply.
• Network improvements.
Based on these factors, traders are able to predict the price movement of the assets before they occur. For instance, Binance announced the listing of Anchor Protocol (ANC) on the 25th of last month, this day saw a rise in the price of the ANC token
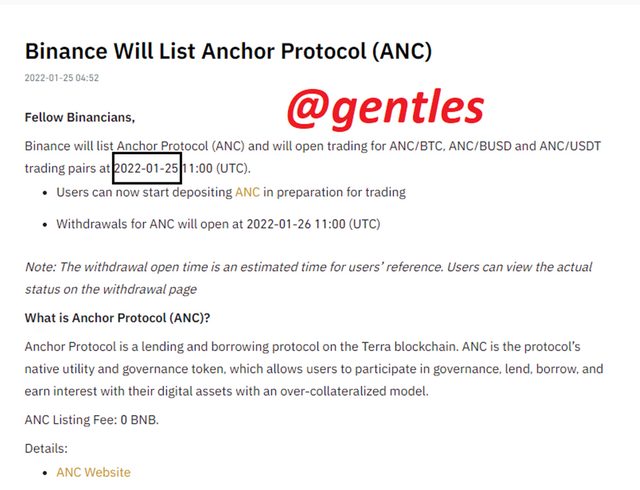 ANC listing announcement
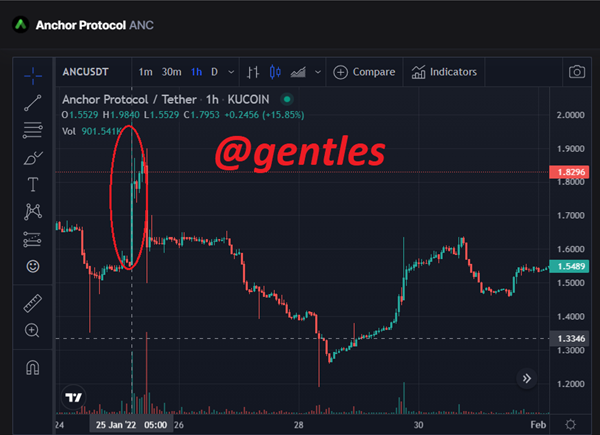
rise of the price of ANC when its listing on Binance was announced on 25 Jan 2022
Fundamental analysis was the type of trading analysis that traders mostly used in the past until the introduction of technical analysis. As fundamental analysis seeks to determine crypto prices by trying to measure their elemental value. It examines everything from the demand and supply of the coin, investor sentiment government regulations, etc all these are scrutinized when it comes to fundamental analysis. Technical analysis on the other hand is used by traders to predict prices trends using sophisticated statistical trends such as price movements and volumes of the coin. It makes use of cryptocurrency charts to determine trends and patterns that propose the behavior of the crypto in the coming future.
This type of analysis has its disadvantages such as the requirement of a very detailed economic calendar of events to predict with high accuracy. Some other important factors that affect the price of cryptocurrencies are not taken into consideration
Do you think it's important for a trader
Yes, I think Fundamental analysis is very relevant to a trader. A good trader should be well equipped with the knowledge of fundamental analysis no matter the technique he is using. As explained earlier, the fundamental analysis uses past, present, and future financial events which influence the supply and demand of the crypto to determine the future behavior of the coin as they are very volatile.
Traders who are very well aware or up to date on financial events are sometimes ahead of price movements and place their trades according to the event that has happened or is about to happen. Traders using technical analysis on the other hand do not take some of these factors into account and the market sometimes may surprise them with a sharp turn.
For instance, just two weeks ago Elon Musk made a tweet that caused Dogecoin to rise to about 9%
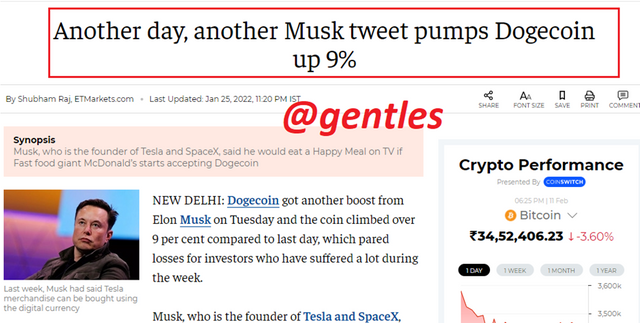
Traders who missed out on thi tweet will be surprised by a sharp turn of the price which can never be predicted by any statistical procedure. Traders who bought the coin before this tweet will be very happy as they will gain profit and those who bought the coins before the tweet will definitely regret that order.
Hence, fundamental analysis is very essential to traders so it’s good to have some knowledge about it.
Question 2
Explain what you understand by technical analysis and show the differences with fundamental analysis
Answer
Technical analysis has been mentioned earlier. This cryptoanalysis technique is another form of cryptoanalysis. As fundamental analysis tends to be based on financial and economic events around an asset, technical analysis is based on more detailed information like the historical price data of the coin.
It encompasses the use of the volume of the asset traded, the price movement of the asset, and some technical indicators to determine the price of the asset in the coming future. They assist the trader to find good market entry and exit points, determining the volatility of the asset, and identifying its price trends.
These factors are based on the past behavior of the asset which is bound to be repeated so they are studied and applied to predict the price.
There are a lot of technical tools that traders use to do their analysis on the charts. Some of the most used ones are candlestick patterns and drawing tools. They can also be used together with indicators to increase the accuracy of the prediction. This form of analysis is can be very complicated for traders with little or no knowledge, however, it can be easily assessed when the right tools and indicators are used.
Differences Between Technical and Fundamental Analysis
• Fundamental analysis is highly based on the use of financial and economic news to help to determine the future price while technical analysis is based on old volume and price charts to predict the coming price.
• The needed data such as economic events used for the fundamental analysis of an asset are hard to come by unlike the data used in technical analysis. The price charts can be easily accessed during the use of technical analysis.
• Fundamental analysis does not make use of some factors like volumes and price records that might also influence the future price of the asset, however, with technical analysis these factors are considered and used. Similarly, some factors used in the fundamental analysis are also missed out on in the technical analysis.
• Fundamental analysis is mostly used by investors or traders to make long-term trading and investment decisions whereas technical analysis is mostly used for short-term trading.
• Fundamental analysis targets the elemental value of the asset which does not provide details on when to enter or leave the market. Technical analysis on the other hand provides the trader with the best time to enter and leave a market for profits.
Both of these analysis methods may have different data collection methods and objectives, however, they can be used together side by side to make more accurate trading decisions.
Question 3
Executing a Sell Order in the Cyprocuurency Market Using Support and Resistance
Answer
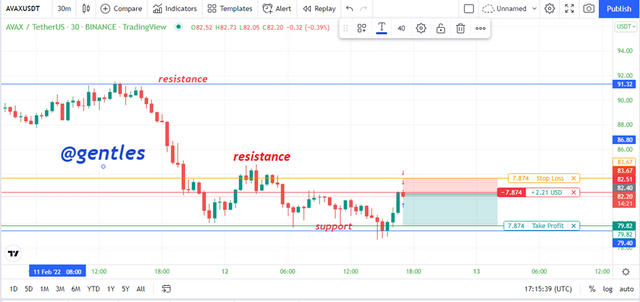
AVAXUSDT Sell
As seen from the AVAXUSDT 30mins chart below, I have spotted areas of the support and resistance levels where buying and selling were occurring in high volumes. On the chart, I notice that the price is moving away from the resistance that was formed. Normally, the price is supposed to get bounced back at a resistance level. I then placed a sell limit order at 82USDT and set a stop loss at 82.51 to protect myself from too much loss and take profit at 79.82USDT. The details of the trade can be seen below.
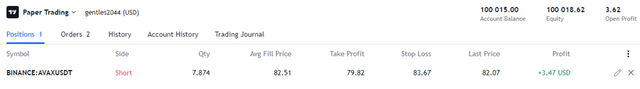
After some few minutes, I was already making some profits which were about 3.47USD
Question 4
In a demo account, execute a buy order in the cryptocurrency market, placing the support and resistance lines in time frames of 1 day and 4 hours.
Answer
ETHUSDT buy
As seen from the ETHUSDT 4hrs chart below, I have spotted areas of the support and resistance levels where buying and selling were occurring in high volumes. On the chart, I notice that the price is moving away from the resistance that was formed. Normally, the price is supposed to get bounced back at a resistance level. I then placed a buy limit order at 82966.15USDT and set a stop loss at 242USDT to protect myself from too much loss and take profit at 3129.14USDT. The details of the trade can be seen below.
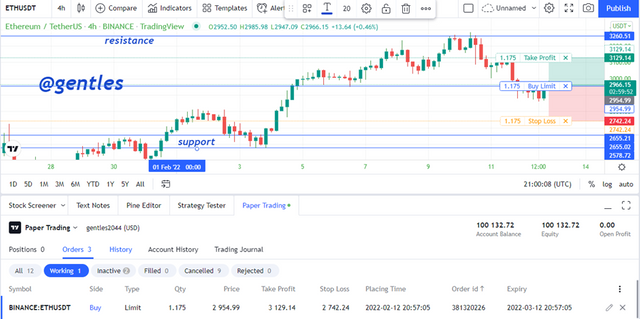
I placed this order because the price movement has broken the resistance point, this is a signal of an upcoming uptrend. Information on the trade is shown in the screenshot below. I have not made any profit on this trade yet, but I am hoping to.
Question 5
Explain the “Hanging Man” and “Shooting Star” candlestick patterns. Show both candlestick patterns on a cryptocurrency market chart. Screenshot is required.
Answer
I will be talking about the Hanging man and the Shooting Star candlesticks patterns in this section but before I go into them, I will give a short history of candlesticks. Candlesticks are a very essential part of crypto trading specifically technical analysis tools. They are made to show a real-time picturesque demonstration of how buying and selling of the asset are ongoing. Traders use them to determine the part of the market that is currently controlling the price of the asset. these candlestick patterns are able to signal price reversals and price continuations.
Hanging Man
The hanging man is very essential when it comes to technical analysis. It is a Japanese candlestick pattern that takes part of an essential role when it is found at the peak of a bullish trend. It is a single candlestick that has a short body with a long bottom shadow.
Requirement of a candlestick to be called a hanging man
The hanging man candlestick is characterized to be;
• It is part of an uptrend
• The opening and closing prices are close together to form a short body
• The bottom wick should be seen clearly
• There should be no or very small upper shadow
A picture of a hanging man candlestick is shown below
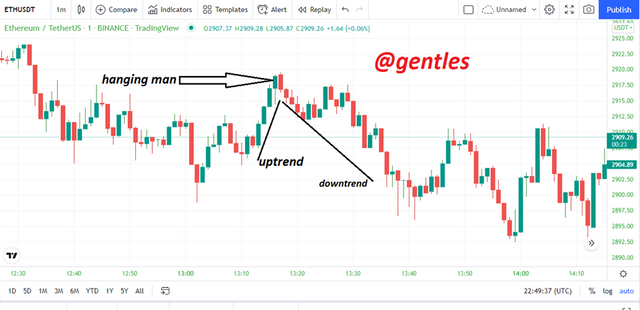
What actually happens behind it is that during the opening of the price sellers place orders that drag down the price buyers in turn place orders that push the price back up then it closes very close to where the price opened.
What does it signify
This candlestick informs the investor or trader that the uptrend is not strong and a price reversal is imminent which means a downtrend is possible to happen during the uptrend. The best move during the formation of this candlestick is to place a sell order.
Shooting Star
The shooting star is almost the opposite of the hanging man candlestick. It is a single candlestick that forms just after a bullish trend. Its difference with the hanging man is that it has a longer upper wick and a very small or no lower shadow.
Requirement of a candlestick to be called a shooting star candlestick
The hanging man candlestick is characterized to be;
• It is part of an uptrend
• The opening and closing prices are close together to form a short body
• There should be little or no bottom wick
• The upper wick should be seen clearly
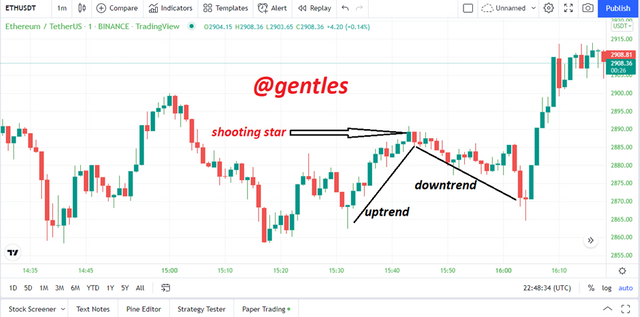
What does it signify?
This candlestick also gives a price reversal signal, when there is an exhaustion in the bullish trend, the long upper wick is formed which means that the sellers are controlling the price which weakens the buying control of the market. The opening price and closing price of that candlestick are formed close together to form a short body.
Conclusion
There are various ways to analyze a cryptocurrency to gain profit from its trade by predicting the future price of the coin. One of them is the fundamental analysis which makes use of economic and financial events to determine the future price, another one is the technical analysis which makes use of more detailed information of the crypto coin like past prices and volumes to determine the future price. Traders study these figures in the hope that they will repeat themselves.
A good trader should have a fair knowledge of these two analysis techniques to make better decisions during a trade. So if you have more experience in fundamental analysis, you should learn more about technical analysis too.
We also have candlesticks that also help us to trade better. There are various forms of them but we talked about the hanging man and shooting star candlesticks. They both help the trader to identify an upcoming upwards price reversal for them to prepare for it.
Much gratitude to @pelon53 for this lecture.