Crypto Academy| Season 4 - Week 1 | Homework Post for [@allbert ] : Trading with Levels: Strong, Weak, & Gaps

Hello Friends,
It's my pleasure to write my homework task for professor @allbert on Trading with Levels: Strong, Weak, & Gaps. I will try to cover all the questions with whatever I have known/understand so far.

- Graphically, explain the difference between Weak and Strong Levels. (Screenshots required) Explain what happens in the market for these differences to occur.
Strong Level:
There are a lot of factors to consider when it comes to crypto trading, and Support and Resistance are two of the most essential. A strong level implies that the support and resistance levels are solid and that the price is suffering price rejection/pullback from the support and resistance levels, respectively. When a price hits a certain position numerous times but is unable to cross it, then that will be our resistance level or vice versa. We also use that price point as our support when it's repeatedly touched by a price lower than it could ever go.
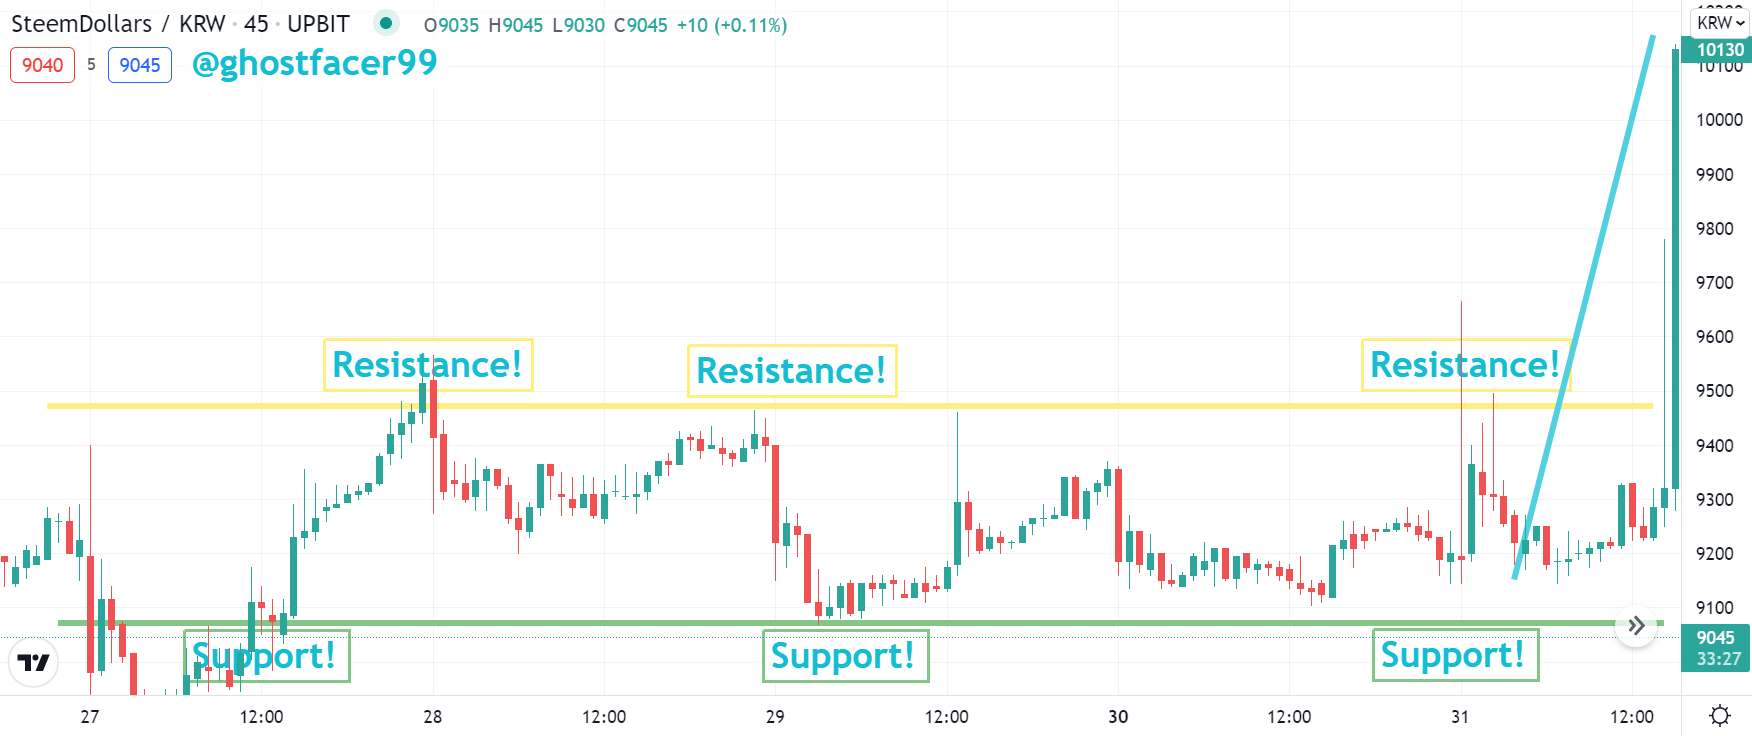 ~Example of Strong Support~
There are several support & resistance areas on the above chart screen image that the price has come to, but not crossed. Here, we can see that the price movement has reached an important support level. The number of trades and the volume of trades are the primary elements in this formation. At some point, it began to thrust out from the support as strong support was created.
Weak Level:
When compared to the Strong level, the Weak level demonstrates that the Support & Resistance (S&R) levels are not so reliable. Fortunately, nothing lasts forever in this world. Because of the weak support & resistance levels, the price can cross those levels and break them. Daily, we can observe that everything seemed to be going fine, and then the price breaks.
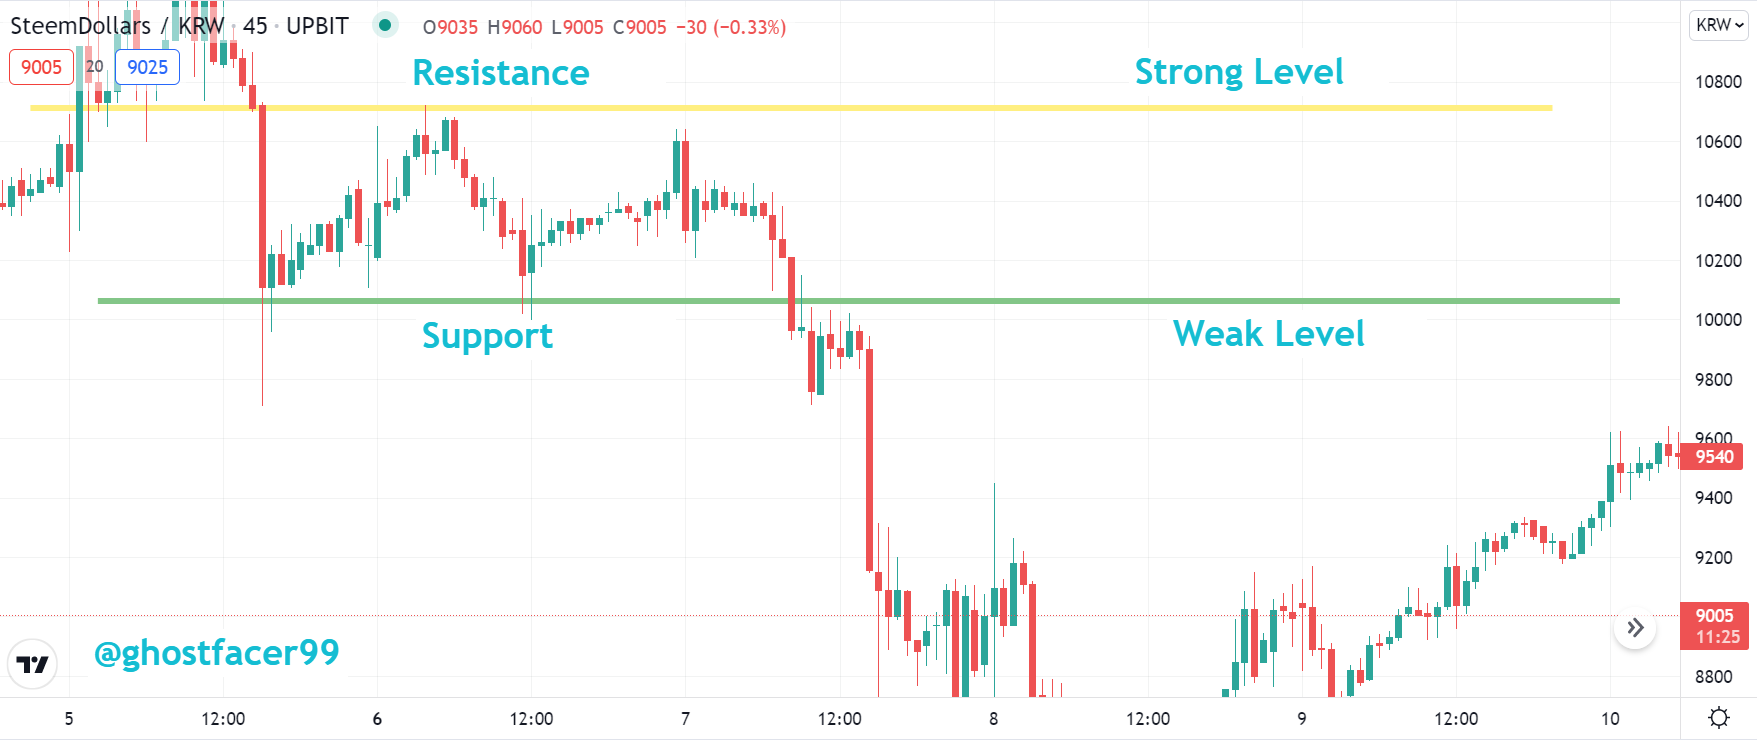 ~Example of Weak Support~
Many levels of support and resistance are shown in the screen capture. After breaking through the support level and even returning to resistance, it couldn't hold its position and fell down again. Weak levels are indicated by this. This is due to a lack of transactions and volume in the market.
- Explain what a Gap is. (Required Screenshots) What happens in the market to cause It.
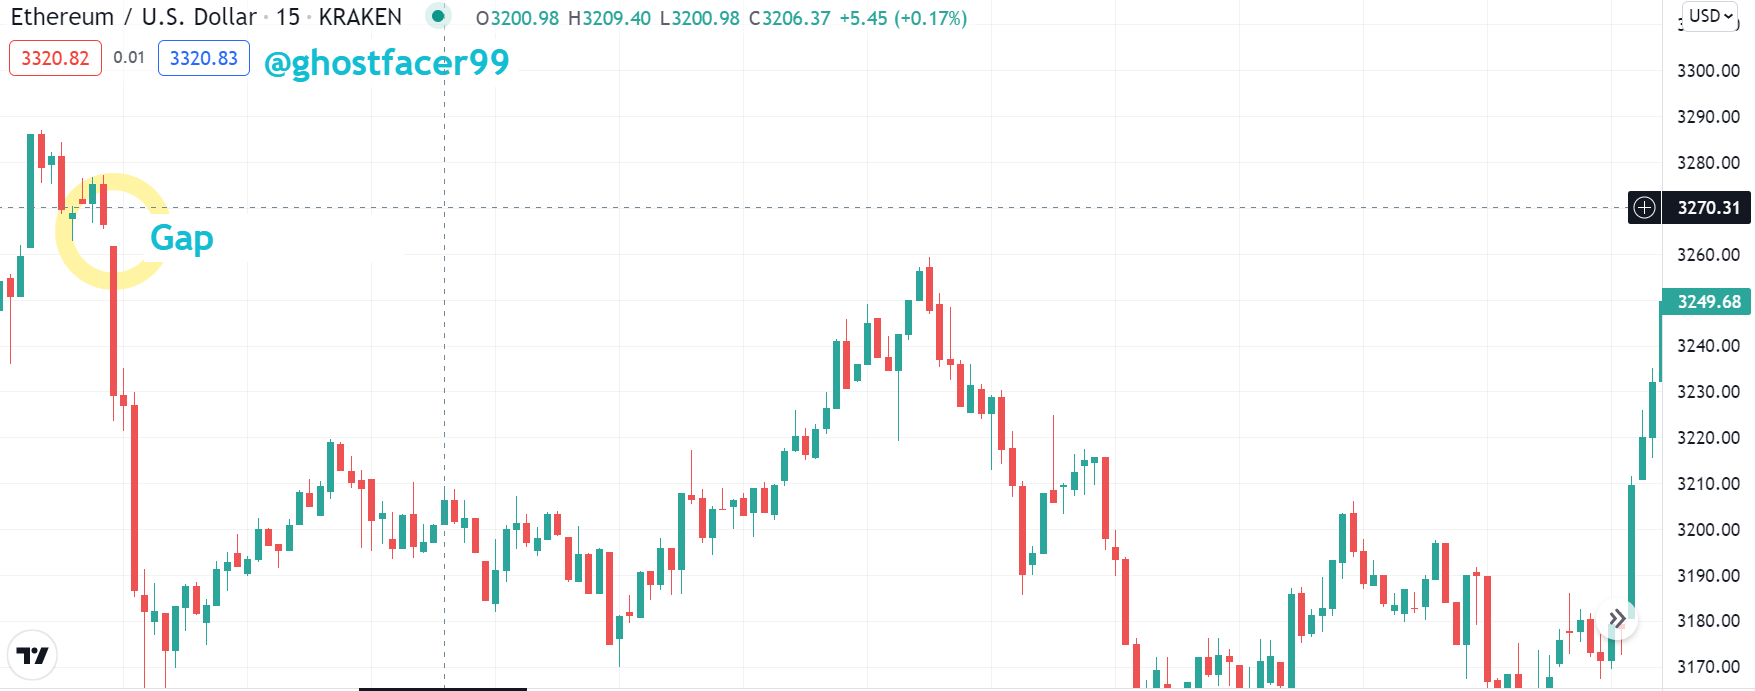 ~Example of Gap~
A gap is a price rise in a cryptocurrency asset that shows on the chart, indicating that the price has crossed a particular level and formed a new level without the previous level. In this instance, the price indicates that it has opened a new price after the previous closing price, yet there is a price difference between the two. You can view and evaluate the chart based on the creation of a new candlestick that does not match the closure of the previous candlestick due to the empty candlestick in the middle.
A sudden increase in price owing to a huge volume of transactions or a very low price might generate a gap in any trade. Market gaps generally close over time and can be considered as support and resistance levels.
- Explain the types of Gap (Screenshots required, it is not allowed to use the same images of the class).
Runaway Gap:
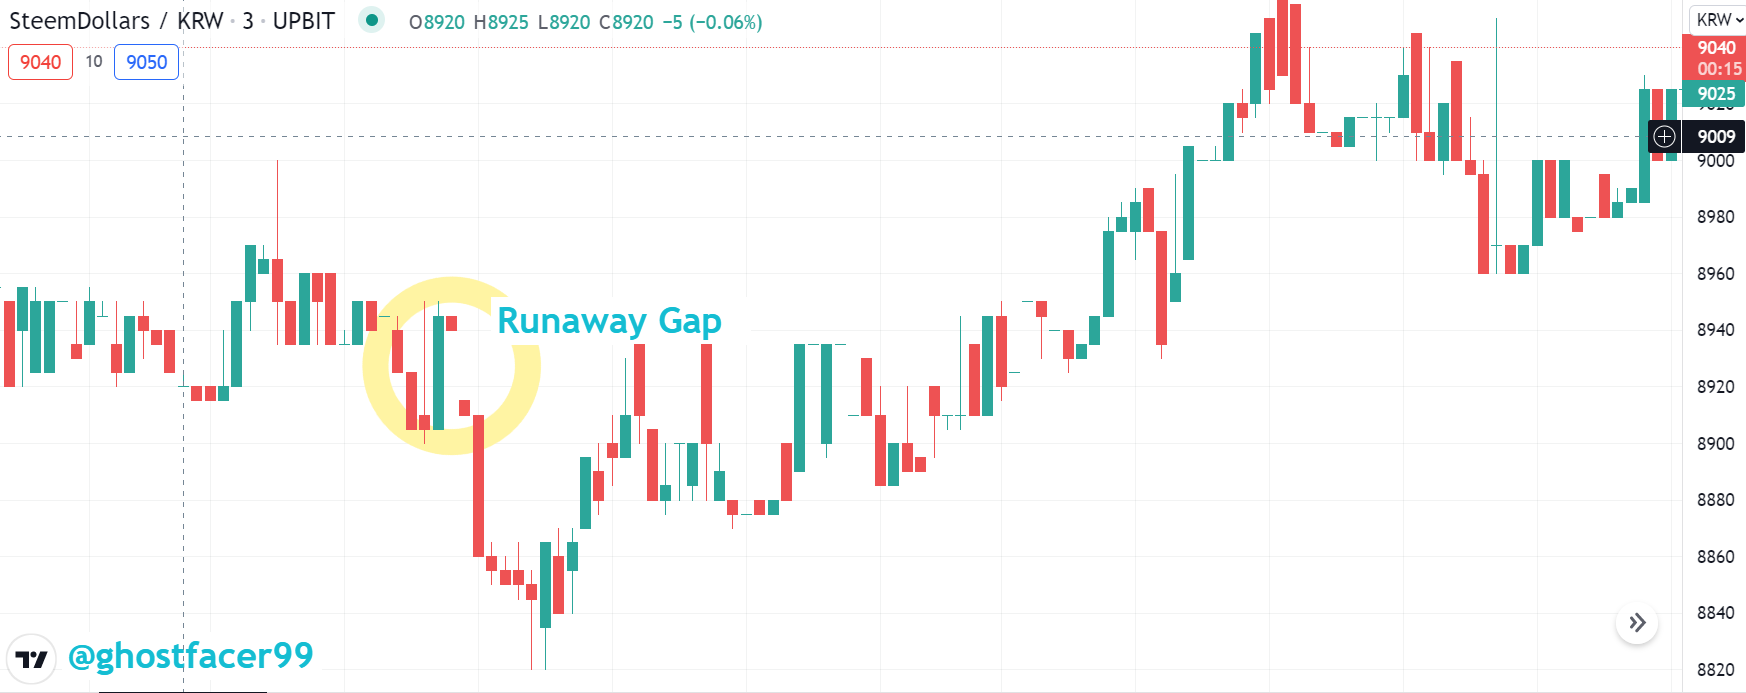 ~Example of Runaway Gap~
A runaway gap is a sort of gap that forms somewhere in the middle of a trend, after which the trend continues. As a result, it suggests trend continuance and is a signal to stay in the trade rather than quit.
Exhaustion Gaps:
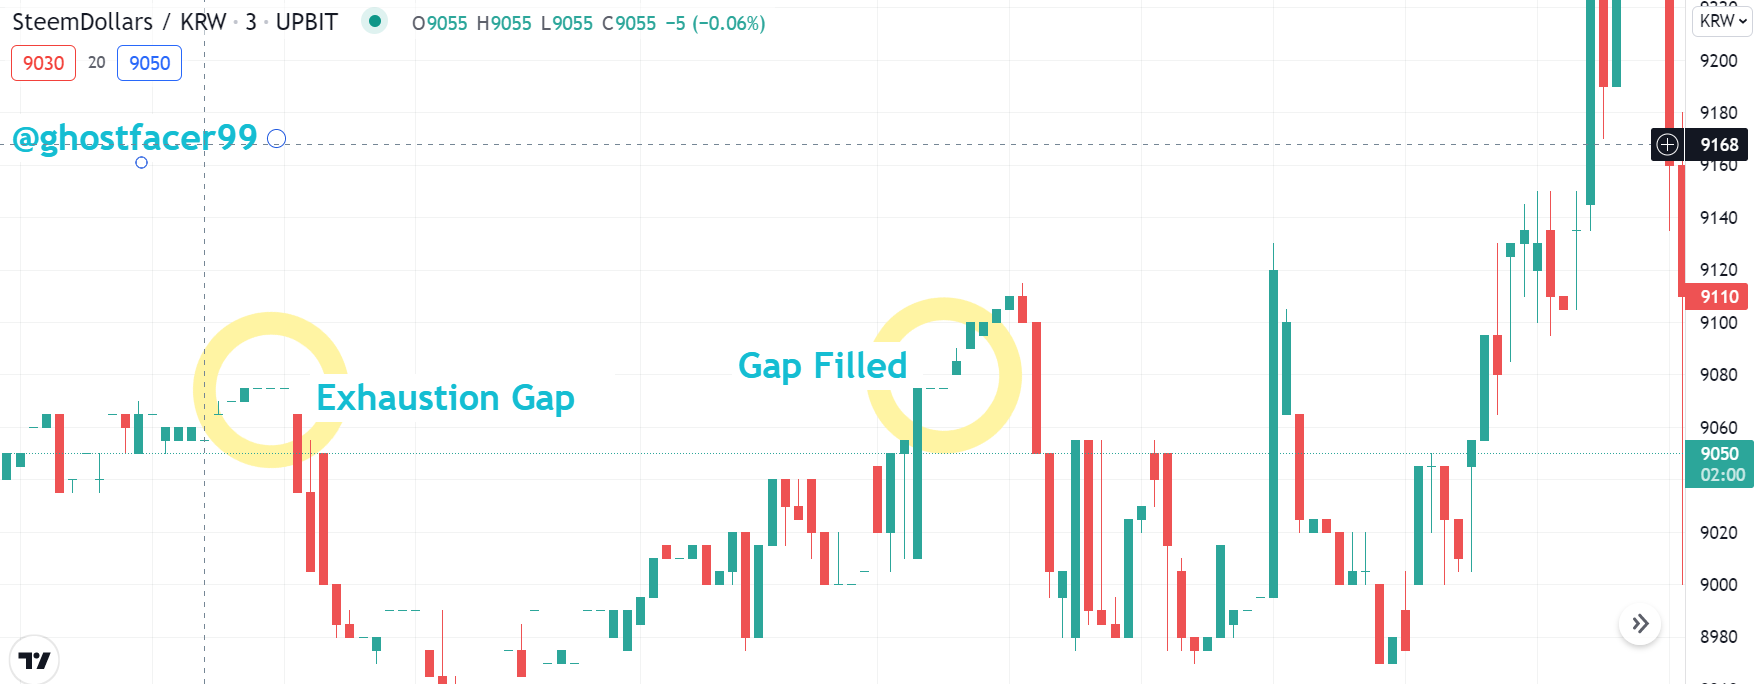 ~Example of Exhaustion Gap~
Exhaustion Gaps are the sort of gaps that close in a relatively short amount of time, indicating the end of the price run and the beginning of either a trend change or a time of rebalancing. Exhaustion gaps are filled in an instant.
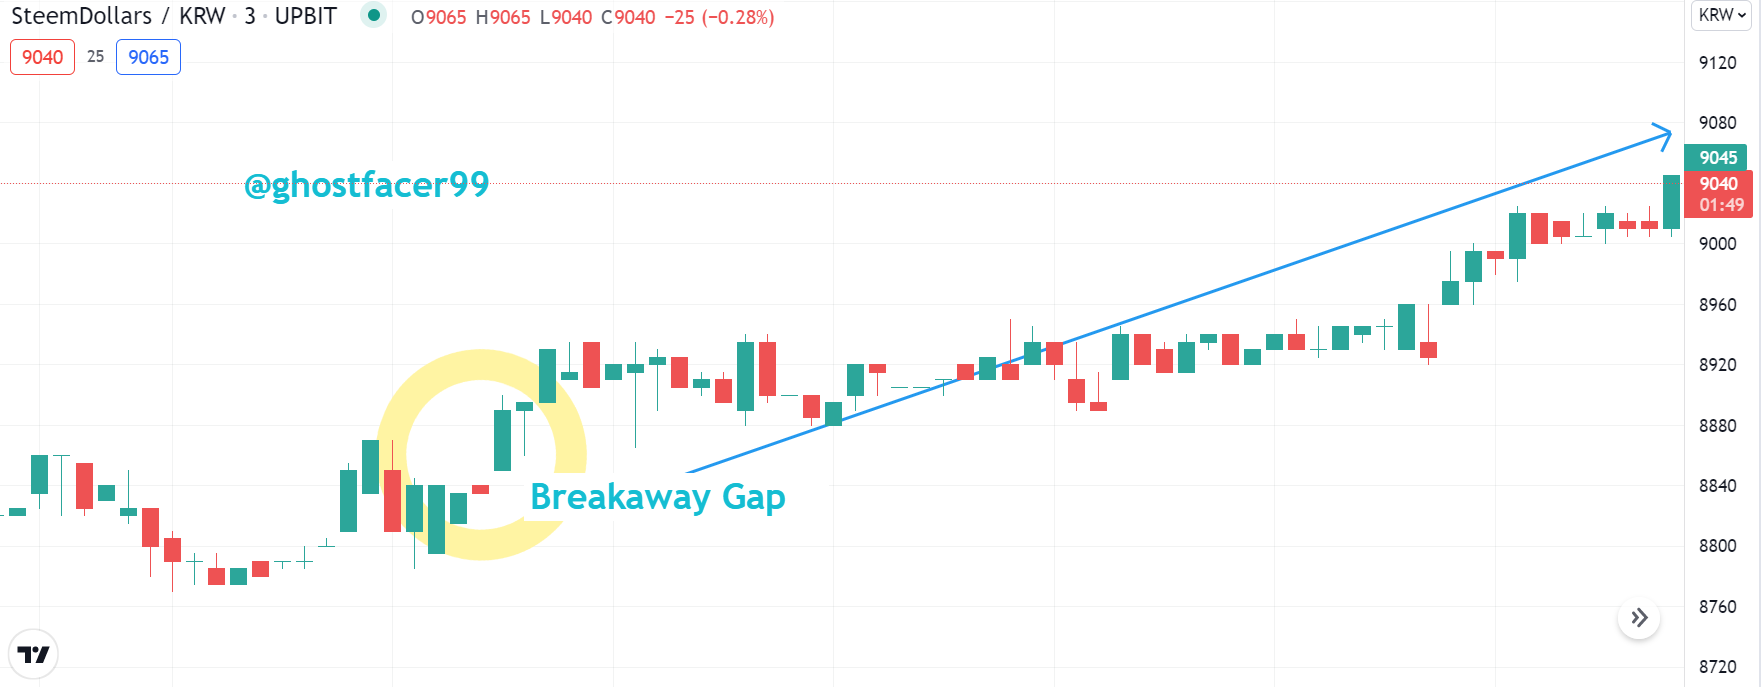
Breakaway Gap:
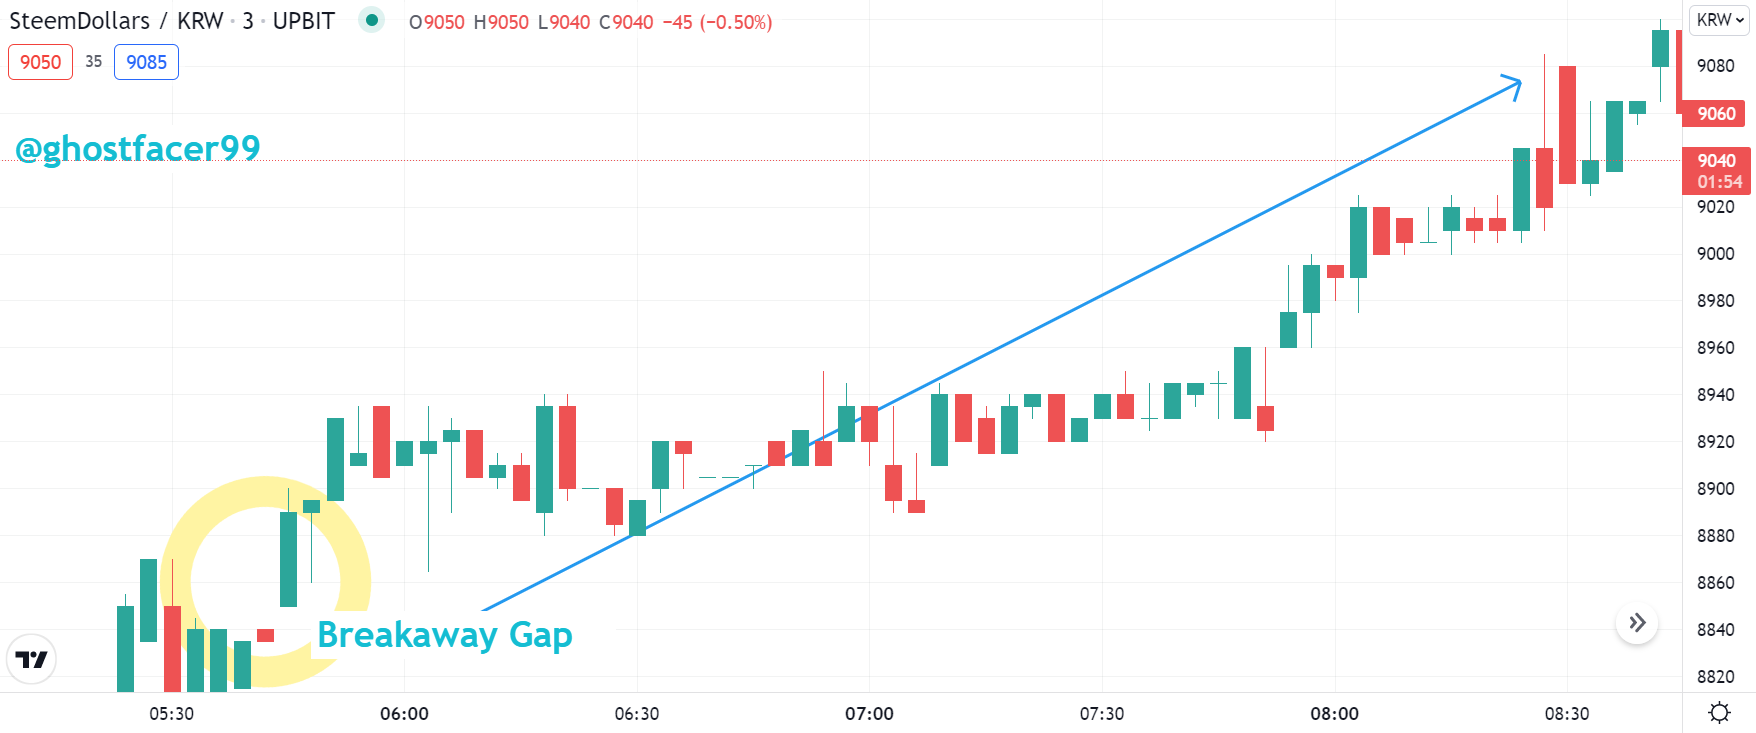 ~Example of Breakaway Gap~
A breakaway gap is a sort of gap that indicates a market structure breakout and a shifting trend in the market. Following the formation of this gap, the market suggests the beginning of a new trend. It also indicates a strong level of support and resistance.
- Through a Demo account, perform the (buy/sell) through Strong Supports and resistances. Explain the procedure (Required Screenshots).
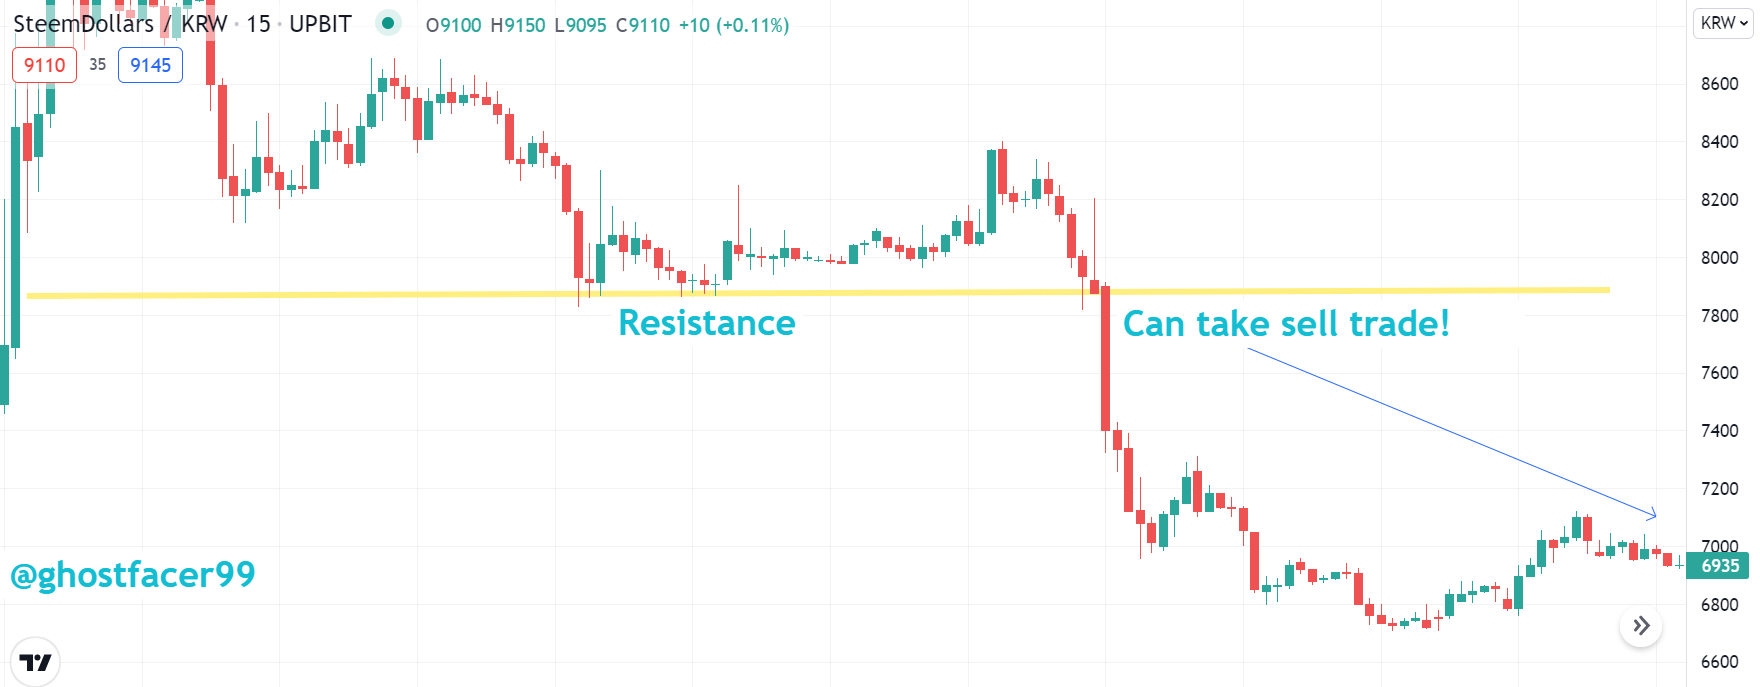
~Example of Buy/Sell At Strong Resistance Level~
As we can see, a smooth trend was running for swing traders, but a significant resistance was also forming. Because the resistance was broken, swing traders should quit their trade and re-enter with a sell trade.
After taking the trade, we may expect a profit of 10-15%, depending on our risk-bearing capacity. It is always preferable to accept whatever we shall receive and go on rather than clinging on to greed and enduring the loss.
In my case, I have seen already a strong resistance is build up and as soon it touches the resistance and starts forming a red candle, I enter with a sell position and exit the trade once I feel I had enough profit considering my investment.
- Through a Demo account, perform the (buy/sell) through Gaps levels. Explain the procedure (Required Screenshots).
 ~Example of Buy/Sell at Gap levels ~
If I had to trade the Gaps, I would always search for the Breakaway Gap since it is a clear indication that the trend is shifting and we may take a safe trade. Once I've identified the Breakaway Gap, I'll wait for the next candle to develop in the trend-changing direction. A buy trade will have an up and green candle, while a sell trade will have a down and red candle. I will trade and monitor after the candle has formed. I will quit the transaction whenever I feel I have made a sufficient profit in relation to my investment. Yes, assuming all goes as planned. If not, I will set a stop loss based on my risk tolerance, which is also determined by my investment and quit the transaction.
In this case, I will take my Steem/KRW buy trade around 8890 and my stop loss would be 8850. As I mentioned earlier, then I will monitor the trade and whenever I feel I have made a sufficient profit in relation to my investment.
Note: All the screen captures are taken through my TradingView account.
Conclusion:
We all know there are several methods and indicators available in the market to use while trading in cryptocurrency. Which helps us traders in forecasting prices and executing buy or sell orders. The support and resistance indicator is the most used one. Analysis of strong and weak support and resistance levels in the cryptocurrency market can also be helpful to know precise information about price movements and shifting patterns. Thank you for your valuable lecture professor.
#allbert-s4week1
#cryptoacademy
#india
#nepal
cc: @allbert
20 % Beneficiaries rewards set for @steemingdiaries!
Thank you!
@ghostfacer99
Thank you!