[Crypto Trading With Alligator Indicator]- Crypto Academy /S5W3-Homework Post for kouba01
Price on the cartesian market chart is either in two forms:
• Trending form
• Ranging form
This which should be the first course to take in understanding the market is the foundation of our course of discussion today, read on.
Good day beautiful Steemians, I am @hadassah26, welcome to my first Advanced course in over two seasons, I am happy to be here again. Today I will be treating the topic: Crypto Trading With Alligator Indicator by professor @kouba01.

"1. Discuss your understanding of the use of the Alligator indicator and show how it is calculated?"
The Alligator Indicator developed by financial analyst and researcher Bill Williams was made from his observation of the behavior of the alligator. The alligator sleeps till it gets hungry, and then it sneaks up on prey, suddenly pouncing on it and devouring it.
This attribute which Bill Williams related to the market tells that the market like an alligator consolidates for a while seeming idle, then suddenly picks up and making some good pips before going back to consolidation. Hereby traders can cash in and make profits if they can quickly tell these "Market pickup" times.
Bill Williams developed the Alligator price indicator such that it can quickly signal traders of these market pickup times.
Making use of Fibonacci numbers and twerked Moving averages, the Alligator indicator can be used properly with a momentum indicator giving a good probability of positive trade entries.
The Alligator indicator has been used by traders since 1995 till date, and can be used for varying financial markets from stocks, currency markets, commodities and now cryptocurrencies.
The working principle and mathematics behind the Alligator pattern is simple. It uses three moving averages which signify the three components of the alligator "predator weapon", they are:
- 13 periods Moving Average, twerked with the 8 periods Moving Average: color "Blue" signifying the alligator Jaw.
- 8 periods Moving Average, twerked with the 5 periods Moving Average: color "Red" signifying the alligator teeth
- 5 periods Moving Average twerked with the 3 periods Moving Average: color "Green" signifying the alligator lips
Calculating the Twerked Moving Averages of the Alligator pattern,
The twerked alligator indicator is the Median of the Higher Simple Moving Average (SMA), smoothened with the lower Simple Moving Average (SMA) via the median, where median=
Therefore, Alligator value for each moving average =
Alligator Teeth = SMA(Median, 8,5)
Alligator Lips = SMA(Median, 5,3)
"2. Show how to add the indicator to the chart, How to configure the Alligator indicator and is it advisable to change its default settings ?. (Screenshot required)"
To add the Alligator indicator to the chart, we open our trading view, selecting any cryptocurrency pair of our choice,:
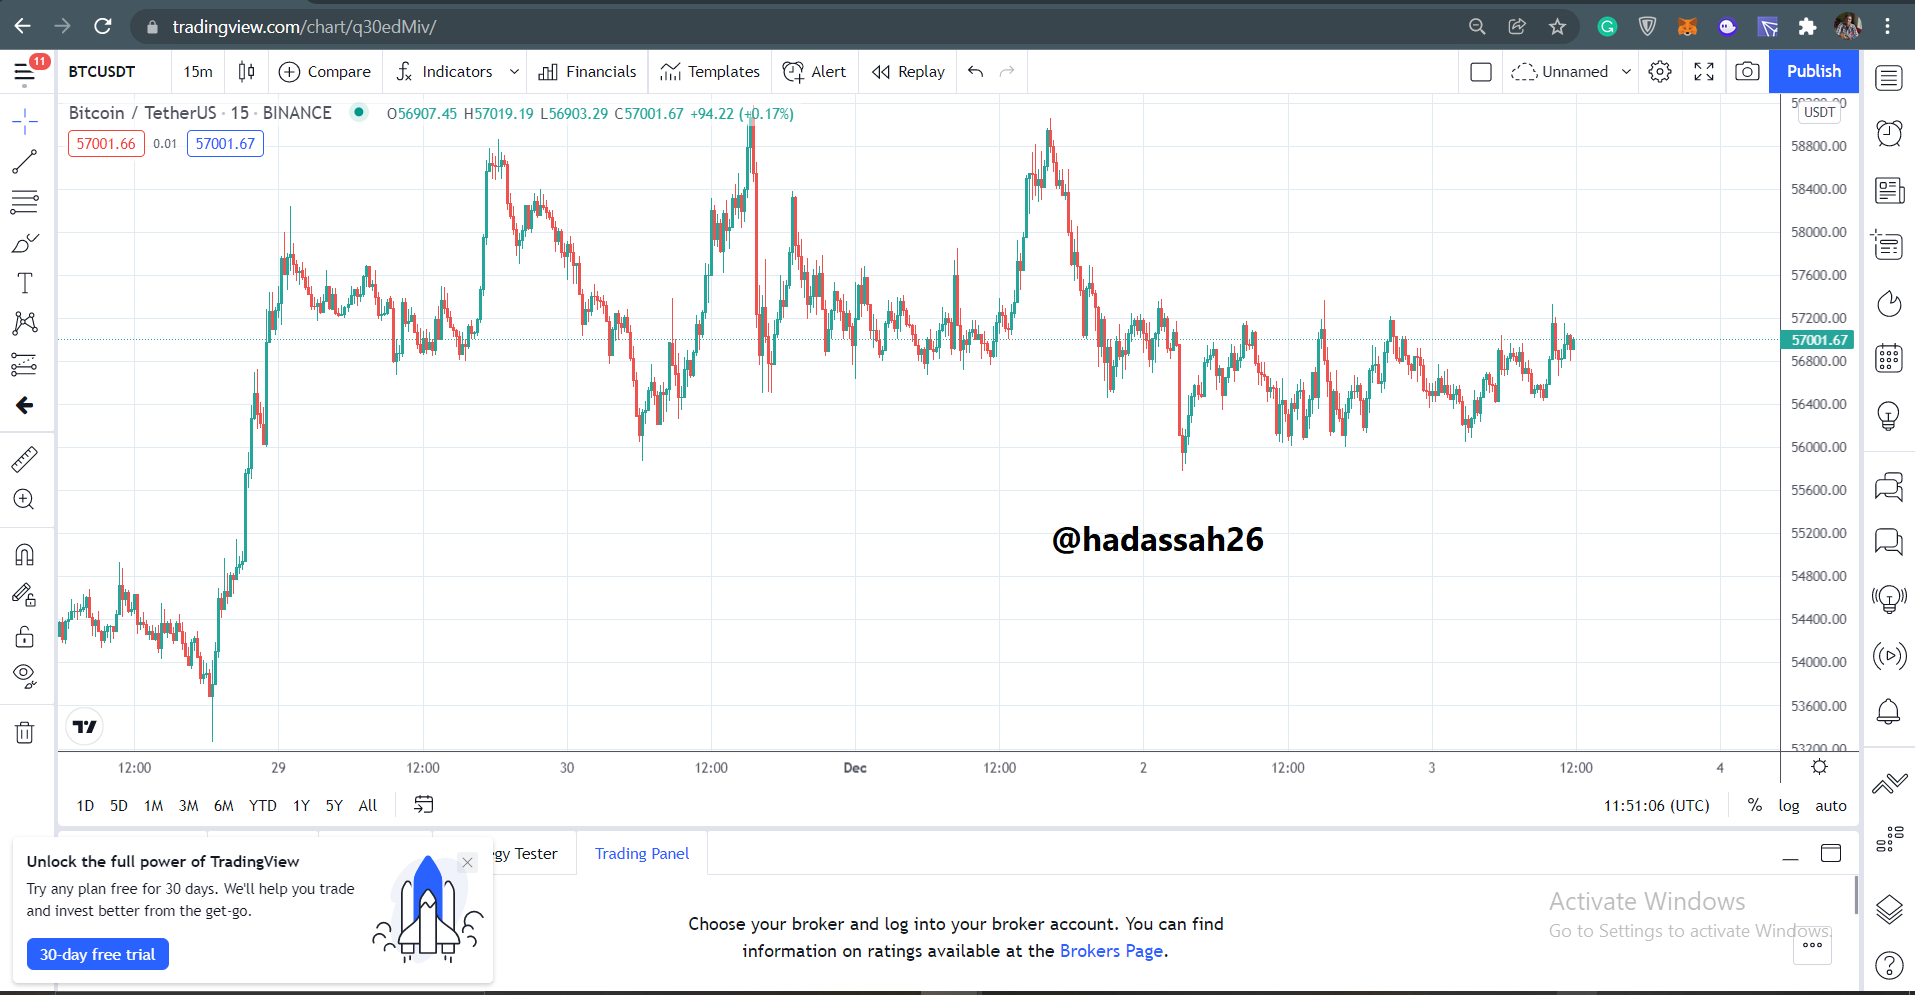.png)
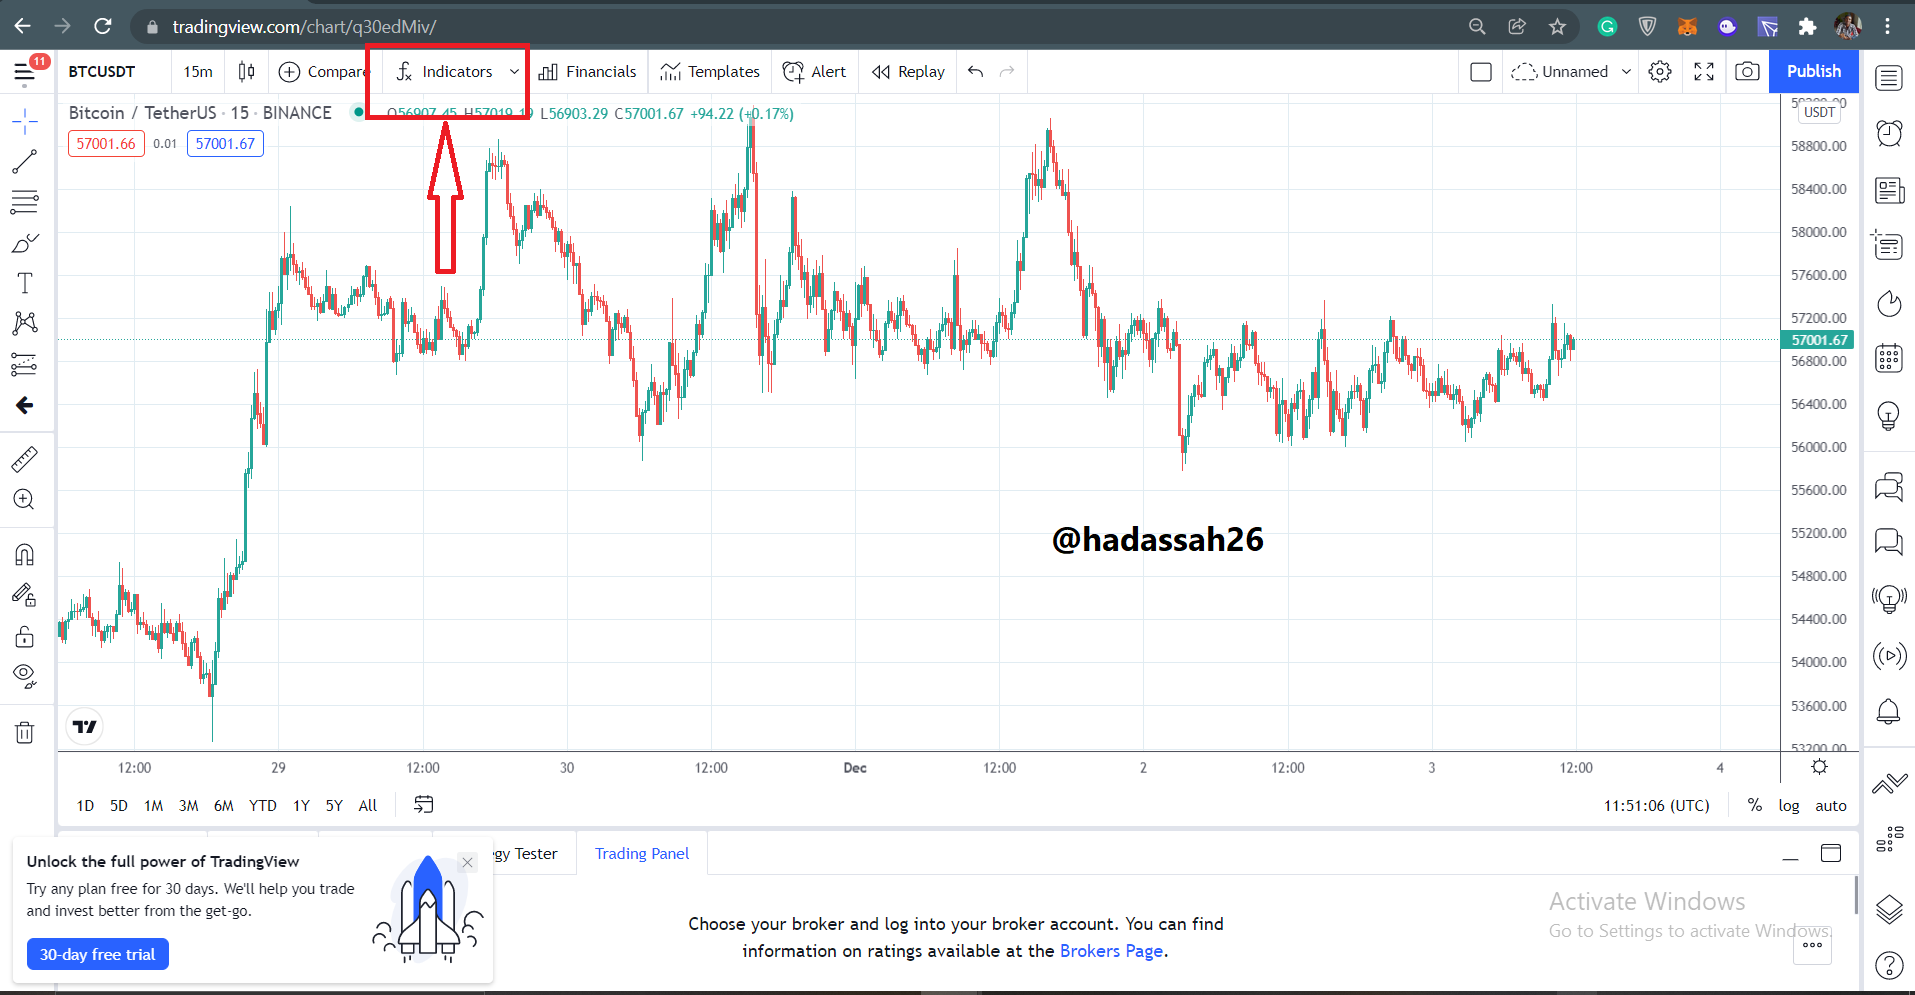
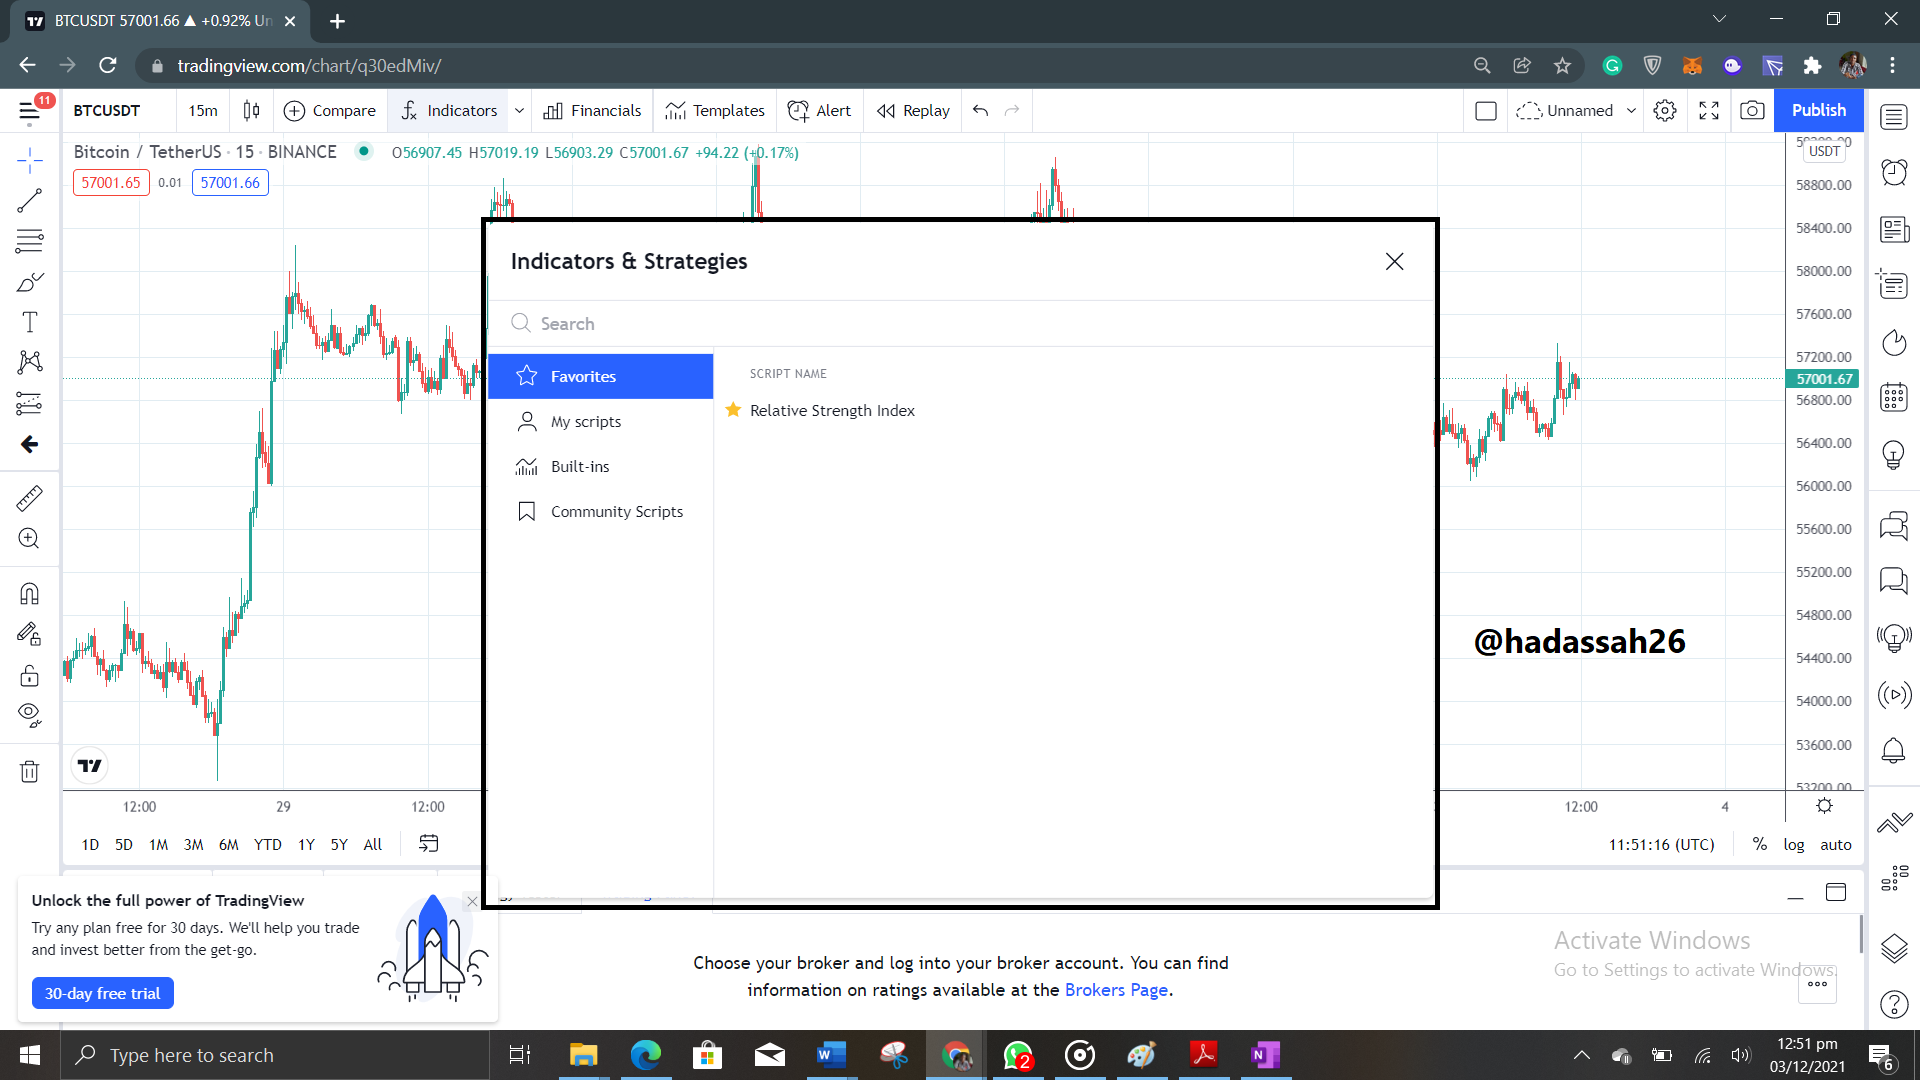
We now click on the "fx" icon symbolizing indicators , a pop up turns up where we now type in "Alligator".
.png)
.png)
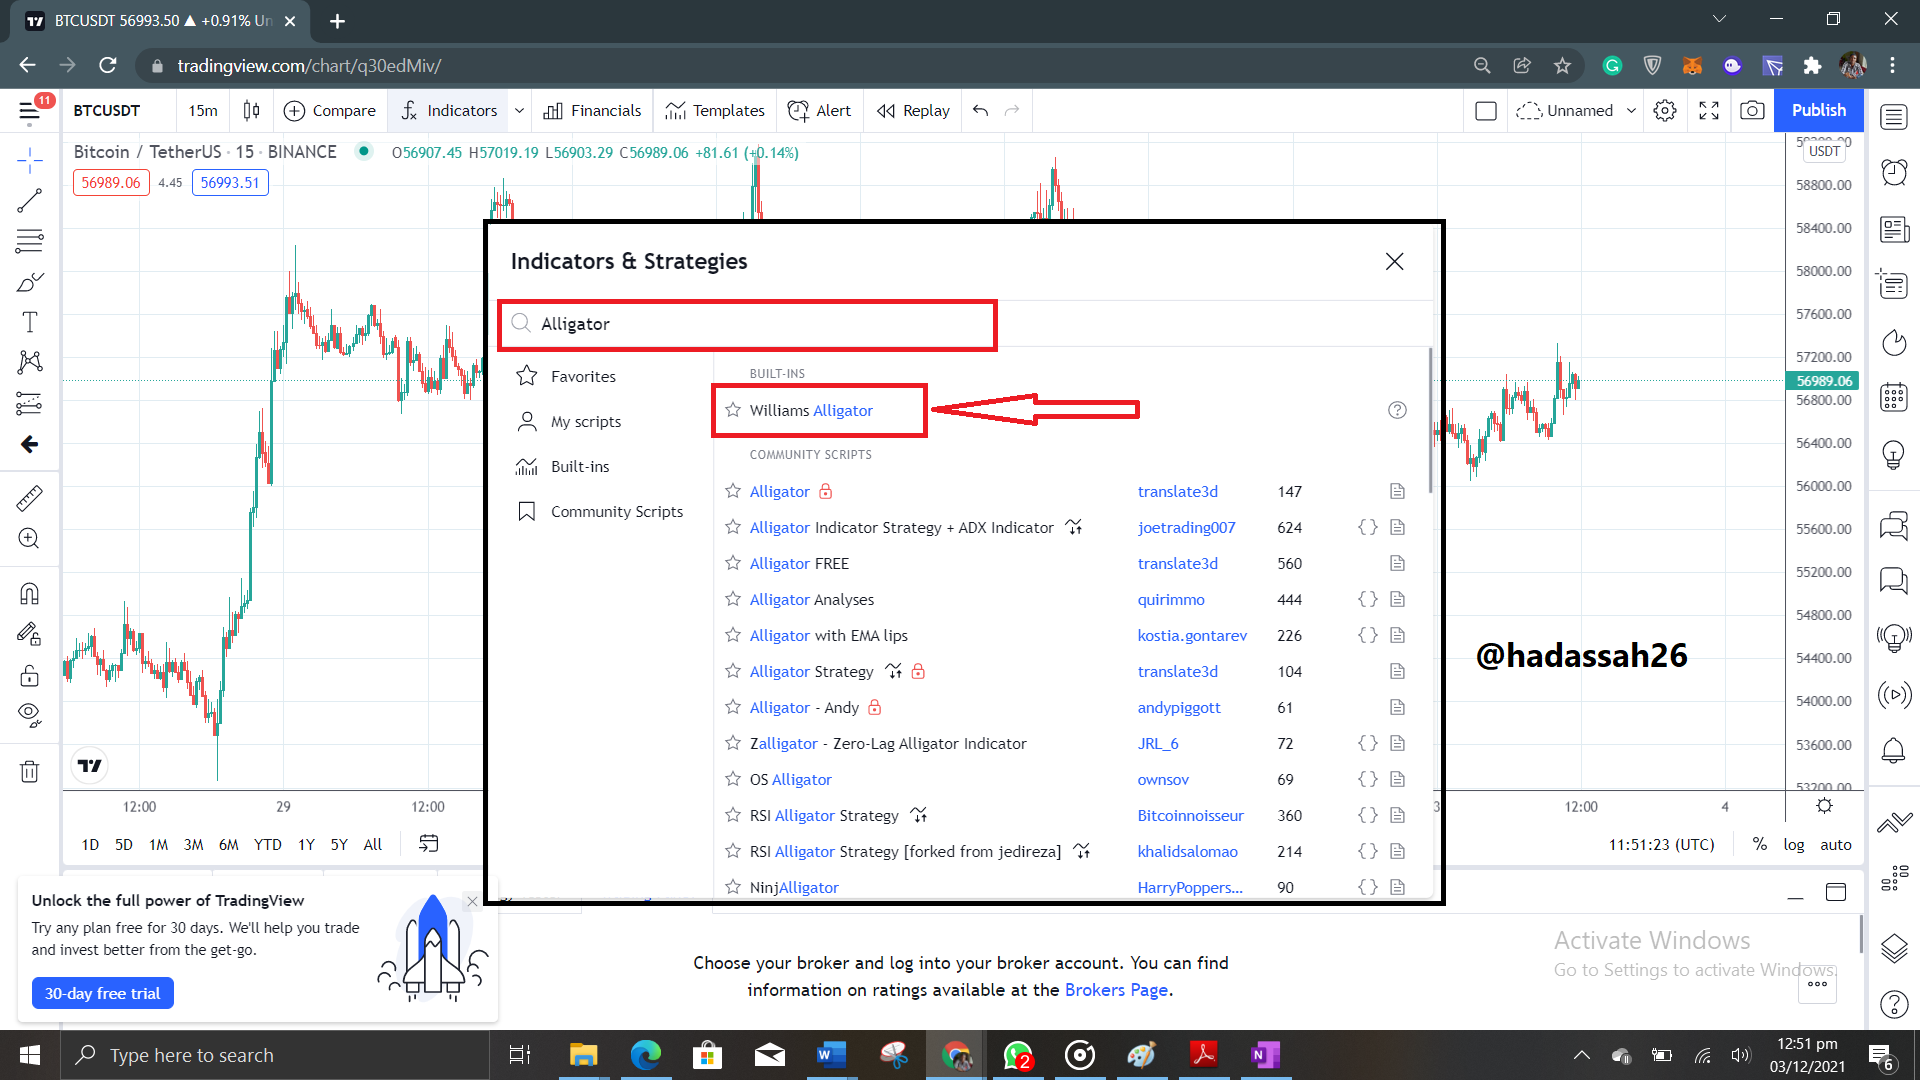.png)
We can now see the Alligator indicator used on the chart below:
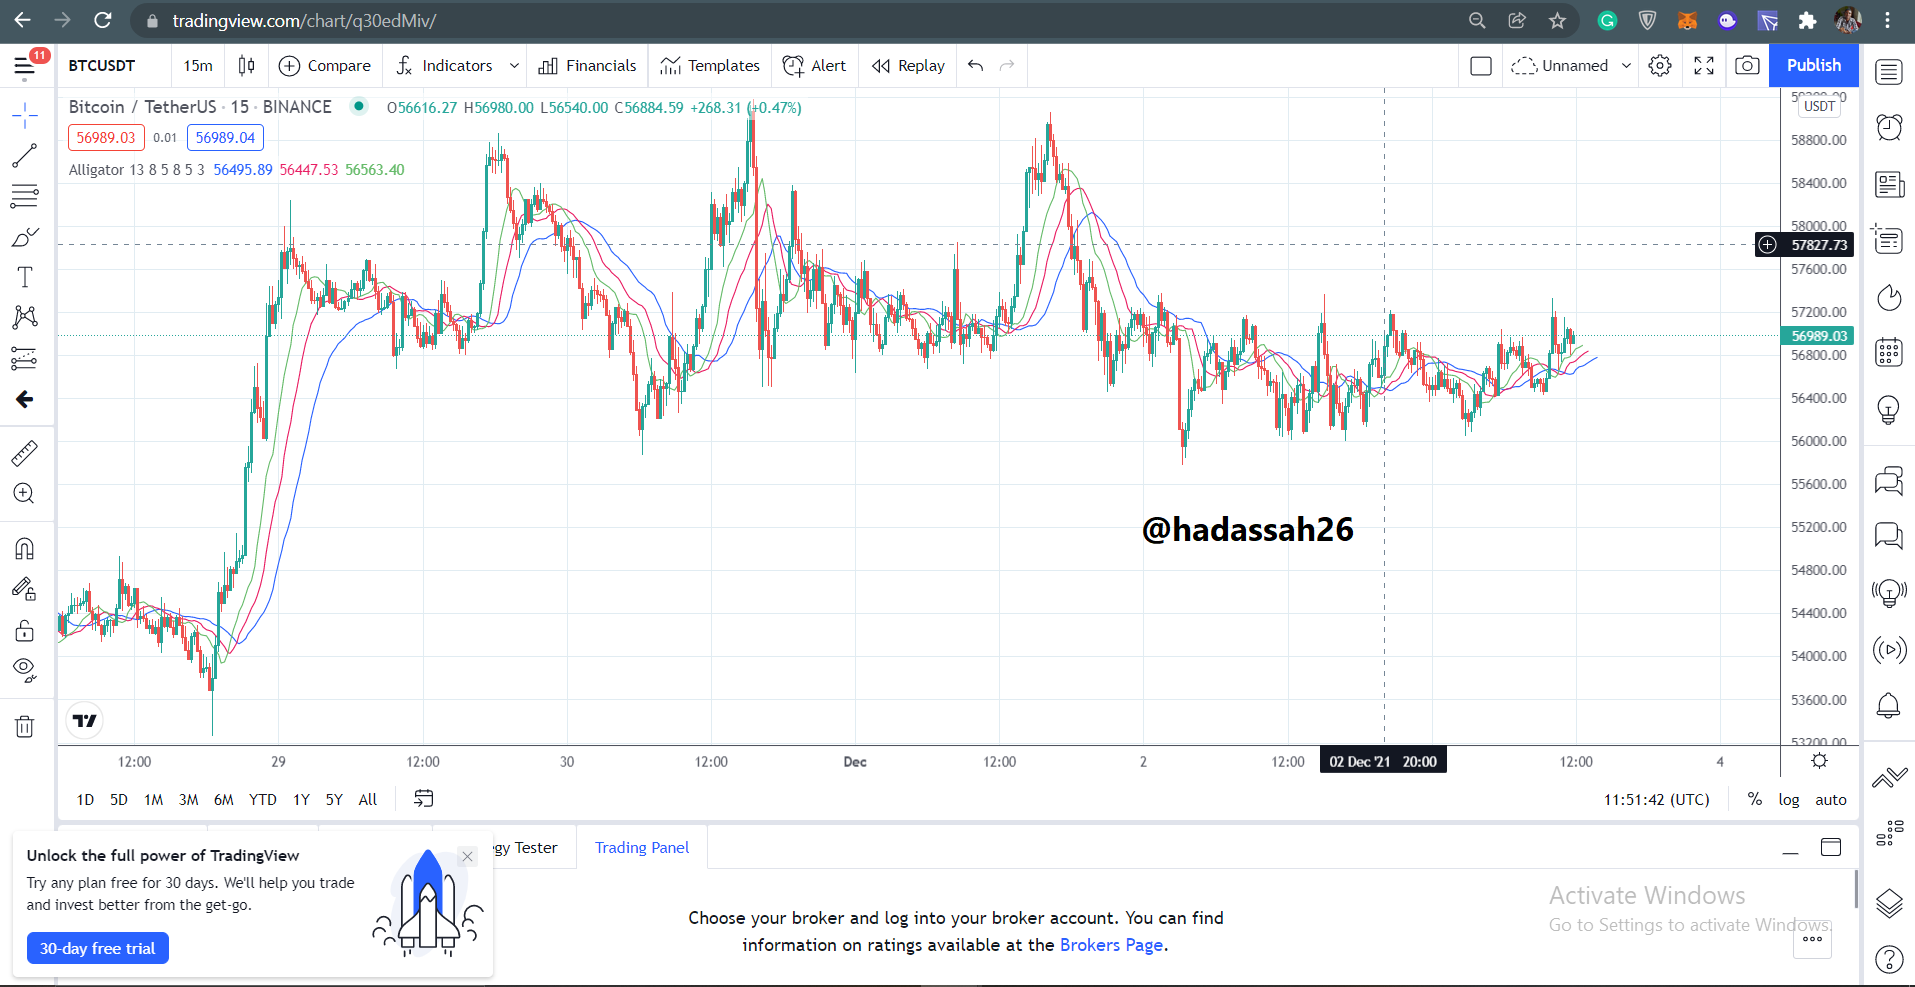.png)
How to configure the Alligator indicator and is it advisable to change its default settings
To configure the Alligator indicator, we can either double click on the indicator on the chart, or click on the settings icon on the indicator as shown below:
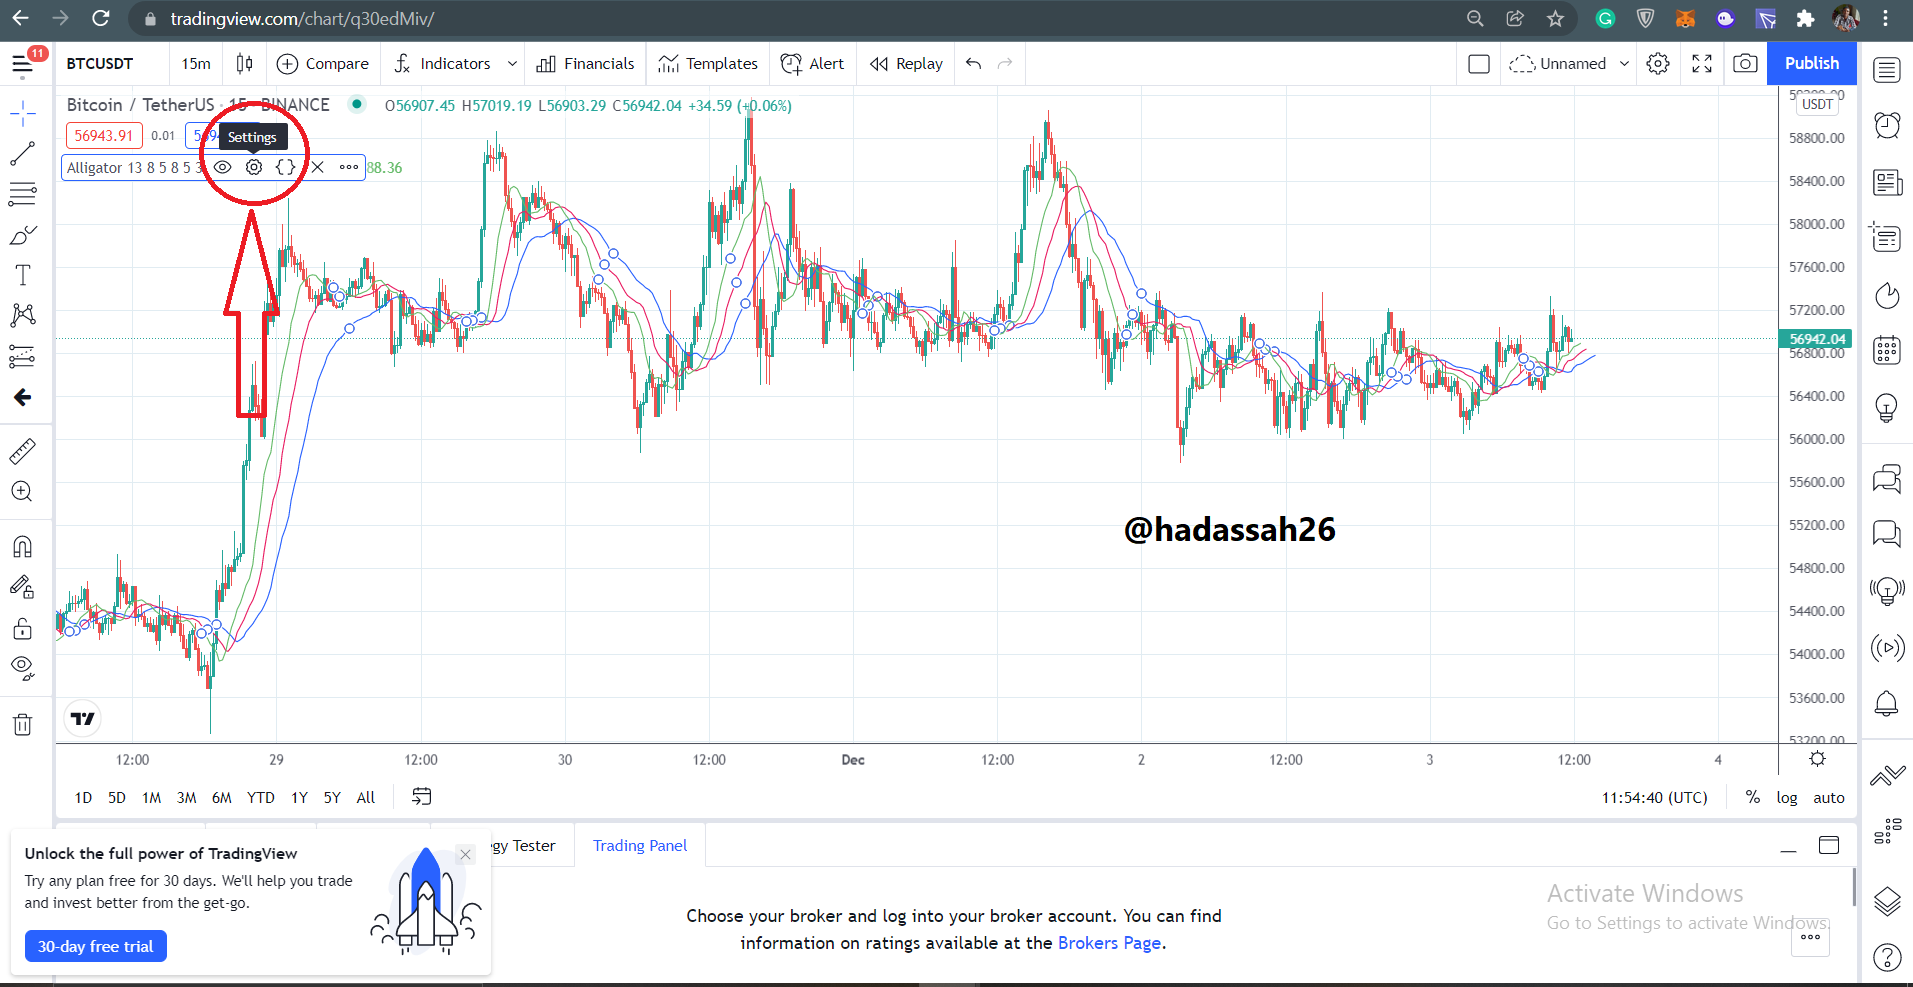.png)
Now we can see the default configurations, we can now change it to suit our trading style.
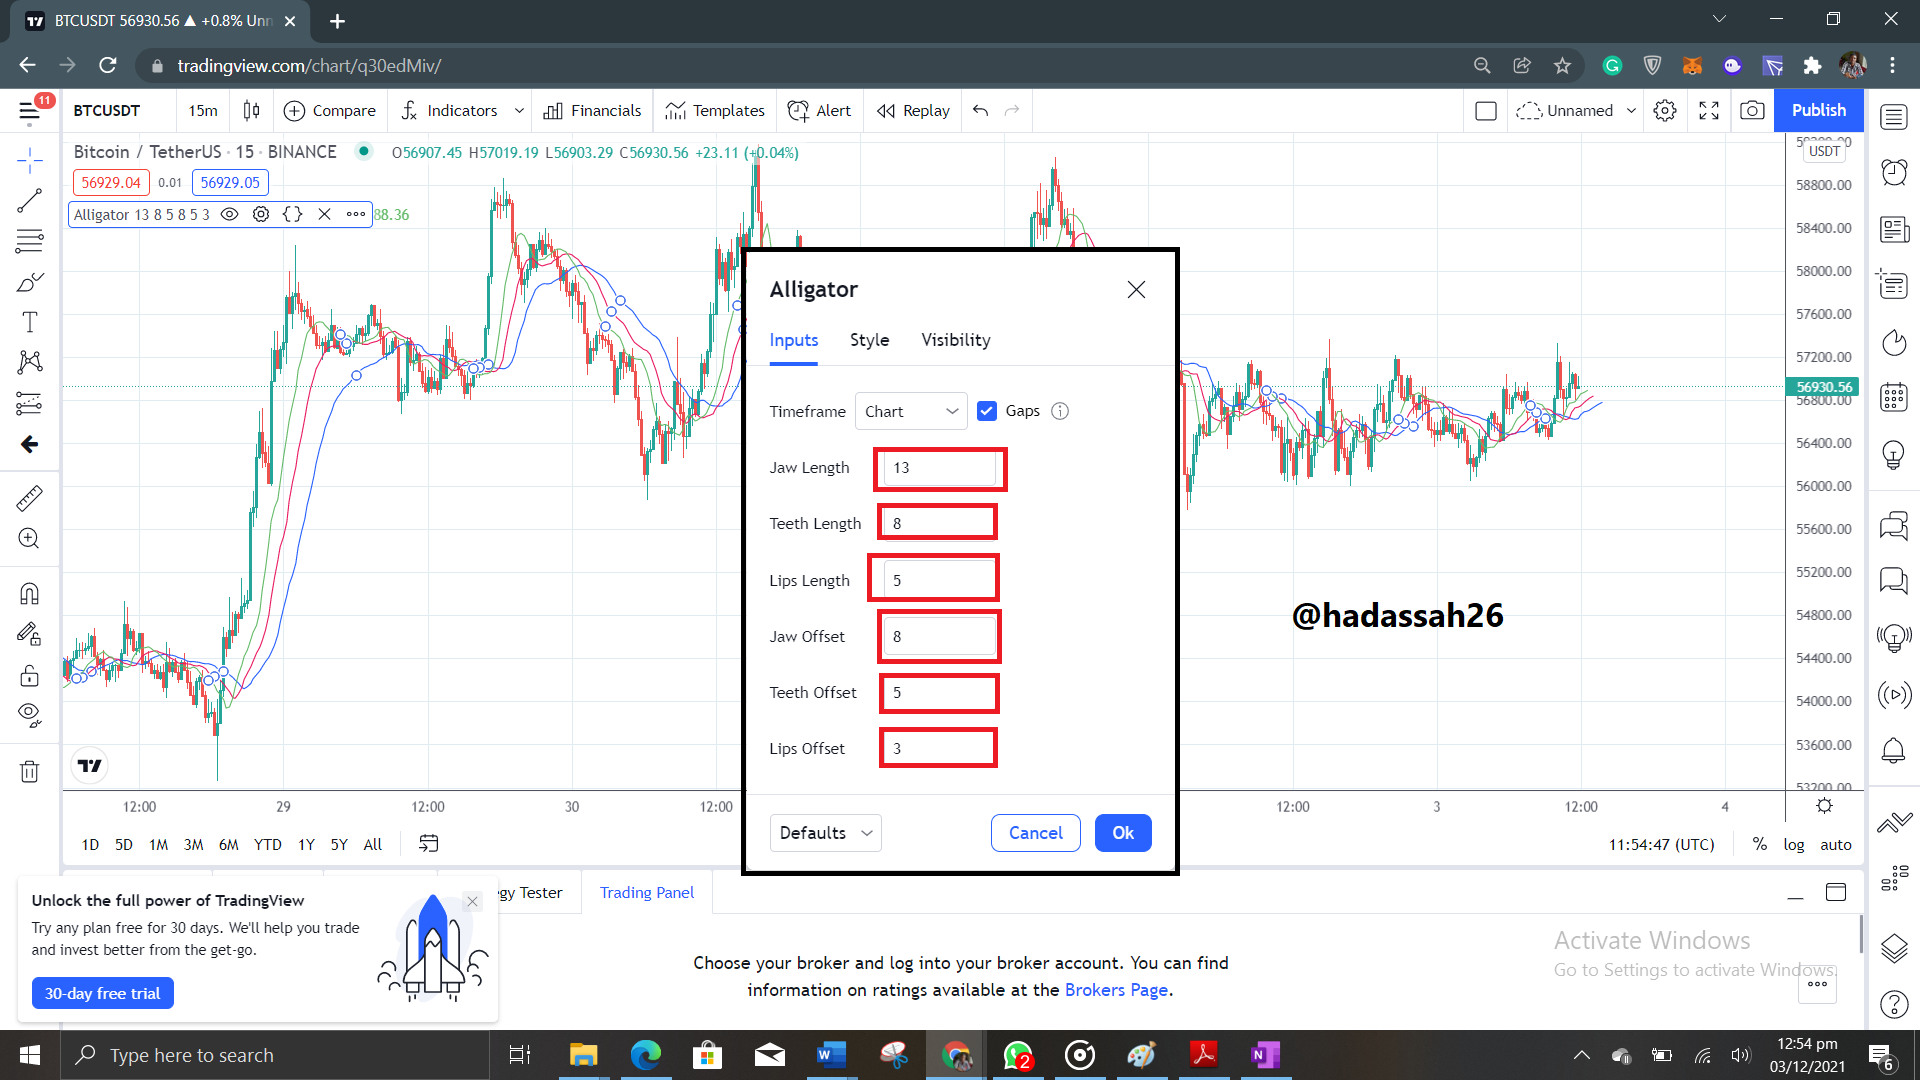.png)
"3. How do we interpret this indicator from its 3 phases: the period of rest(or sleep), awakening, and the meal phase?(Screenshot required)"
Understanding the Alligator indicator as designed by Bill Williams is simple, he took into considerations the movements of the alligator mouth from when it is asleep to when it jumps preying on it meal. These phases of the alligator hunting behaviour are categorized into 3 stages of the market movement.
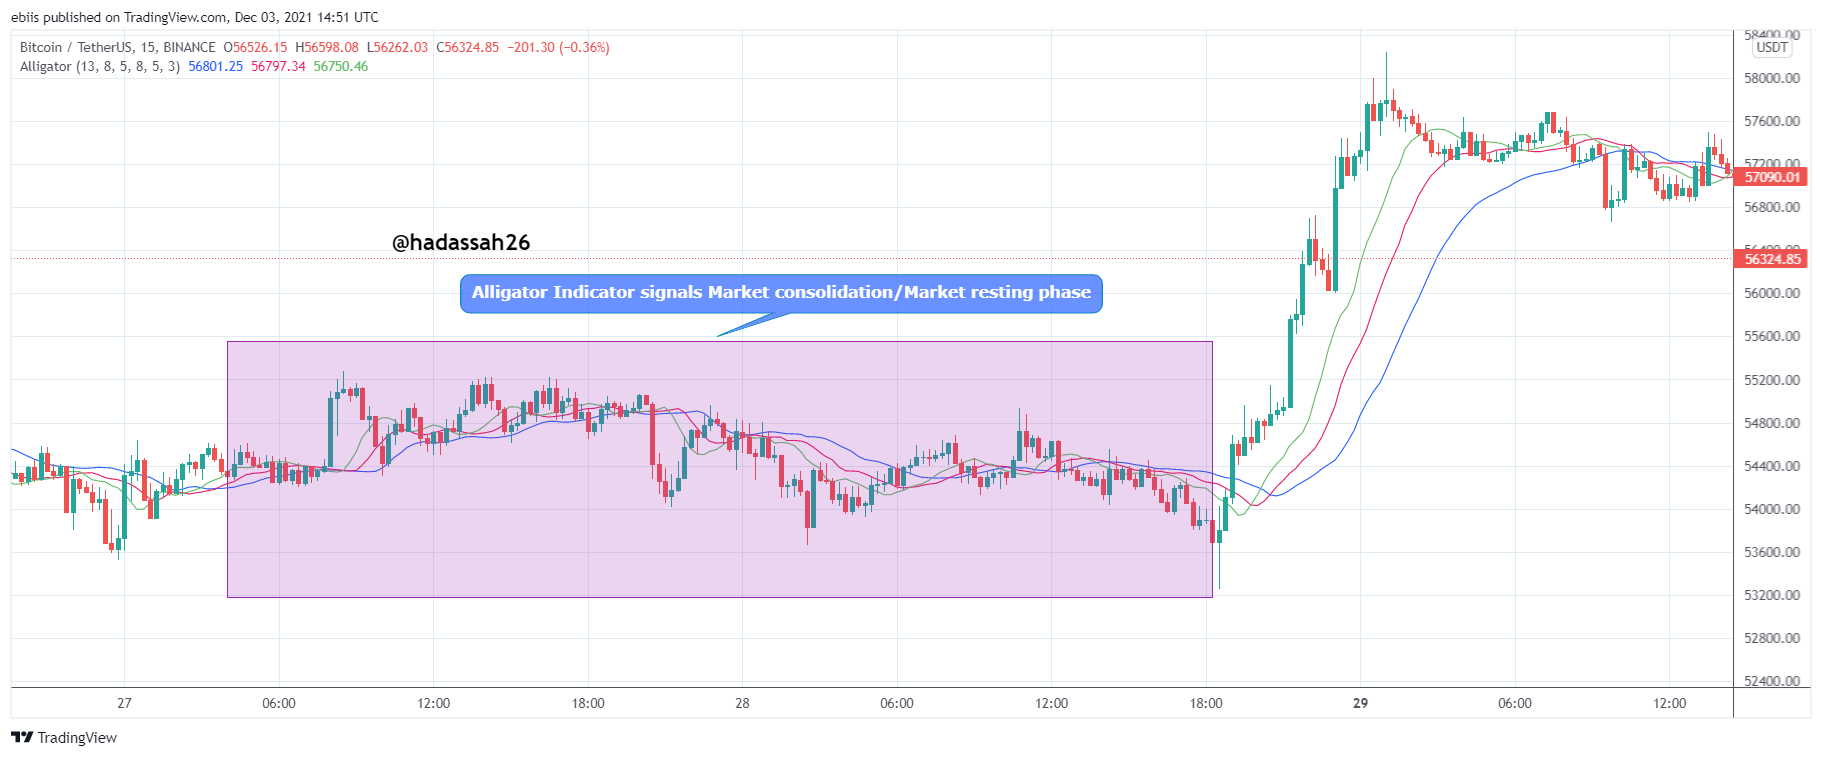
Resting Phase
While asleep, the mouth of the alligator is closed and so replicating it to the market, the symbolized moving averages are also intertwined. It is not advisable to get into the market at this time as "the alligator" may pounce on you ripping you off your capital. An example of this phase can be seen in the screenshot below.

During the resting phase, the alligator gets hungry, so traders await its awakening so it can hunt for food. This wis when they get ready to enter the market, but like explained above entering the market during the Resting phase can be dangerous as the "market" may move in any direction hunting you as the prey taking your profits.
Awakening Phase
Next on the Phase the alligator wakes up (named the Awakening Phase). Here the alligator has become hungry and is ready to hunt for food. It soon opens it's mouth, causing the moving averages to start deviating from each other,

The Jaw, teeth and lips spread out aggressively as it hunts down its prey. Here we can characterize with the market, symbolizing them with the moving averages.
During the awakening phase, the moving averages spread out, deviating from each other. Traders can now get into the market hunting down "pips" with the Alligator indicator.
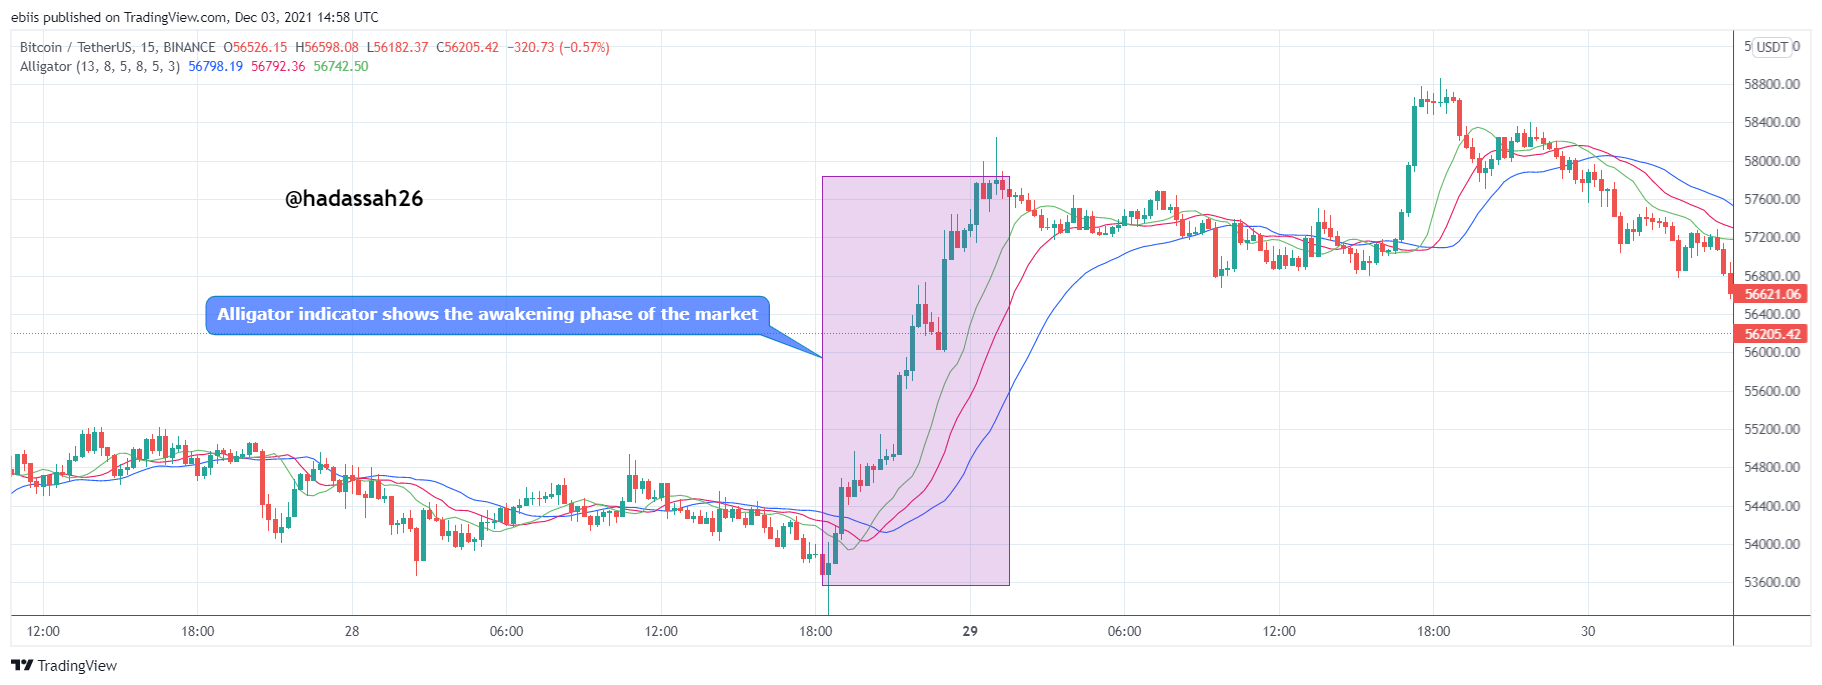
Here we can see how the moving averages spread out, traders can enter the market at "A" hoping to catch some pips before the trend gets to "B".
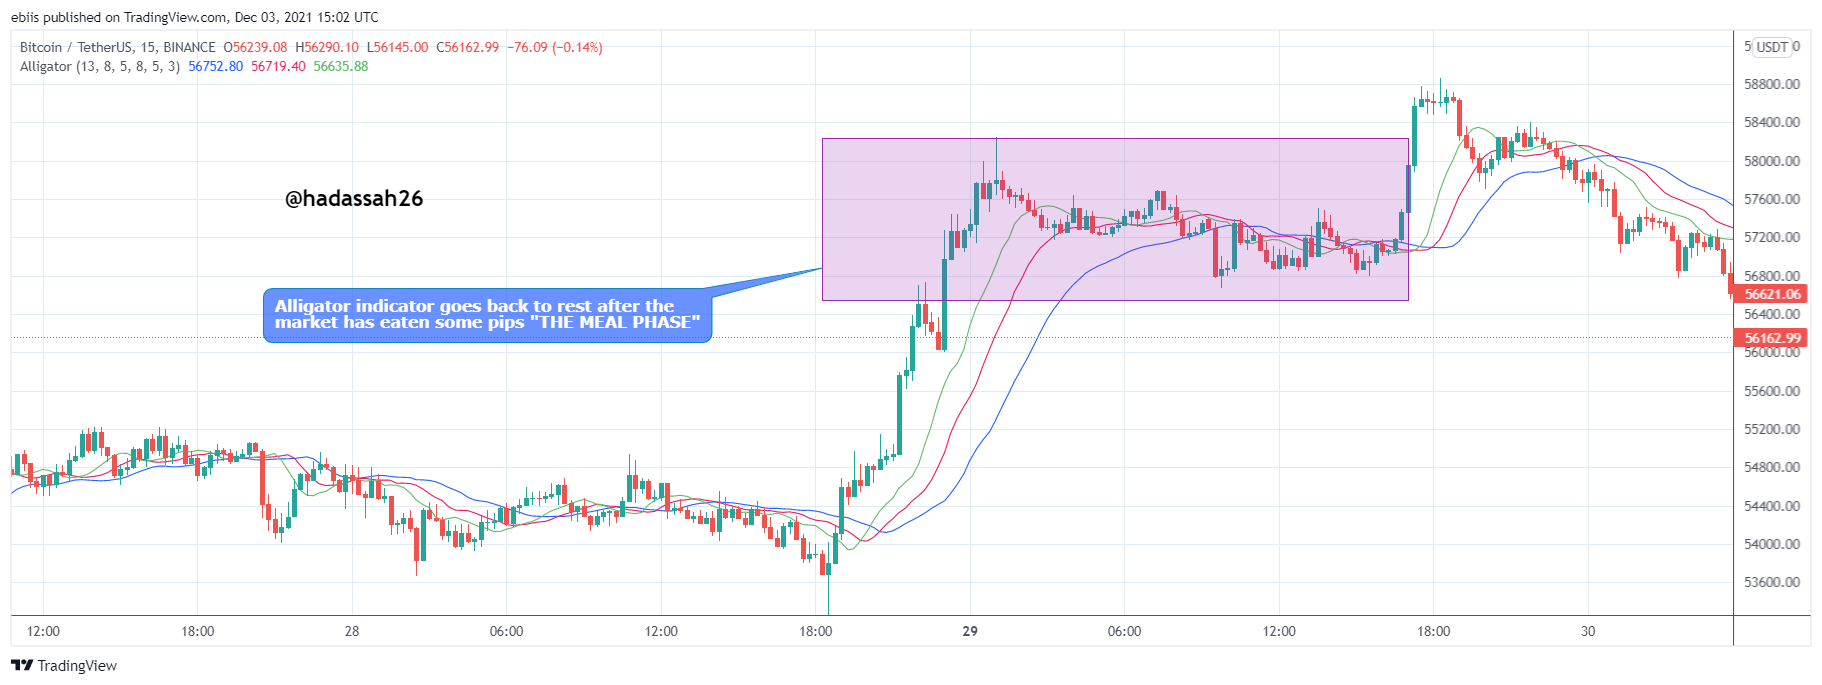
Meal Phase
Here the alligator has eaten up its prey and is back at rest. It is satisfied for the moment and may rest a while before another hunt. Characterizing it to the market, after a trend, then market usually sees some consolidation, here traders are contemplating where next the market will go, but for now the market itself is "ranging" withing a square area before another run.

"4. Based on the layout of its three moving averages that make up the Alligator indicator, how can one predict whether the trend will be bullish or bearish (Screenshot required)"
As explained above, the Moving averages of the Alligator indicator spread out during a trend, and shrink back when the trend is about to consolidate.
The trends of this indicator can be read easily when there it is either bullish or bearish trend based on the position of the Moving averages relative to each other.
Bullish Trend
During a bullish trend, the Blue Moving Average of the Alligator indicator becomes lowest of the three Moving averages and the Green Moving average goes ontop as they all spread out.
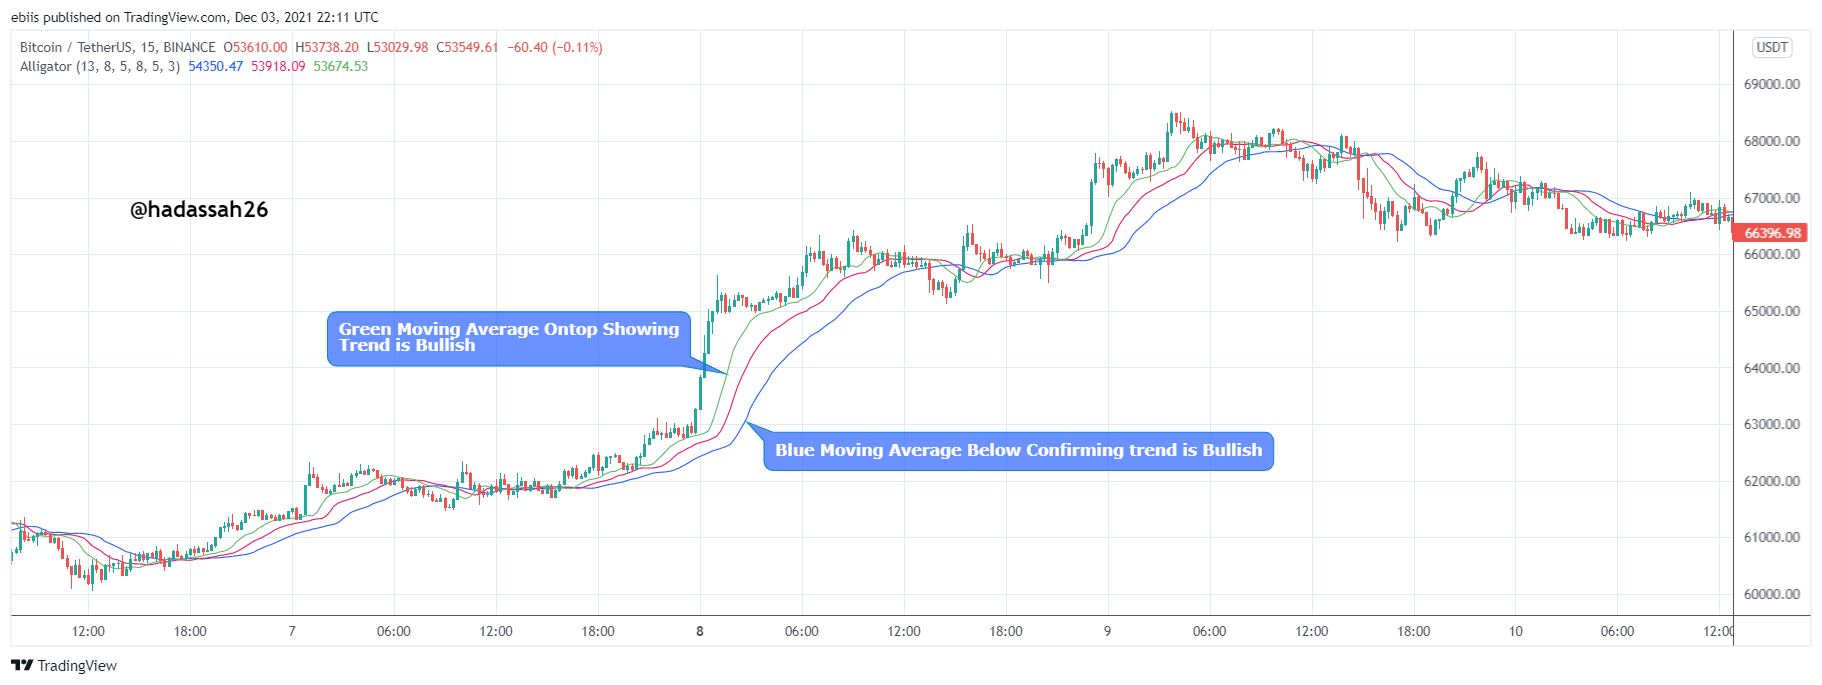
The Blue Moving average is seen to go below the others and the Green ontop as they spread out with a general positive gradient from their inter-twined positions from the Rest phase. Traders can now make bullish entries targeting to make profits before the exhaustion of the trend.
Bearish Trend
During a bearish trend, the Blue Moving average goes ontop and the Green Moving average below the Moving averages of the Alligator indicator as they all spread out.
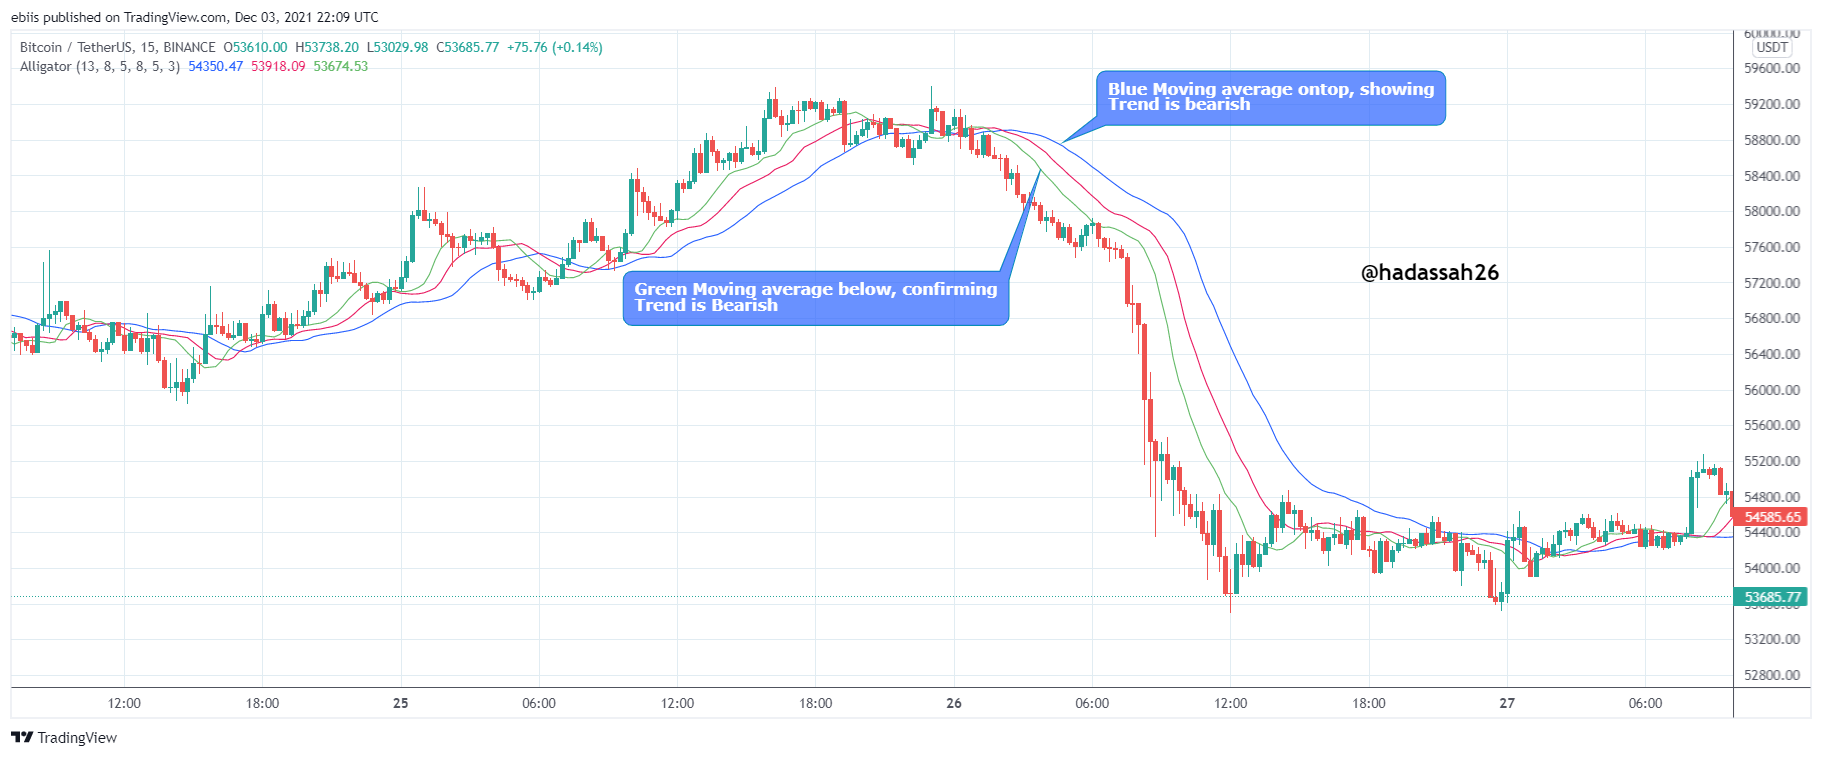
The Blue Moving average can be seen to go ontop the Moving averages and the Green Moving average below the other Moving averages as the trend continues to spread having a negative gradient. Traders can now make bearish entries targeting to make profits before the exhaustion of the trend.
"5. Explain how the Alligator indicator is also used to understand sell / buy signals, by analyzing its different movements.(screenshot required)"
Buy and Sell signal using the Alligator indicator can be understood via the positions of its moving averages and their general direction as they spread out from their resting positon.
For Buy signals, the Alligator indicator has its Moving averages arranged with the Green Moving average above all the others, the Red Moving average in between, and the Blue Moving average last underneath.
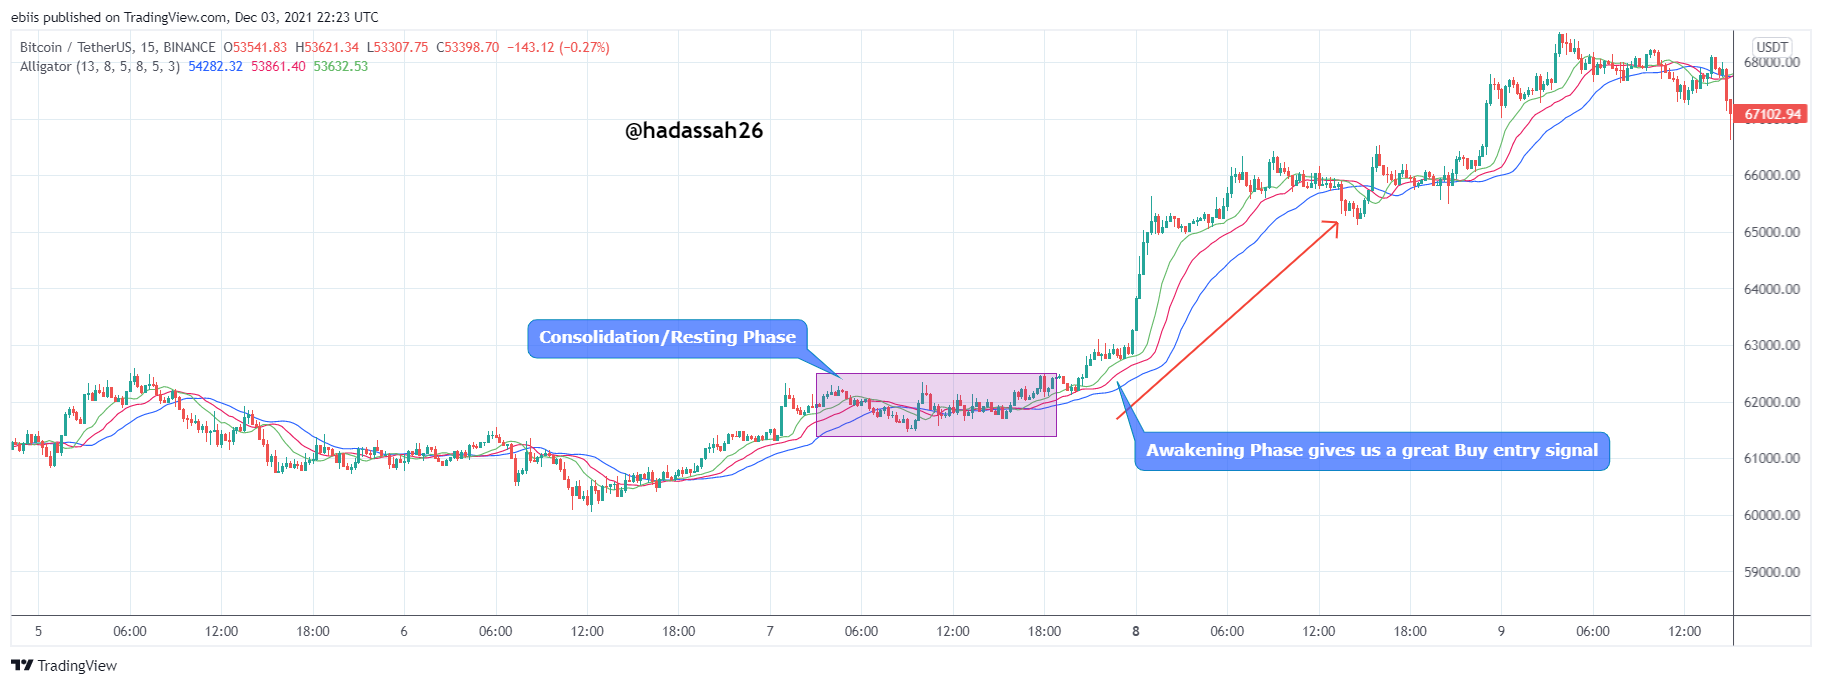
We can also confirm they have a general Positive gradient and are all spreading out from their resting position as shown on the marked zone in the screen shot below.
For Sell signals, the Alligator indicator has its Moving average arranged with the Blue Moving average above all the others, the Red Moving average in between, and the Green Moving average last underneath.
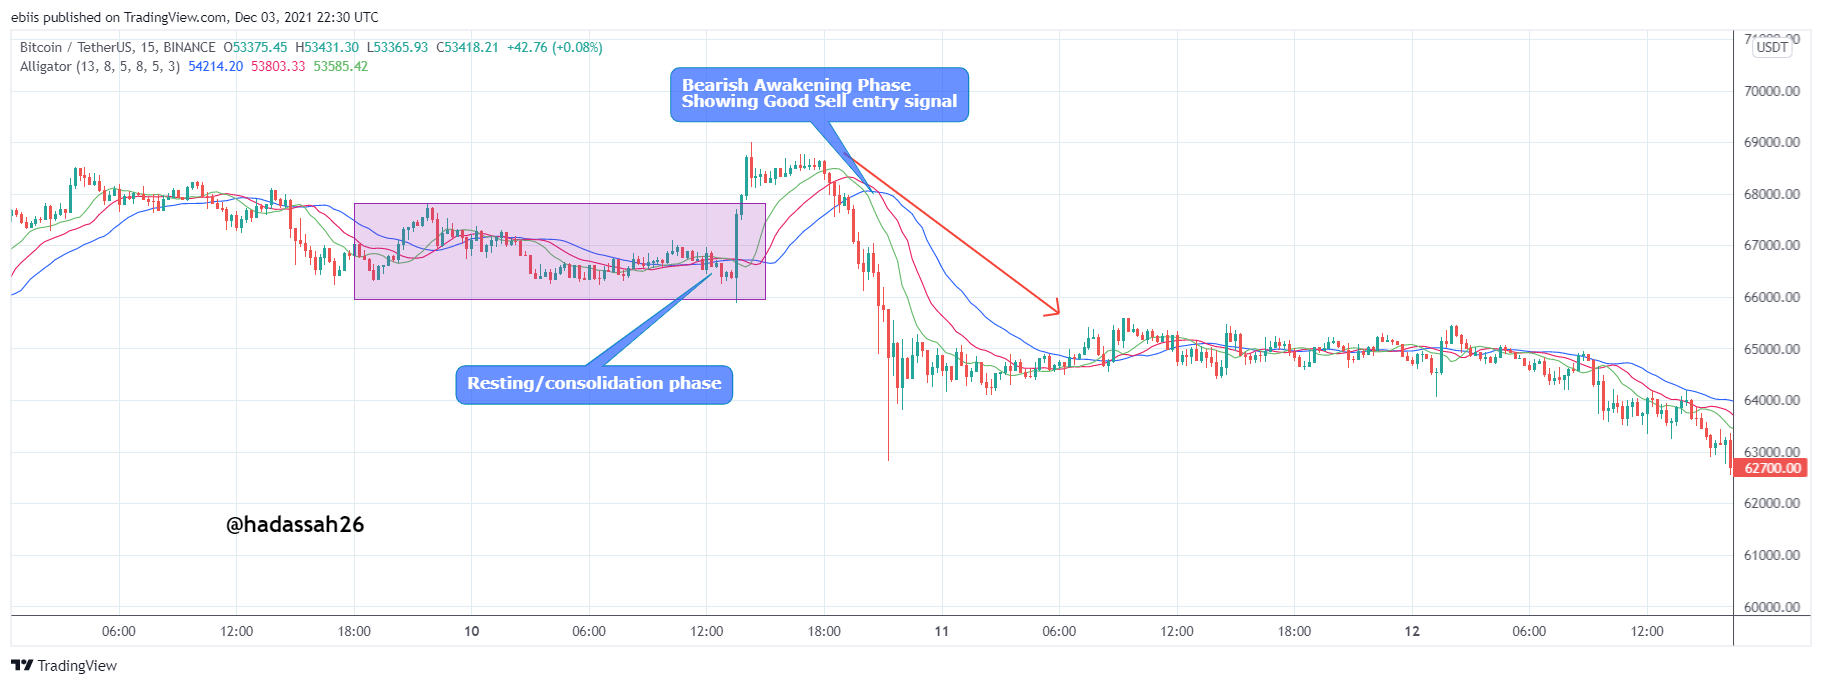
We can also confirm they have a general Negative gradient and are all spreading out from their resting position as shown in the marked zone in the screen shot above.
"6. Do you see the effectiveness of using the Alligator indicator in scalping trading style? Explain this based on a clear example.(Screenshot required)"
Scalp trading involves entering quick market movements and holding the trades for a very short period of time.
This type of trading pattern which has been adopted by most traders lately has seemed profitable.
The Alligator indicator can be used for proper scalp trading as it can tell us of quick market moves especially when its period are set low for fast movements with the market. A good example is explained below:
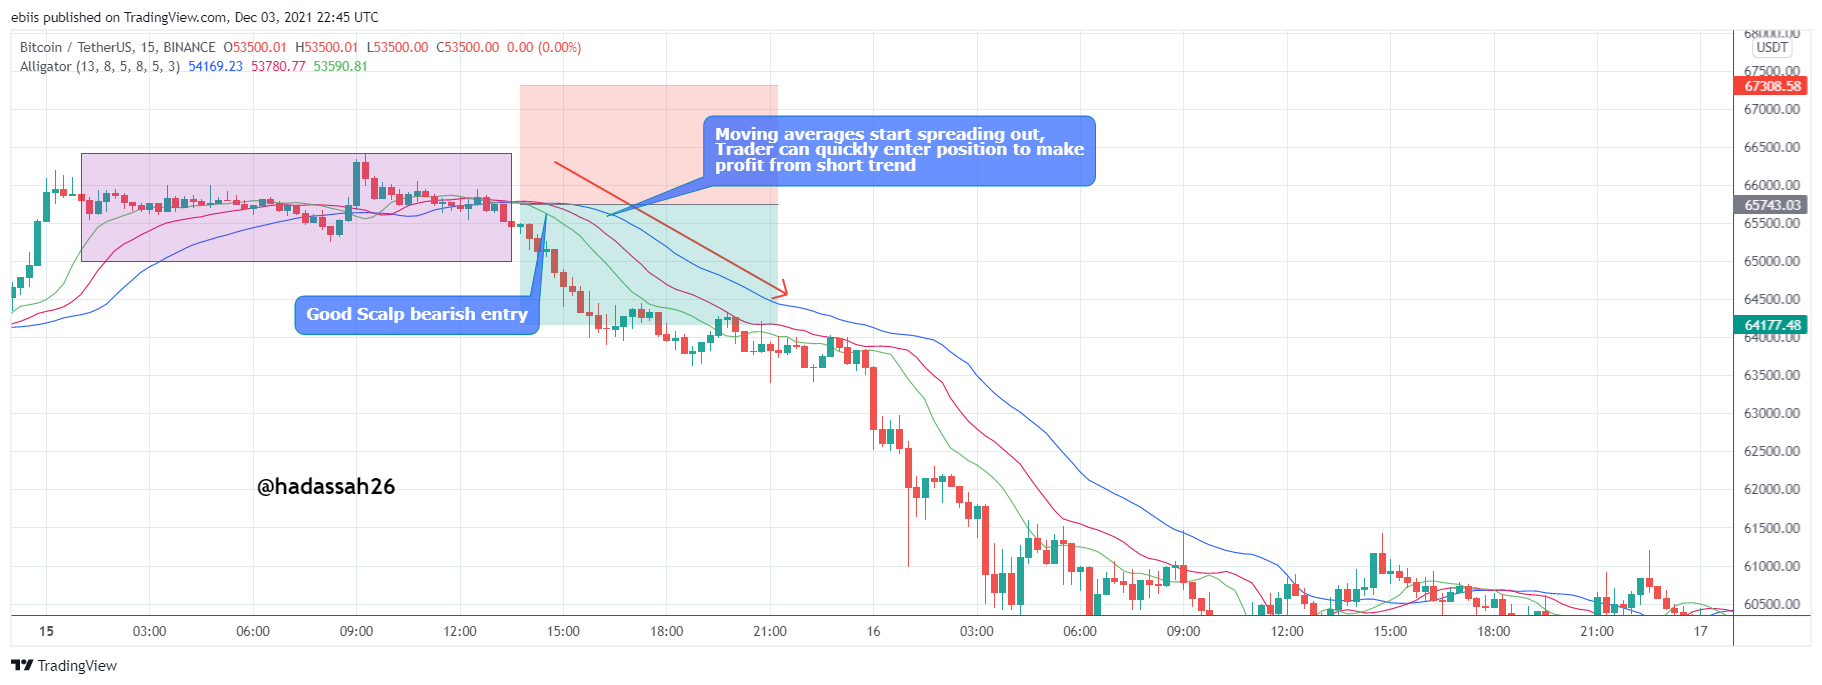
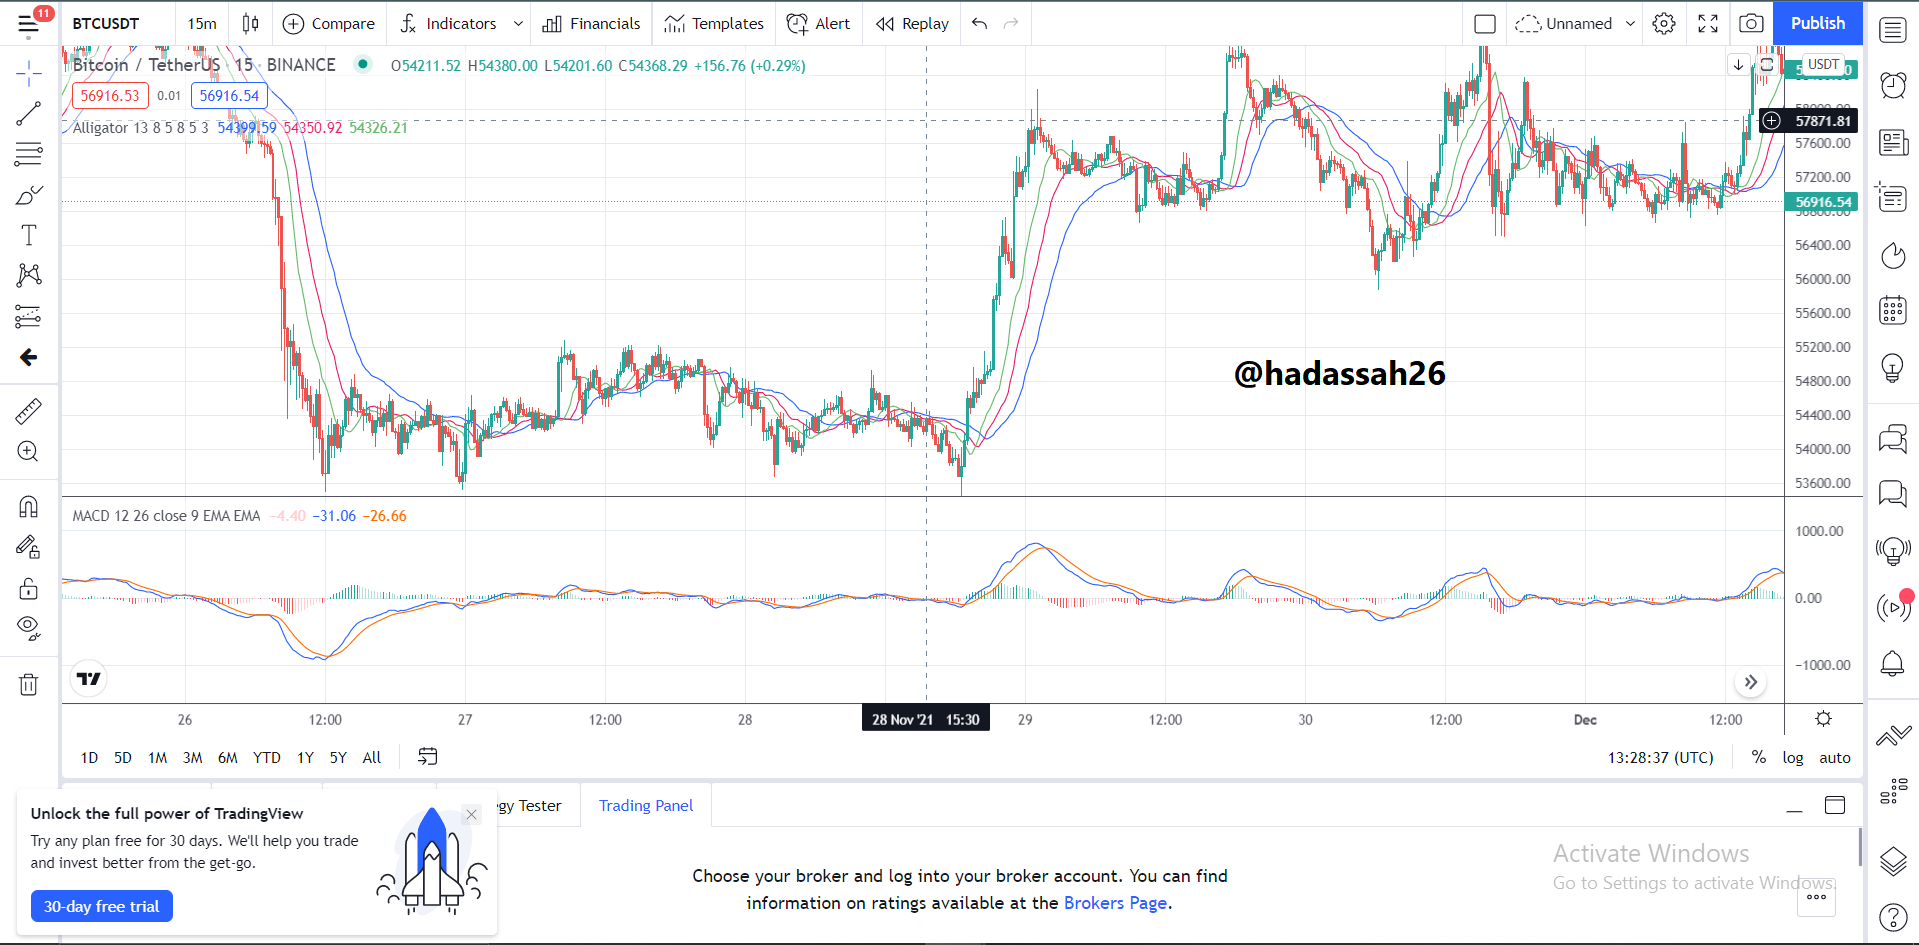
The above chart is a 15 minss time frame BTC/USDT chart.
We can see the Alligator indicator pattern works perfectly well on this short time frame, which is first proof that scalp trading is very possible with the Alligator indicator.
Next we can see how the spreading of the Alligator moving averages on an intending bearish trend(Blue moving average ontop, Green moving average under) synchronizes properly with the price.
We can now enter a short position taking profit when the Moving averages start converging.
"7. Is it necessary to add another indicator in order for the indicator to work better as a filter and help get rid of unnecessary and false signals? Use a graph to support your answer."
No indicator is a stand alone Indicator. Using different indicators for market analysis in general is a great idea as far the indicators don’t become too much filling the traders screen, blocking his view of the market.
The idea behind using another indicator is to calculate other parameters of price so as to compare it with the current parameter result given by the present indicator and then make better trades.
The Alligator indicator is no exception. The Alligator indicator is a trend indicator and so we may want to pair it with a momentum indicator.
Momentum indicators give faster signals of relative price change and so pairing it with a trend indicator such as the Alligator indicator can tell traders of when that price change is bearing a new trend. A good example is shown below.
.png)
On the BTC/USDT chart above having both an Alligator indicator and an MACD indicator, we can zoom in to note the differences signals of the MACD and the Alligator indicator.
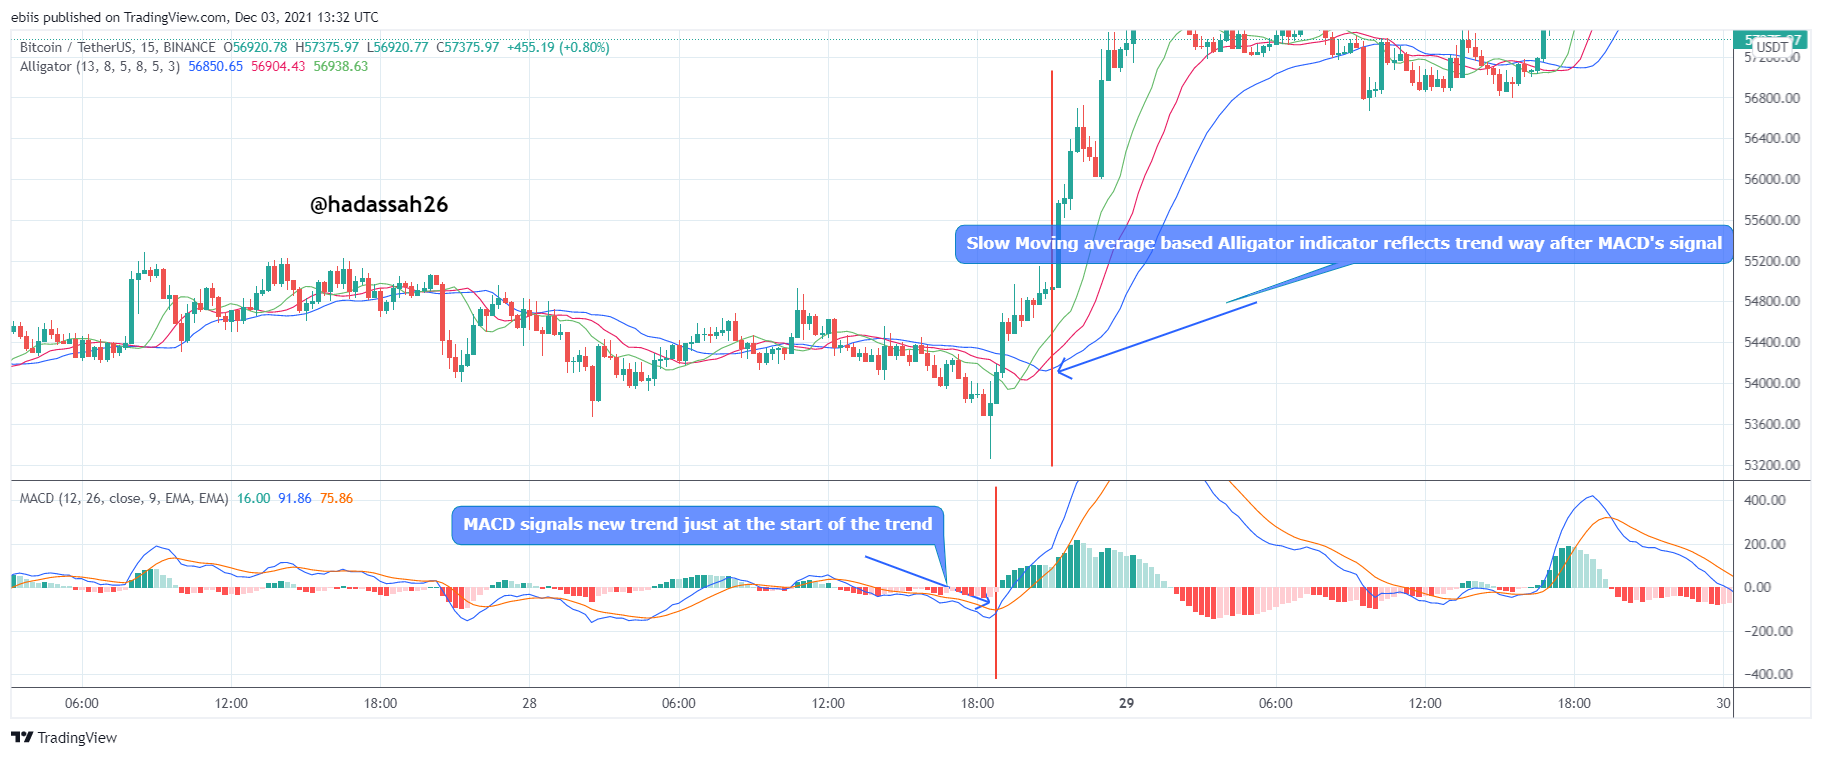
From the Zoomed in screenshot, we can see that the MACD indicator had notified us of the end of a previous trend, and the start of a new trend. The Alligator indicator only confirmed this after a longer period of time.
"8. List the advantages and disadvantages of the Alligator indicator:"
The Alligator indicator has its pros and cons, below I shall be listing and discussing them:
Advantages:
- One of the major advantages of the Alligator indicator is the ease of reading it. it has now numbers to keep track of or divergence patterns to note, just watching out for when it spreads out and we can now confirm a trend on the market.
- Another pro of the Alligator indicator is the confirmations it gives in one signal. Having 3 moving averages, it basically gives us "3 signals" giving the trader a good confidence of entry into the market.
- The Alligator indicator is also a very good trend indicator which can help beginner traders to be able to understand trends and consolidating markets
Disadvantages:
- One major drawback of the Alligator indicator is that it is made up of moving average indicators, and moving average indicators are "lagging indicator", this puts the Alligator indicator to disadvantage as the market trend may have already sailed before the Alligator indicator notifies traders of entry points.
- The Alligator indicator as a moving average based indicator may be prone to errors as slight market surges may reflect trend on its moving averages giving off wrong signals.
The Alligator indicator not only tells us of the trendiness of the market, it is a great indicator for new traders to understand the idea of trendy markets and how important it is not to get into a consolidating market.
Practice increases the expertise on the use of this indicator, more adding a momentum indicator such as the MACD to the Alligator indicator may greatly increase confidence in entering positions.
Thanks to professor @kouba01 for properly explaining this indicator. I appreciate
Wow you really did a good job, more post from you stay safe always hadassah🙂