"Head and Shoulders and Inverted Head and Shoulders Pattern- Steemit Crypto Academy- S5W2- Homework post for @utsavsaxena."
Price pattern is like the rudder that directs analysts on the next move of price.
"It is all in the chart" has been a major saying in the technical analysis world.
Good day beautiful Steemians, I am @hadassah26, welcome to my Steemit crypto academy season 5 week 2 post for professor @utsavsaxena11 on Trading Strategy for Head and Shoulders and Inverted Head and Shoulders Pattern.

"1. Explain Head and Shoulder and Inverse Head and Shoulders patterns in details with the help of real examples. What is the importance of volume in these patterns(Screenshot needed and try to explain in details)"
The Head and shoulder and inverse head and shoulder patterns are a price pattern that inform traders of a current point of inflexion of price from either a bullish to a bearish trend or a bearish to a bullish trend.
The head and shoulders pattern which looks more like the below view of mount Kangchenjunga,
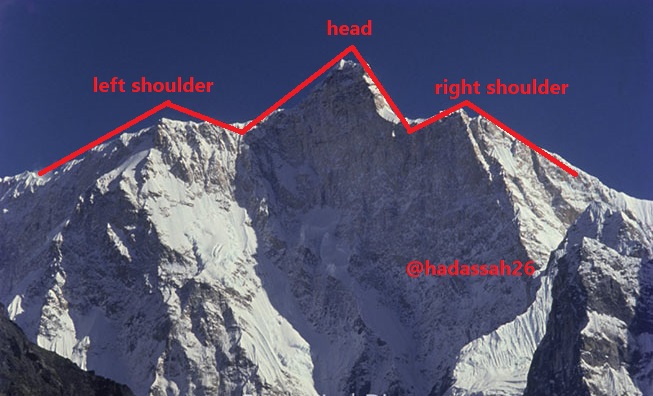
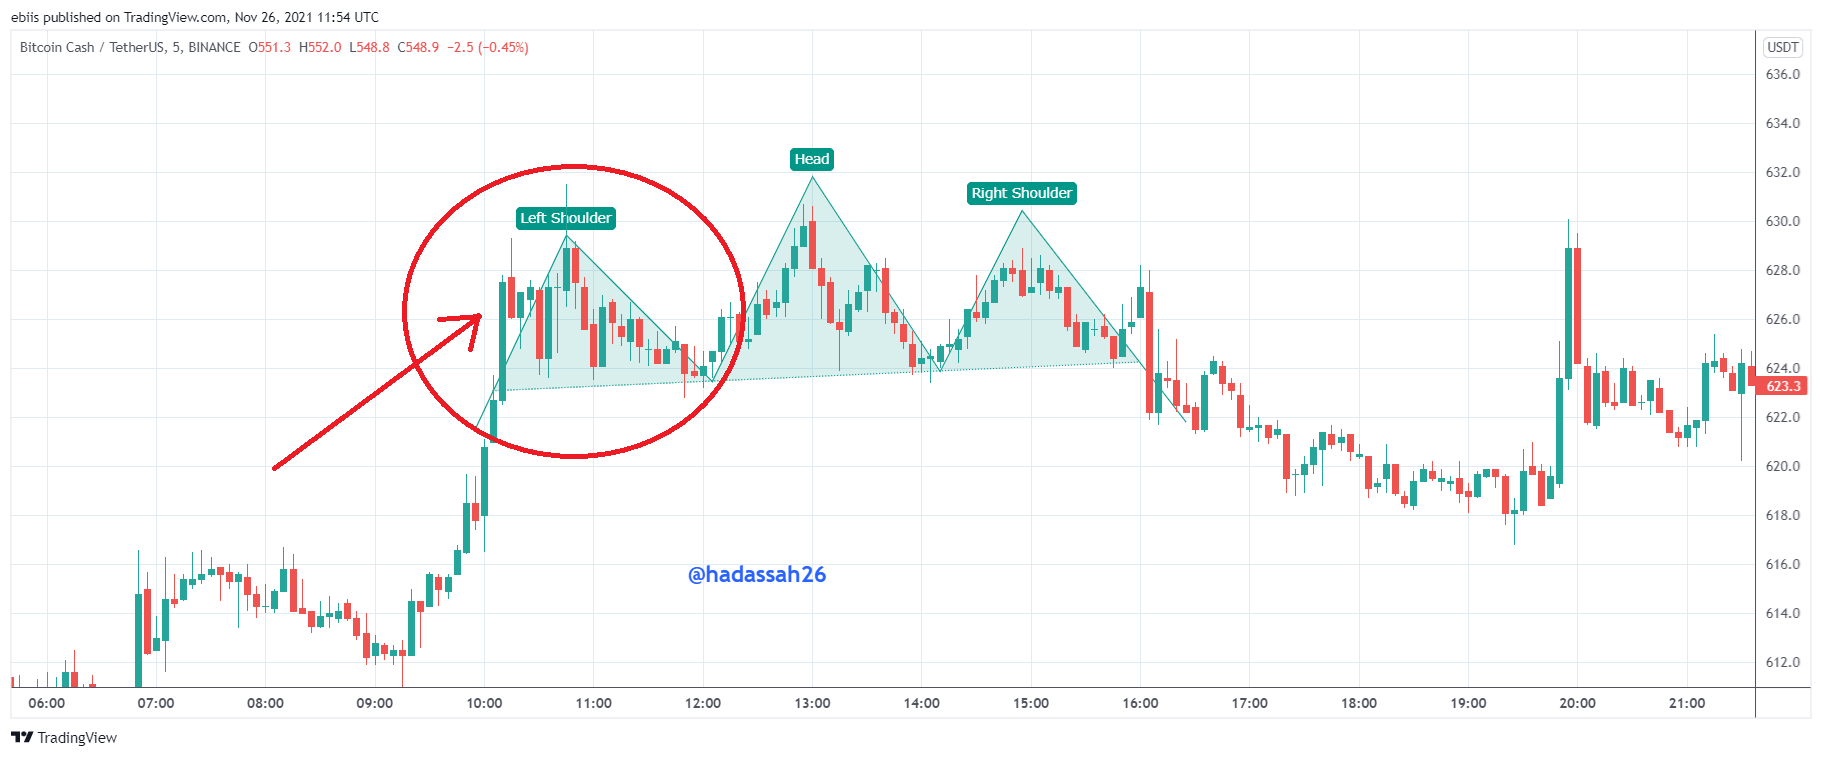
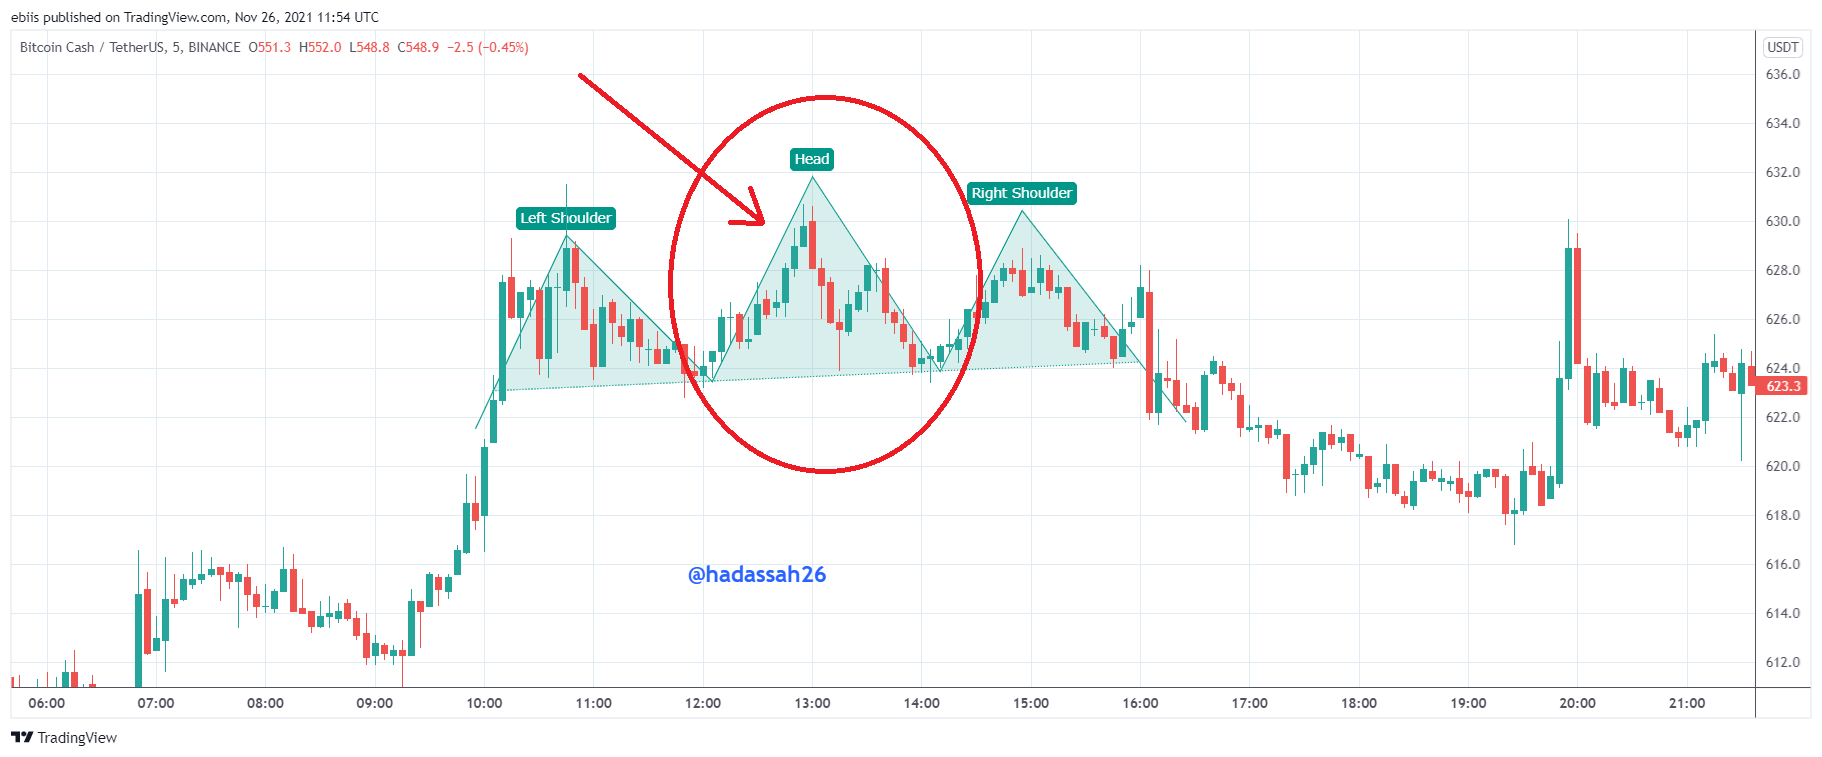
The Head and Shoulder pattern has three peaks which are described as Left shoulder(left peak), Head(center peak) and Right shoulder (right peak).
The head and shoulder structure which happens at the end of a bullish run shows a bullish weakness influenced by traders psychology (this I shall be discussing more in question 2) is the reason why it is a very important price pattern to study as it shows varying fear and greed behavior of traders before the confirmed transition of the bullish trend to a bearish trend.
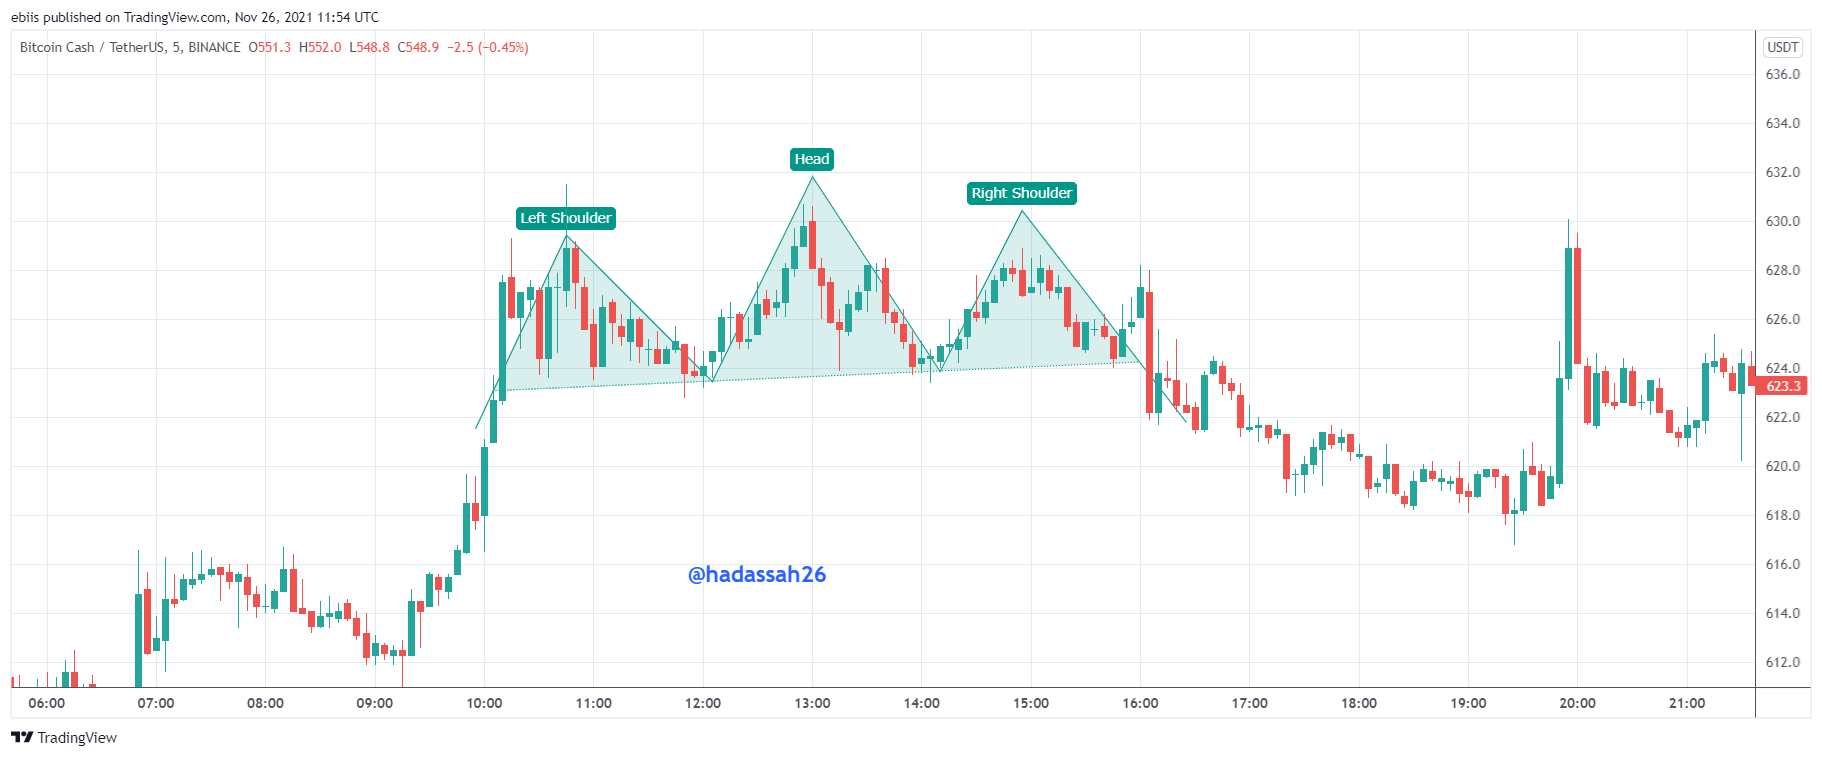
Example Head and Shoulder:
The Inverse head and shoulder pattern as the name implies is basically just the inverse of the head and shoulder pattern, this pattern happens at the end of a bearish trend as it shows the weakening of a bearish trend also majorly influenced by traders psychology.
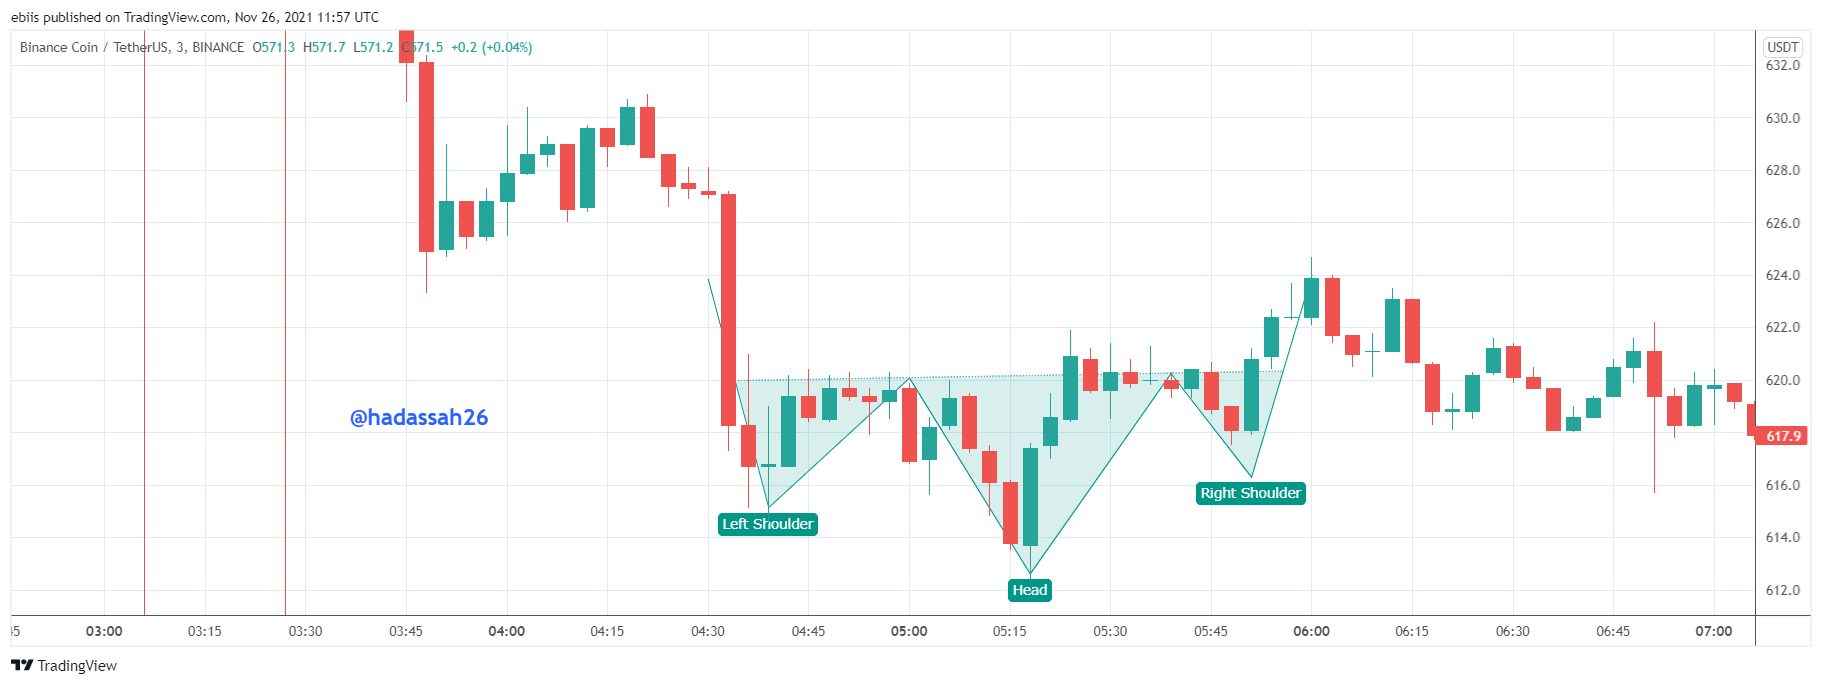
Example Inverse Head and Shoulder:
The price volume is a good indicator when identifying a head and shoulder pattern. It tells traders of entry and exit points (liquidity point) during this pattern so they can take advantage of it.
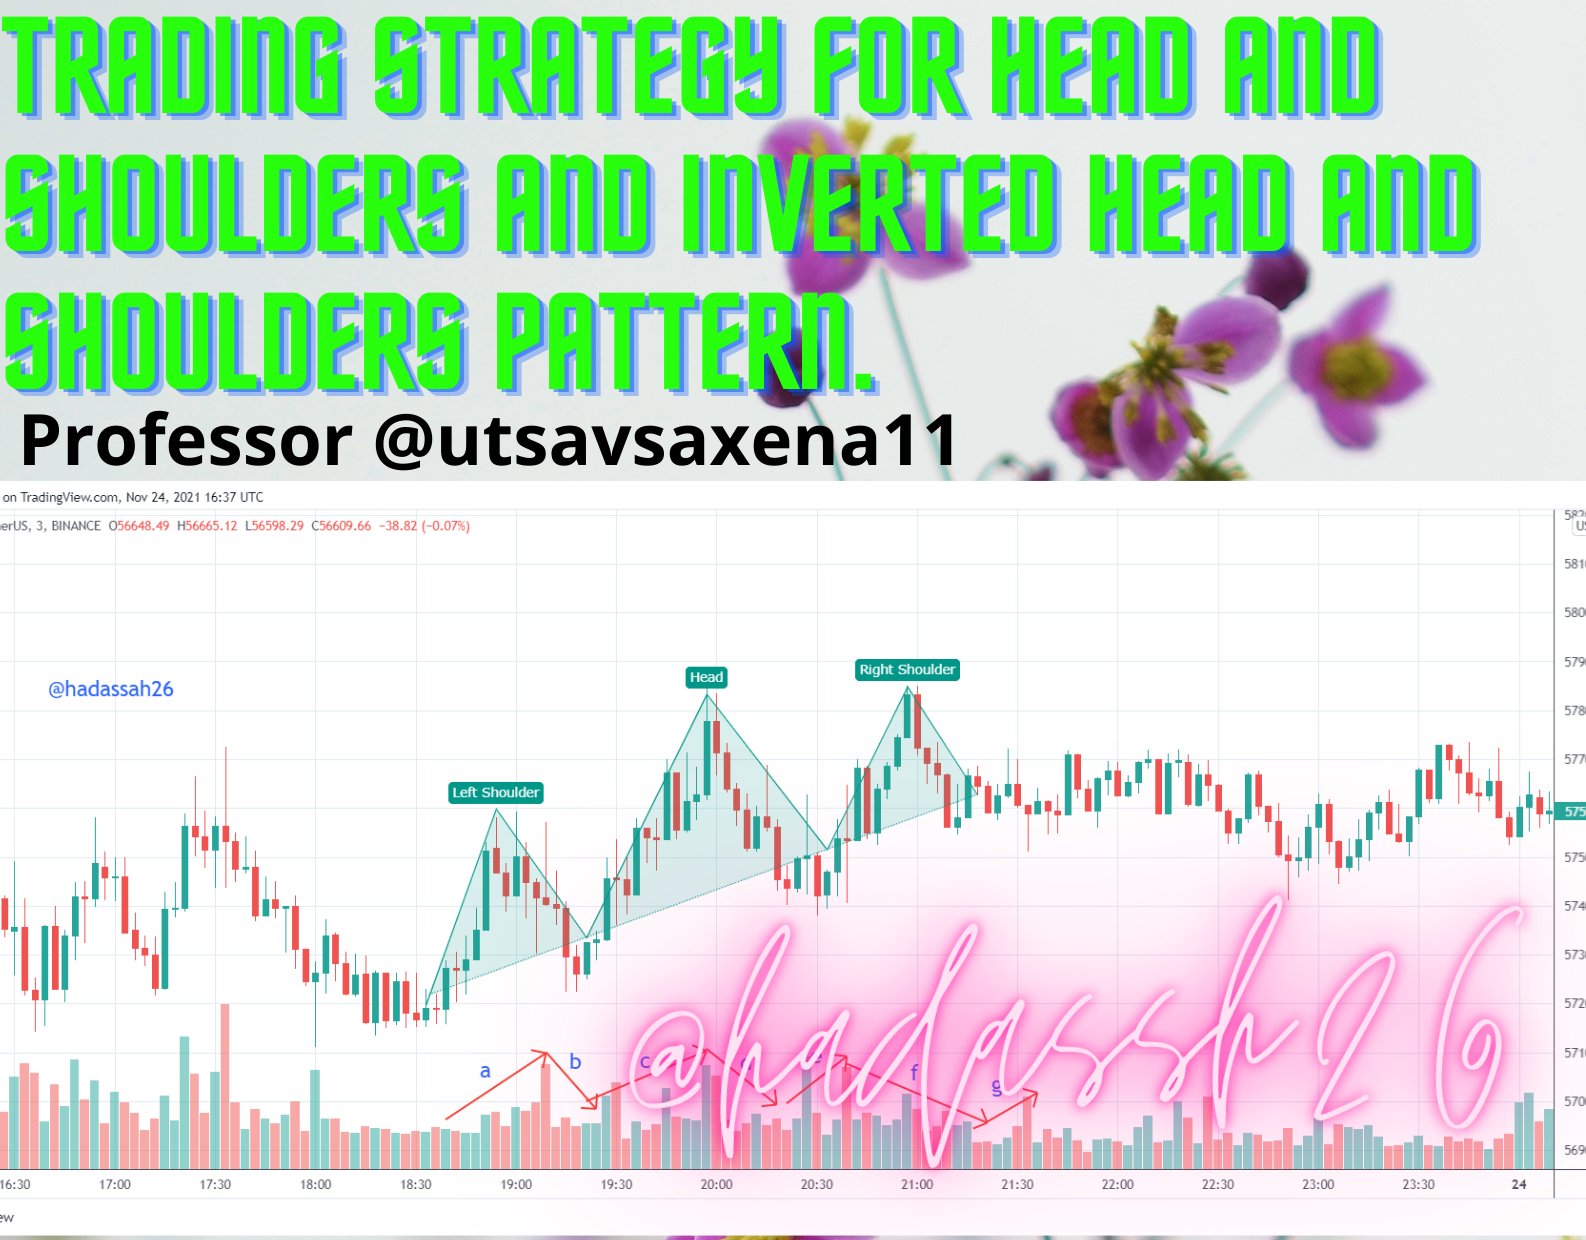
In the picture below, we can see how the volume changes due to the price pattern at the marked regions during the head and shoulder pattern formation.
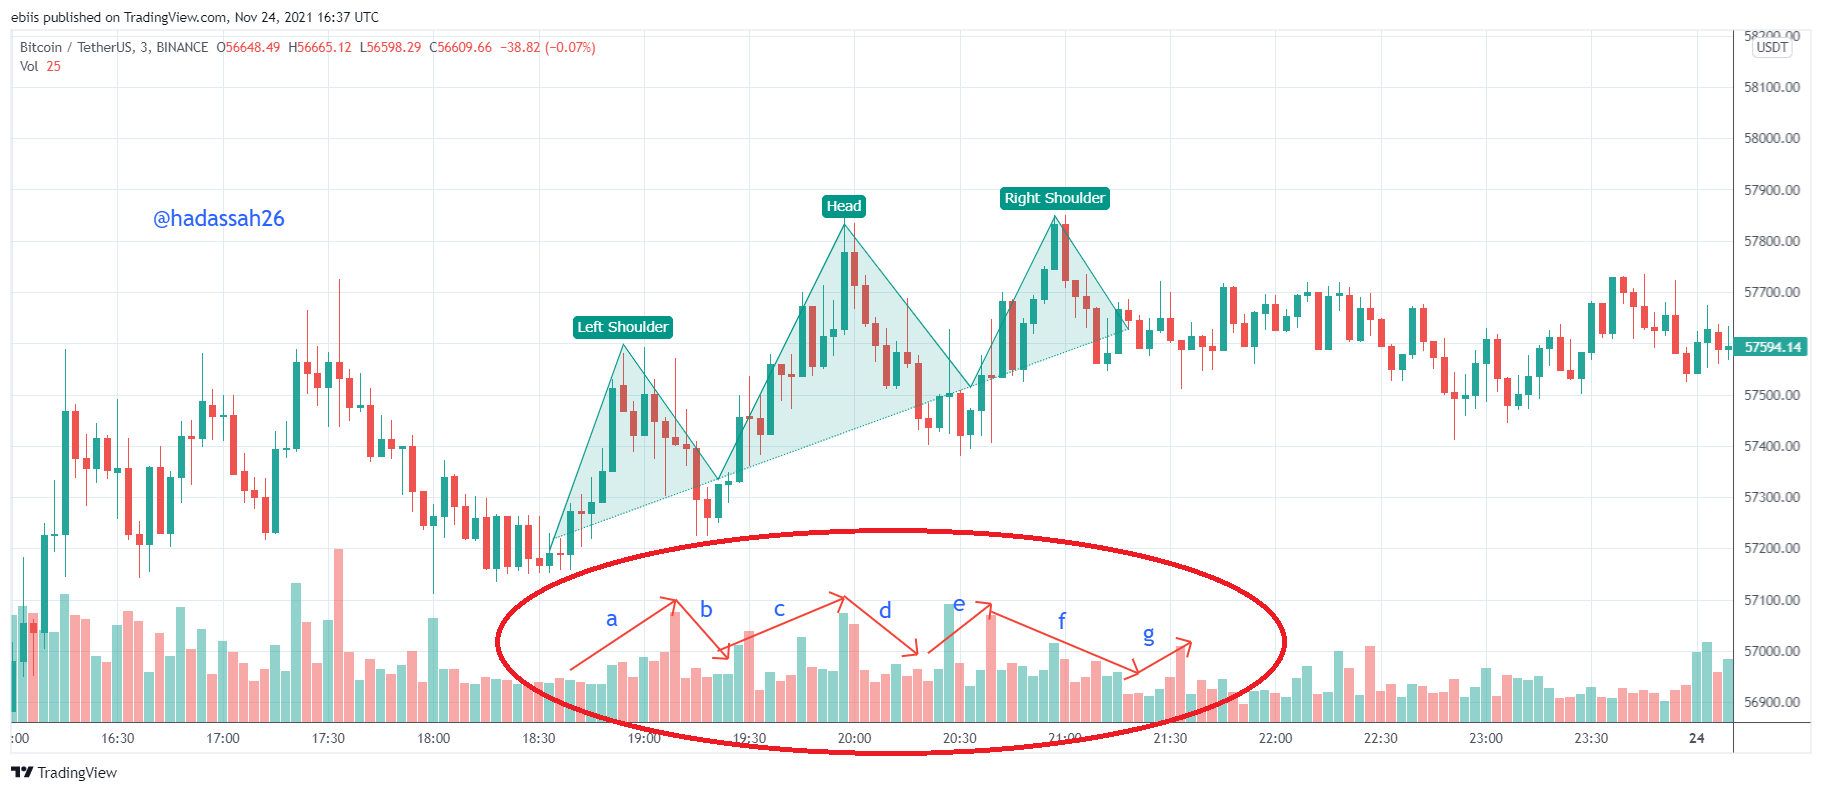
In the chart above, at arrows a, b, c, d, e, f and g show the volume movement during the head and shoulder formation. We can see that at "a", the volume rises, showing a growing buy sentiment, at "b", the volume spikes back down showing that after the huge sell off at the start of arrow "b" the trend keeps sloping down. Then again at "c" the volume spikes back up at the bullish retracement.
Again at "d", volume starts from a spike bearish volume to a continous downtrend during the bearish movement of price from the "head", then again volume sees a new pump at "e", as some new entry traders may have mistaken the entire trend as an uptrend elliot wave movement, but price only slopes back down causing a volume reduction at "f", then again we see that at confirmation of the head and shoulders pattern, traders pump a downtrend causing a negative volume to rise at "g".
"2. What is the psychology of market in Head and Shoulder pattern and in Inverse Head and Shoulder pattern (Screenshot needed)"
The head and shoulder pattern shows the end of the immediate trend and the start of a new trend, either from a bullish trend to a bearish trend (head and shoulder) or from a bearish trend to a bullish trend (inverse head and shoulder).
This doesn't go without a psychological playout by traders.
As a trend continues in its direction, fear builds up among traders holding the trend. The trend begins to weaken, and it soon breaks the current market structure causing the first shoulder.
Other traders see the huge drop of the trend and then buy in the retracement, causing the price to go back even above the shoulder forming the head.
But the previous bullish traders have already lost faith in the trend, and so the price falls back down crashing back to the previous low. Again it tries to build back up (forming the right shoulder).
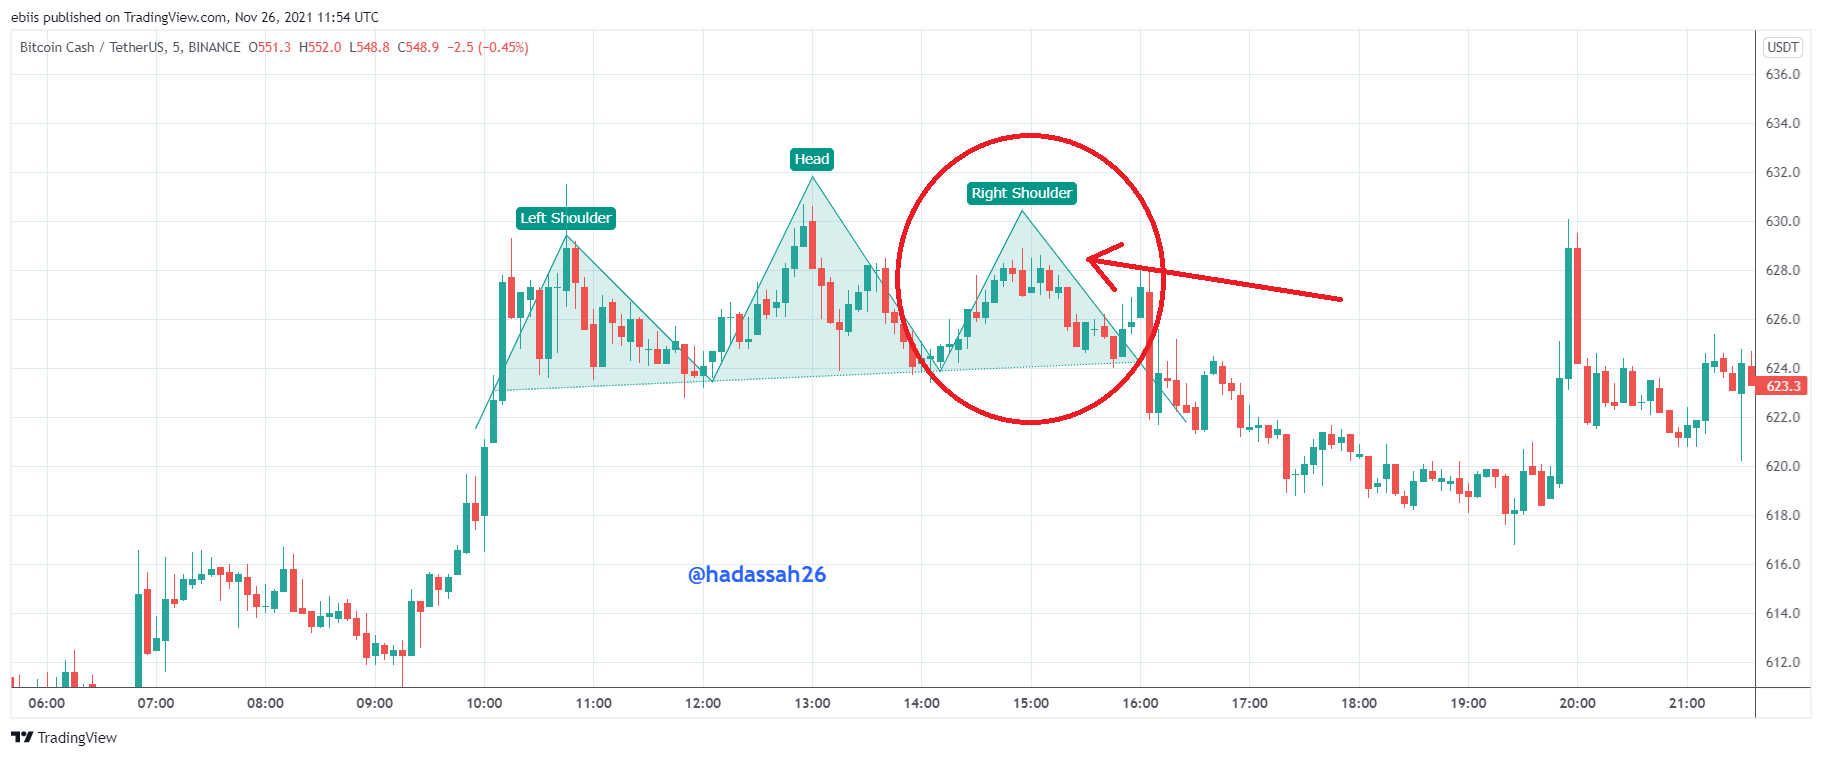
Now all of the initial trend momentum is lost and so price continues in the new bearish trend causing a new sentiment, and traders entering the market for the new trend.
The inverse Head and Shoulder follows the same pattern but in inverse. As price continues to trend down, traders become cautious of the trend and start buying back positions, this causes the trend to have its first bullish retracement, causing the left downward facing shoulder. More traders sell the position with hope to catch on the retracement. Price slides back down causing the head of the triplet pattern. Again more traders buy the position which causing price to try break the initial resistance, but only fall back down causing the right downward facing shoulder.
Price moves back up and traders are sure the bearish trend is ended, a new bullish trend starts as more bullish traders join in. Bullish trend is confirmed.
"3. Explain 1 demo trade for Head and Shoulder and 1 demo trade for Inverse Head and shoulder pattern. Explain proper trading strategy in both patterns separately. Explain how you identified different levels in the trades in each pattern(Screenshot needed and you can use previous price charts in this question)"
DEMO TRADE HEAD AND SHOULDER
From the chart below, we can draw a head and shoulder pattern on the BTC/USDT from the 24th of November on the 15 mins timeframe.
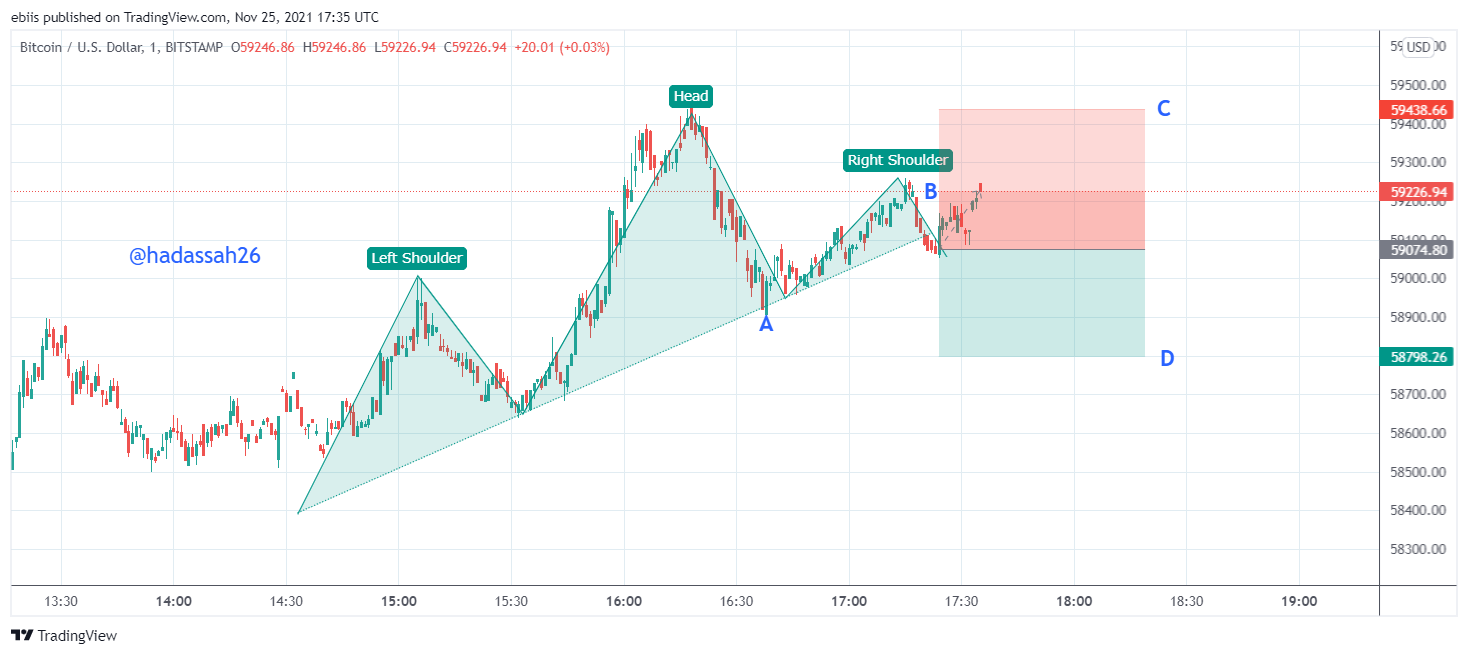
We draw our neck line at "A", awaiting for price to break it after the right shoulder.
On price breaking the neckline at "B", we take our entry position.
Our Target level is the distance between the head peak and the left shoulder trough.
We enter the trade taking cautious risk management. Setting our Stop loss at "C" and take profit at "D" with a 1:1 risk to reward ratio.
Trade Data:
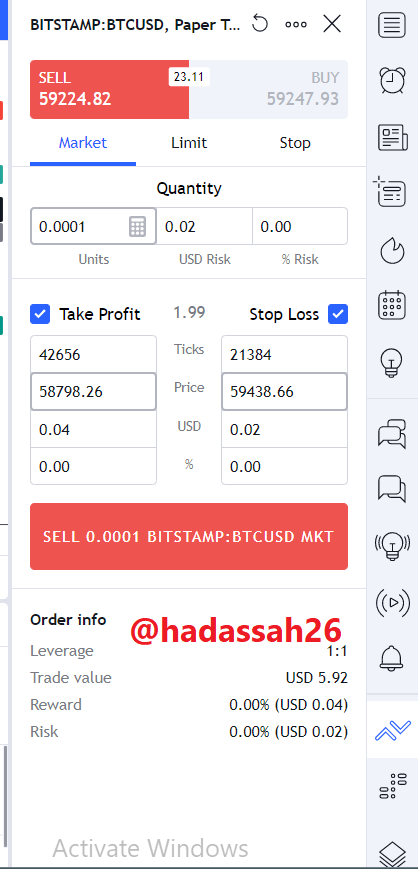
| Currency Pair | BTC/USDT |
|---|---|
| Price | 59,224.82 USDT |
| Stop loss | 58,798.26 USDT |
| Take profit | 59,438.66 USDT |
DEMO TRADE INVERSE HEAD AND SHOULDER
Looking at the SOLANA/USDT chart below, we see a just completed inverse head and shoulder pattern formed.
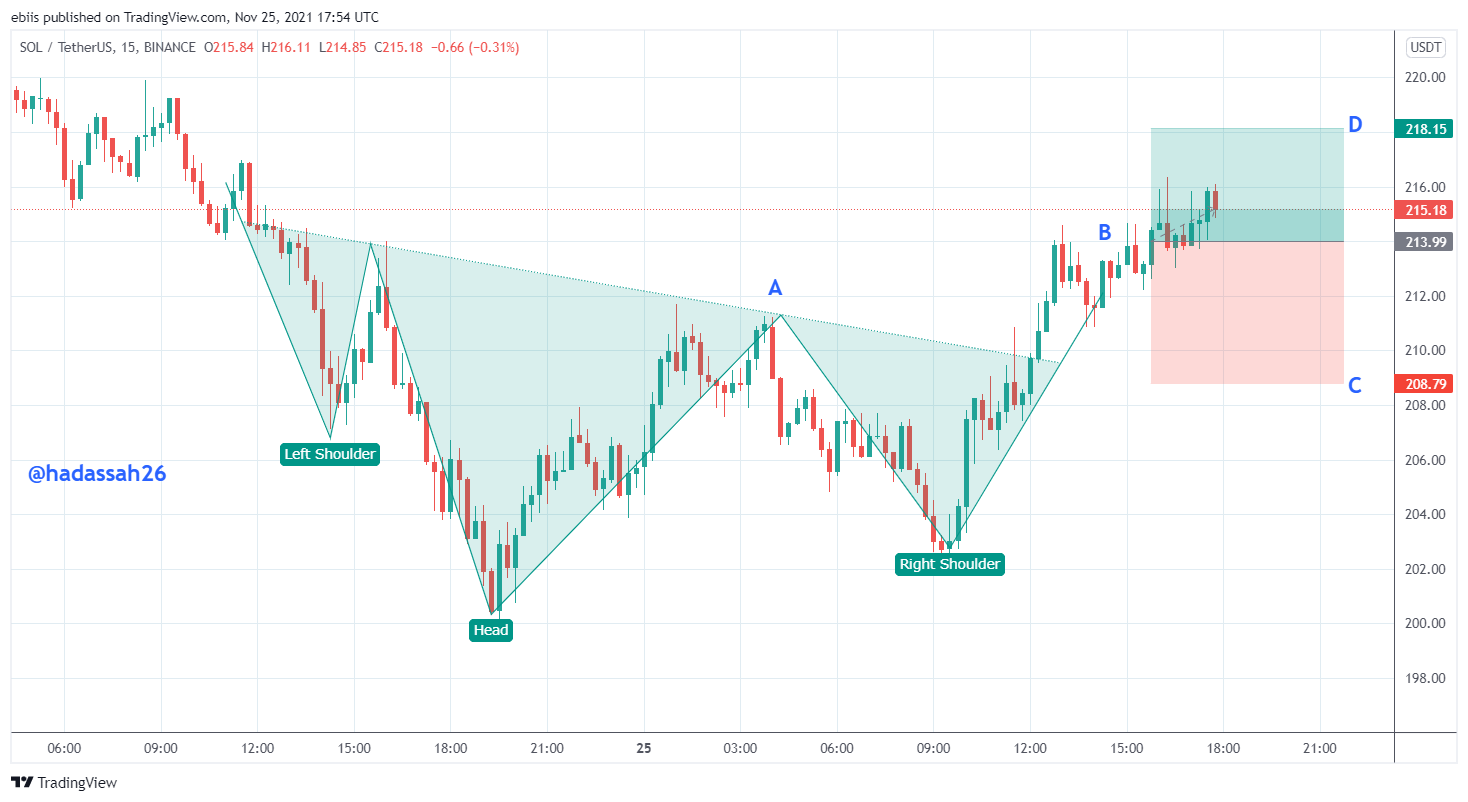
I draw the neckline at "A". For price to break it as a confirmation of the trend.
Price breaks the neckline at "B", forging forward.
Our Target level is the distance between the head peak and the left shoulder trough.
We enter the trade taking cautious risk management. Setting our Stop loss at "C" and take profit at "D" with a 1:1 risk to reward ratio.
Trade Data:
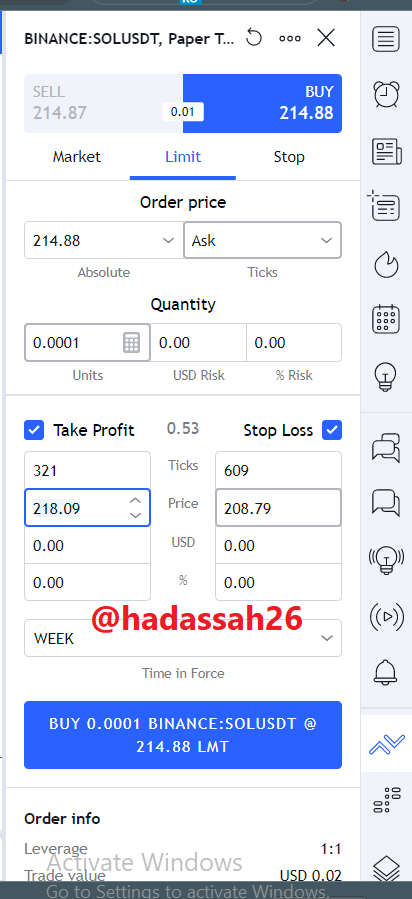
| Currency Pair | SOL/USDT |
|---|---|
| Price | 214.88 USDT |
| Stop loss | 218.09 USDT |
| Take profit | 208.79 USDT |
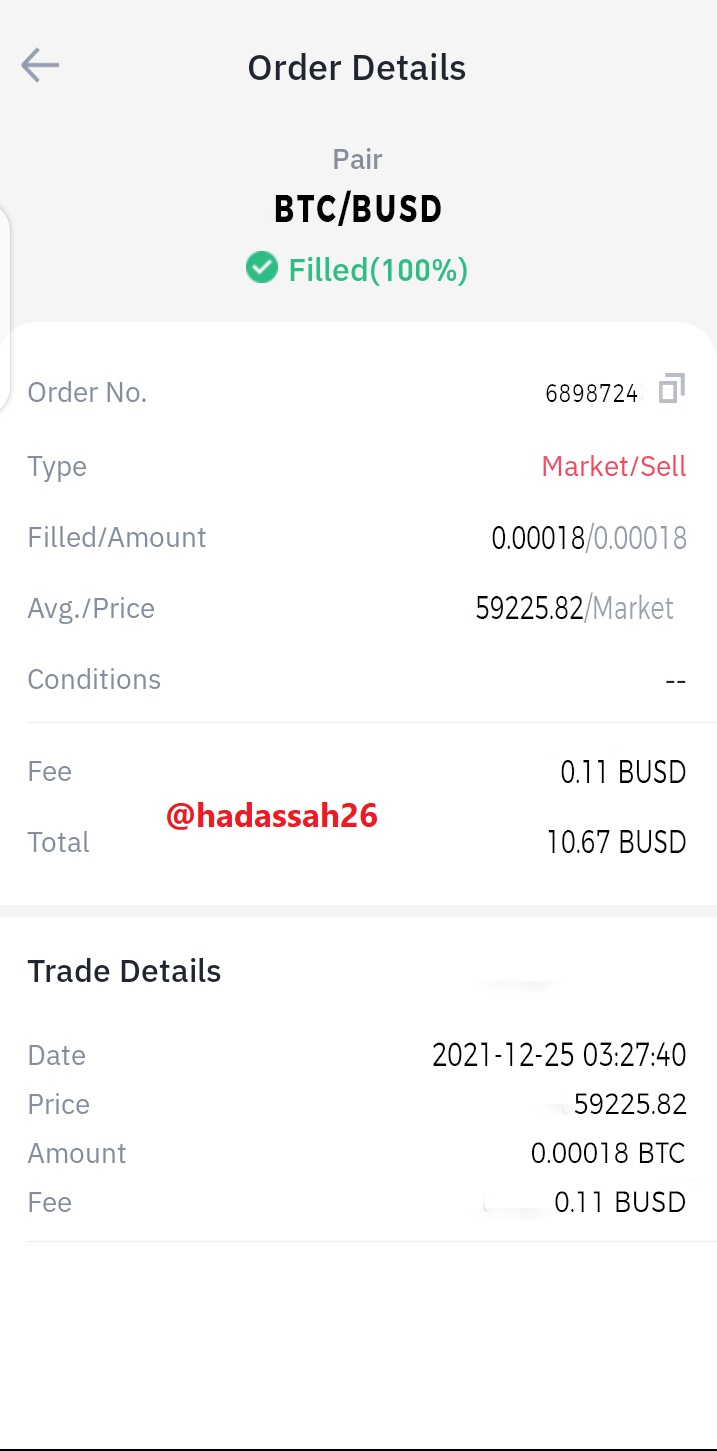
"4. Place 1 real trade for Head and Shoulder(atleast $10) OR 1 trade for Inverse Head and Shoulder pattern(atleast $10) in your verified exchange account. Explain proper trading strategy and provide screenshots of price chart at the entry and at the end of trade also provide screenshot of trade details.(Screenshot needed.)"
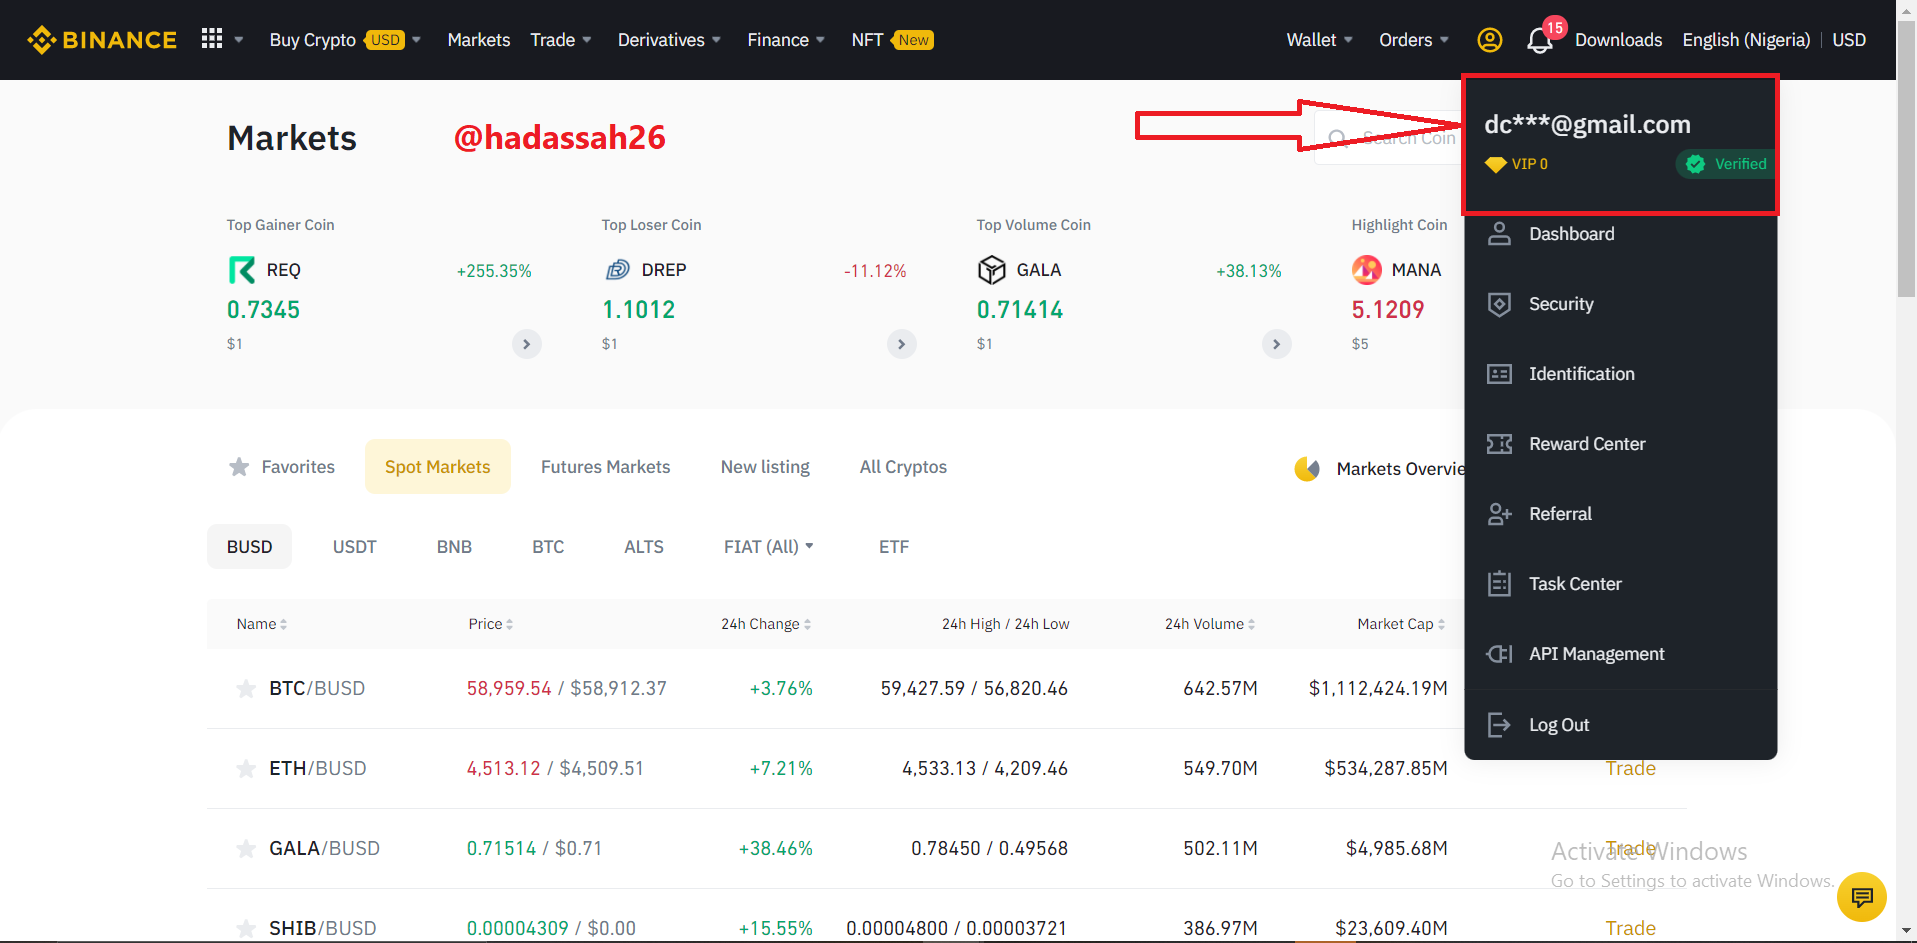
Using my verified Binance account, Pic below:
.png)
Watching the BTC/BUSD 1 minute timeframe from Binance Markets, I see a good inverse head and shoulder pattern formation.
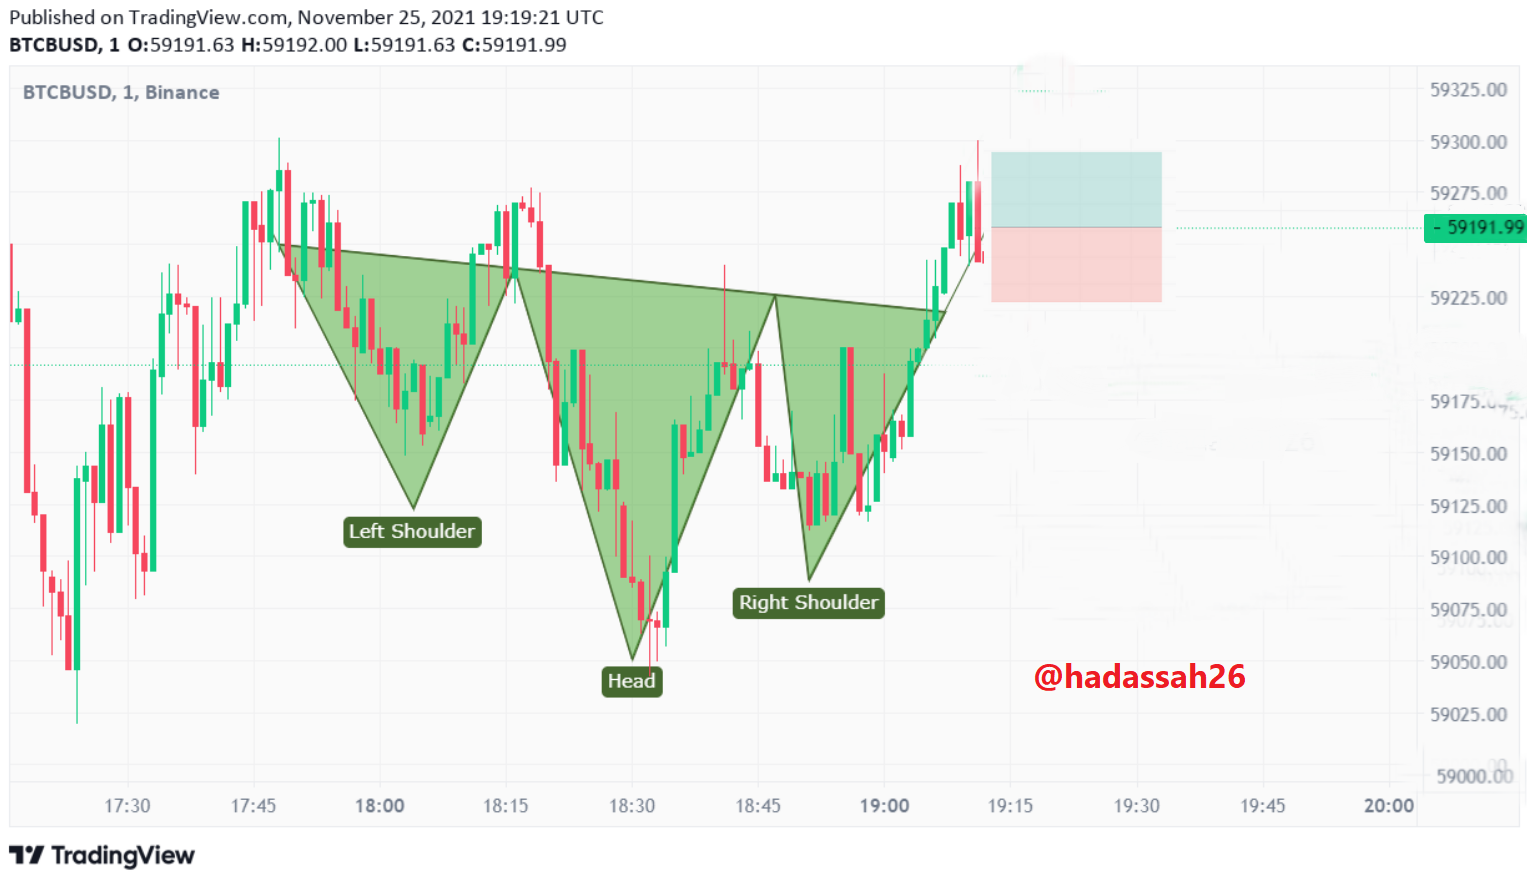
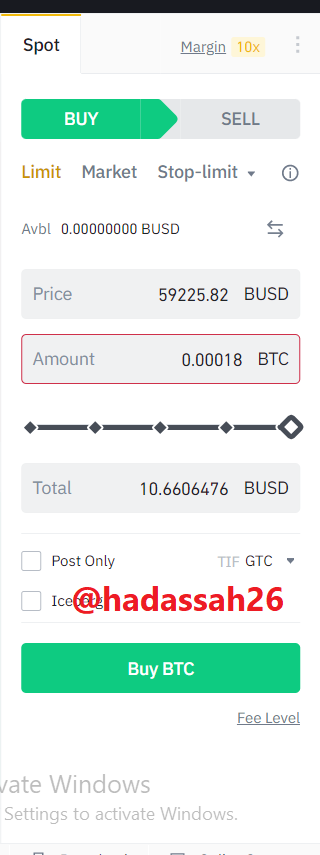
I enter the trade, at price 59,225 BUSD,
Observing risk management, estimating the Target level is the distance between the head peak and the left shoulder trough I set my stop loss at 59,300 BUSD and take profit at 59,175 BUSD.
Trade Data:
| Currency Pair | BTC/BUSD |
|---|---|
| Price | 59,225 BUSD |
| Stop loss | 59,300 BUSD |
| Take profit | 59,175 BUSD |
Price pattern is a depiction of the general forces affecting the market. From fundamental sentiments to sheer greed and fear among traders, or even market manipulation by institutions. "It is all in the charts".
The Head and Shoulder/Inverse Head and Shoulder pattern is one of the major price patterns that shows reversal of trend. other similar patterns which are the double tops or market structure break may also be found when the Head and shoulder isn't formed during these price trend points of inflexion.
Thanks to professor @utsavsaxena11 and the steemit crypto academy for enlightening us on this topic.
I appreciate.