[How to Trade Cryptocurrencies Profitably Using TD Sequential]-Steemit Crypto Academy | S4W8 | Homework Post for @reddileep
Hello everyone


1-Define TD Sequential Indicator in your own words.
Every dream of a trader be it in the forex, cryptocurrency and stock market is to make a reasonable amount of profit. But most times the opposite gets to be the result. Traders have lost money for several reasons.
In the general market, every trader must use either the Fundamental analysis or the technical analysis to properly analyze the market. Fundamental analysis traders in the crypto space look for some features of the token such as its liquidity, capitalization, market supply, and so many more things, while the technical analysis traders study the chart patterns properly to understand the price behavior. This price behavior can be seen in a chart that is represented by a candlestick. Technical analysis also makes use of technical indicators which helps trader study the behaviour the property. There are many types of indicators in the crypto market today, some may include, the RSI, Bollinger bands, moving averages, Fibonacci retracement, Ichimoku and so on. And each indicator has its special function. Understanding the uniqueness of these indicators can make you very profitable in the market.
Today we will be looking at one of the indicators, which is known as the TD Sequential Indicator. This indicator as other indicators is used to analyze the market. What does it do? We also know that price moves in three directions in the market, which are up, down, and side movement. Most traders are looking for an Upward direction and downwards direction, which can also be called a trend. This is where the TD sequential indicator comes into play. This indicator is used to detect trend reversal or correction in the market. Trend reversal whenever either the buyers or the sellers are weak. TD sequential indicators inform traders about the reversal and the correct. This is one of the major points that the traders are looking for. So if a trader enters a trade at the point of reversal, he will have a very huge profit. This particular indicator was formed by a man called Tom Demark. And the indicator took the initials of his two names. This indicator can be used in any time frame in the market but it is advisable to use them in a larger time .
2-Explain the Psychology behind TD Sequential. (Screenshots required)
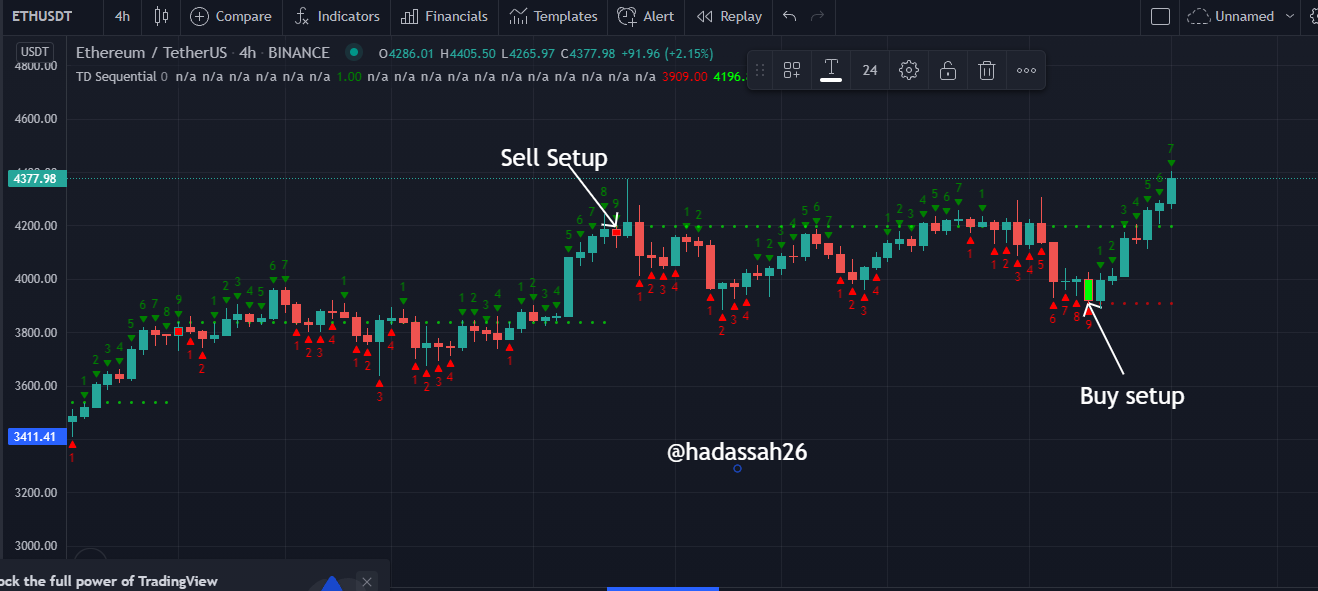
The TD sequential indicator detects trend reversal or correction, especially when the buyers or sellers are weak in the market. The indicator is made up of numbers counting from 1 - 9. these numbers are seen on the top of the candle or under the candlestick. Both have what they signify.
The TD sequential as other indicators get their data from the candlestick. You can use it to either buy or sell an asset in the market. The number from 1 to 9 indicators is something very useful, as I said earlier, understanding of one technical indicator can make you very profitable. But the TD sequential indicator is made up of two phases.
- Setup phase
- Countdown phase
The setup phase is the phase that arranges the candlestick before the reversal would take place. If the candlestick is not properly arranged in connection to the guidelines of the TD Sequential indicator then the reversal will not take place. The setup phase consists numbers ranging from 1 - 9, whenever the number completes 9, the reversal might take place.
The setup phase is further divided into two, namely the buy setup and the sell setup. The buy setup is all the arrangement of the candlestick that suppose to be in place in respect to the TD sequential indicator before a trader can execute a buy order. This occurs mostly after a downtrend .
The sell setup is the reverse of the buy setup. The sell setup is all the necessary arrangement of the candlestick in respect to the lay down rules of the TD sequential indicator that must be on the ground before you can execute a sell order. this occurs mostly after an uptrend in the market.
The Countdown Phase:
The countdown phase is as important as the setup phase, this happens as a result of the failure of the setup phase. After you might have counted from 1 - 9, and the candlestick moves in an unexpected direction, you should continue your counting up to 13, to properly confirm the reversal. The countdown phase can be used for both sell setup and buy setup.
3-Explain the TD Setup during a bullish and a bearish market. (Screenshots required)
We will be looking at the TD sell setup and TD buy setup
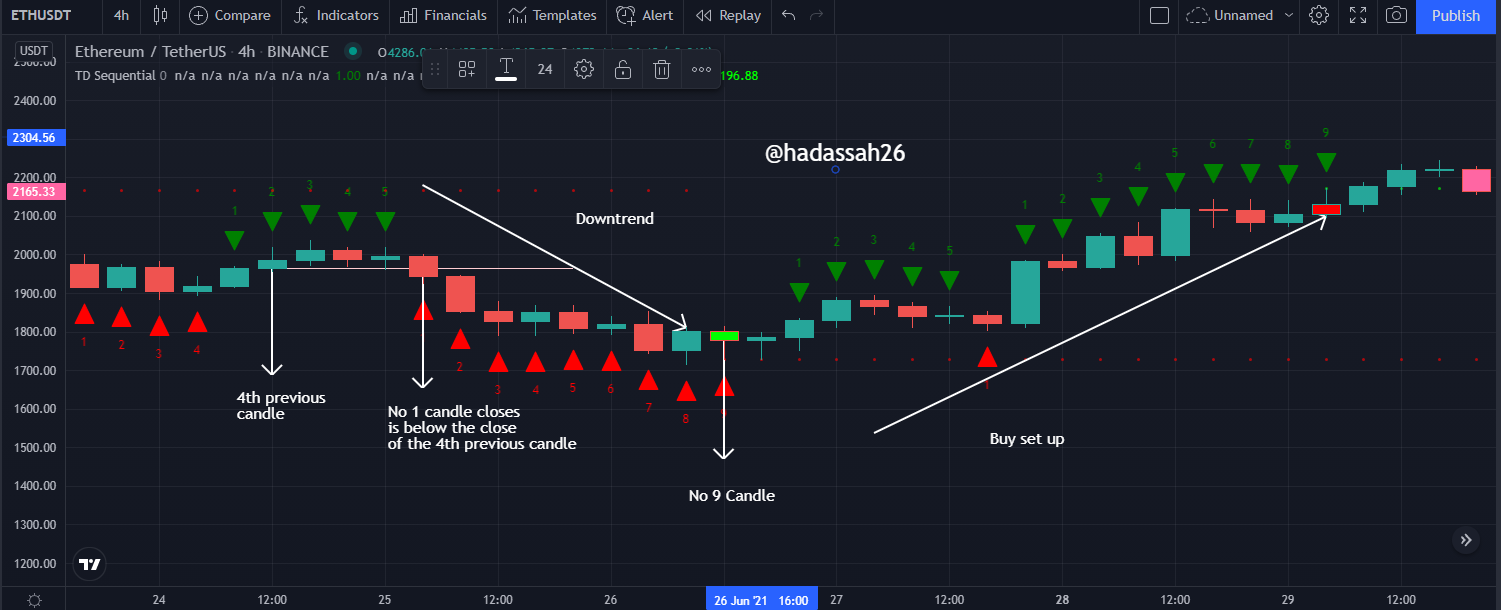
BUY SET-UP
Before the Buy setup will the price has to be on a downtrend initially
These are the condition that must be in place to achieve a proper Buy setup.
- The price must be on a downtrend
- To begin the counting, the candle one must close below the close of the 4th previous candle. This can be seen in the chart for proper understanding.
- If count one(1) closes below the close of the 4th previous candle, you can use a line to confirm it properly. Then you can continue the counting
- The count two (2) must also close below the close of the 4th previous candle.
- The counts 3,4,5,6,7,8 & 9 must all close below the close of the 4th previous candle.
- Once the count gets to 9, you should be ready for a reversal. And execute a buy order. But if it continues downward, it has entered the countdown phase.
- The countdown phase, you will continue your counting until it gets to 13 . in count 13, you can also enter the buy order .
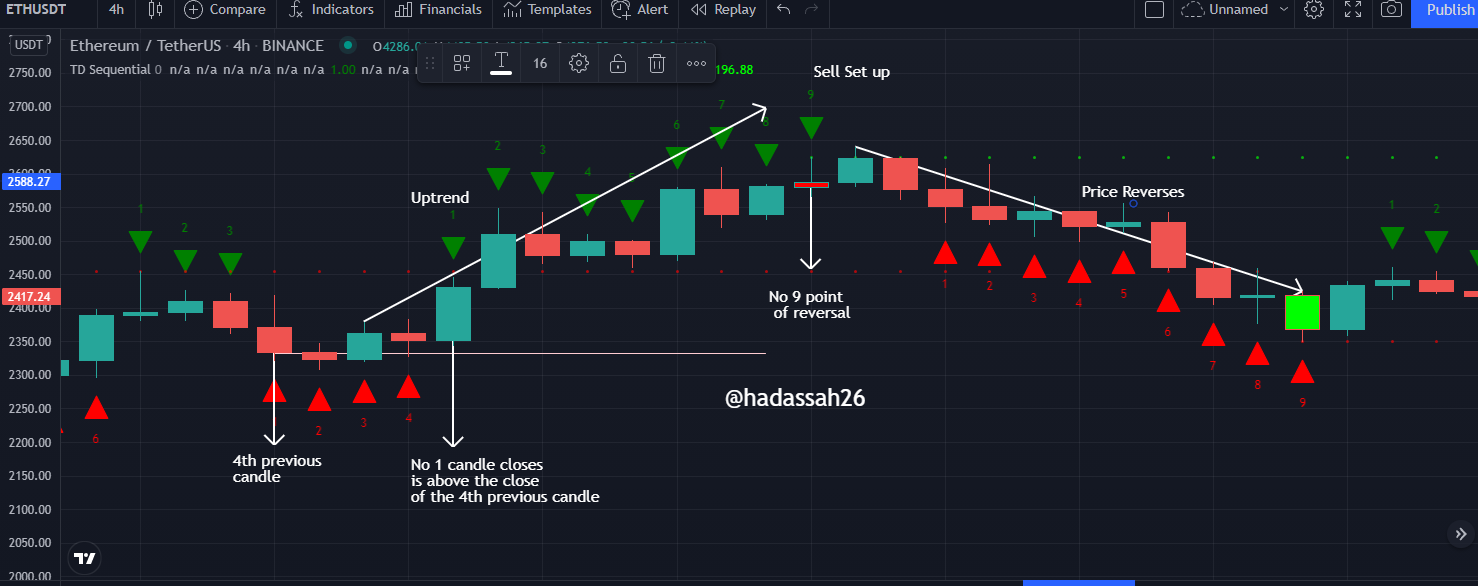
SELL SET-UP
Before the Sell setup will the price has to be on an Uptrend initially
These are the condition that must be in place to achieve a proper Buy setup.
- The price must be on an Uptrend
- To begin the counting, candle one(1) must close above the close of the 4th previous candle. This can be seen in the chart for proper understanding.
- If count one(1) closes above the close of the 4th previous candle, you can use a line to confirm it properly. Then you can continue the counting
- The count two (2) must also close above the close of the 4th previous candle.
- The counts 3,4,5,6,7,8 & 9 must all close above the close of the 4th previous candle.
- Once the count gets to 9, you should be ready for a reversal. And execute a sell order. But if it continues upward, it has entered the countdown phase.
- The countdown phase, you will continue your counting until it gets to 13 . in count 13, you can also enter the sell order .
4-Graphically explains how to identify a trend reversal using TD Sequential Indicator in a chart. (Screenshots required)
By now we should know that the TD sequential indicator is used to identify a trend reversal but the question is how do you know when the reversal is about to happen. Let's look into this chart below and carefully explain it properly.
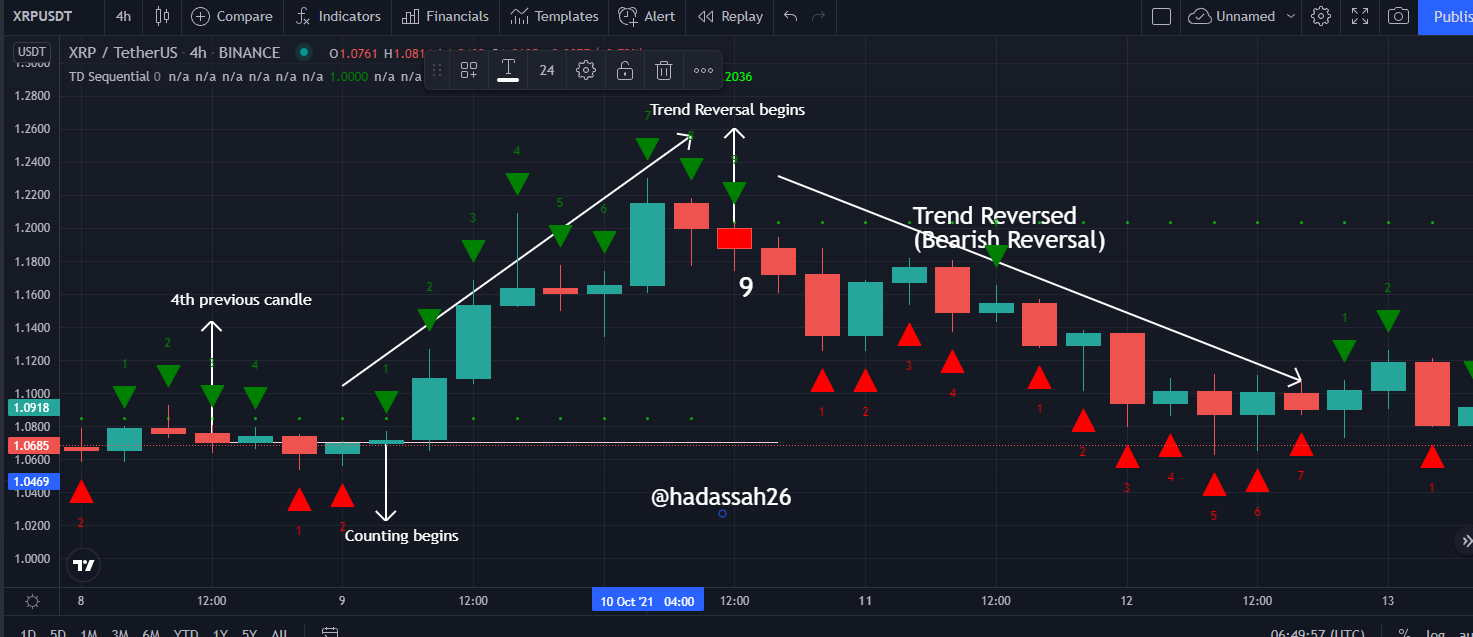
The XRPUSDT is in an 4 hour time frame. We can see that the price was on an uptrend, the uptrend has been for a long time and the sell set up started. The sell setup started when the number 1 count candle closes above the close of the 4th previous candle. This thing repeated itself for the 2nd,3rd to the 9th candle. When it reached candle 9 most times the color is different so that you can easily identify the 9th candle because that is the point of reversal. You should just wait for the next candle after the 9th candle, if the close of the next candle is below the close of the 9th candle, then you can be sure that the reversal has started. Remember this illustration is done in a higher time frame.
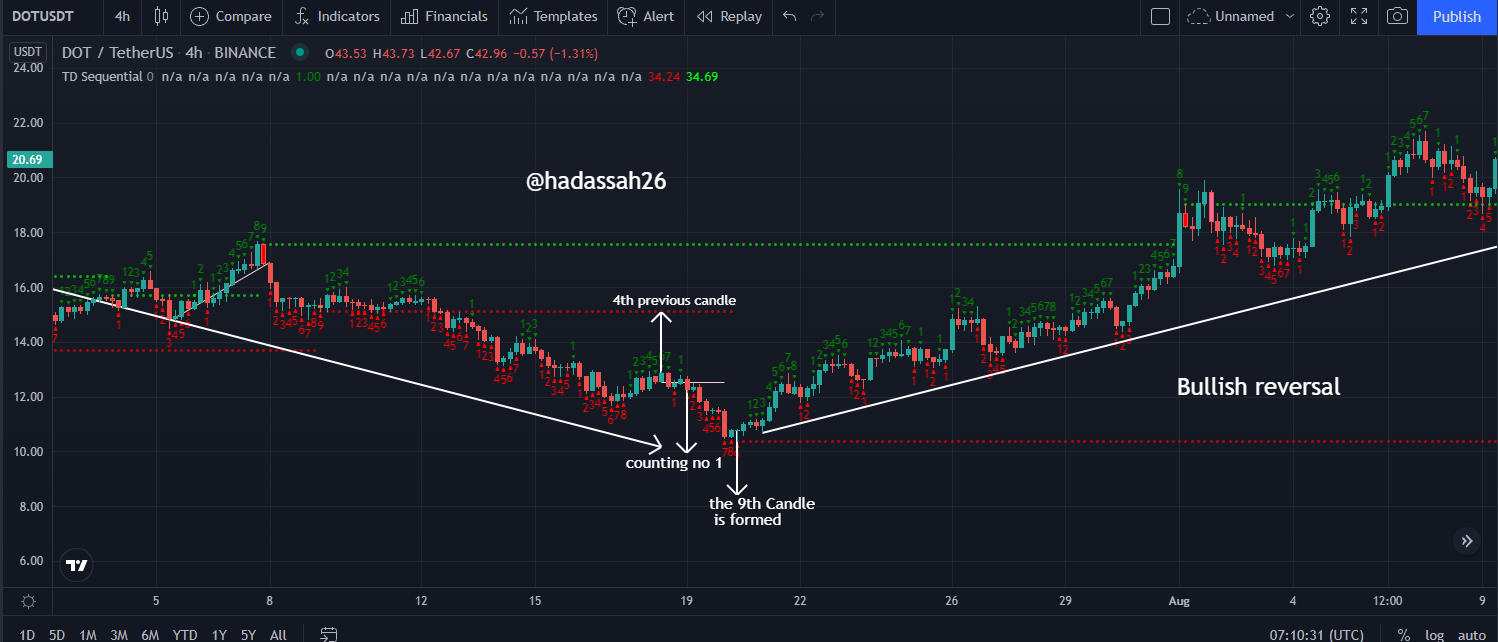
The DOTUSDT in a 4-hour time frame, there was a downtrend, until it got to the number 1 candle, and the number 1 candle is below the close of the 4th previous candle. Then the counting continue until it got to the 9th candle and all these candles were all below that close of the 4th previous candle. At the point of the 9th candle, that is where the bullish reversal started. From the chart, we can see the bullish reversal.
5- Using the knowledge gained from previous lessons, do a better Technical Analysis combining TD Sequential Indicator and make a real purchase of a coin at a point in which TD 9 or 8 count occurs. Then sell it before the next resistance line. (You should demonstrate all the relevant details including entry point, exit point, resistance lines, support lines, or any other trading pattern such as Double bottom, Falling wedge, and Inverse Head and Shoulders patterns.)
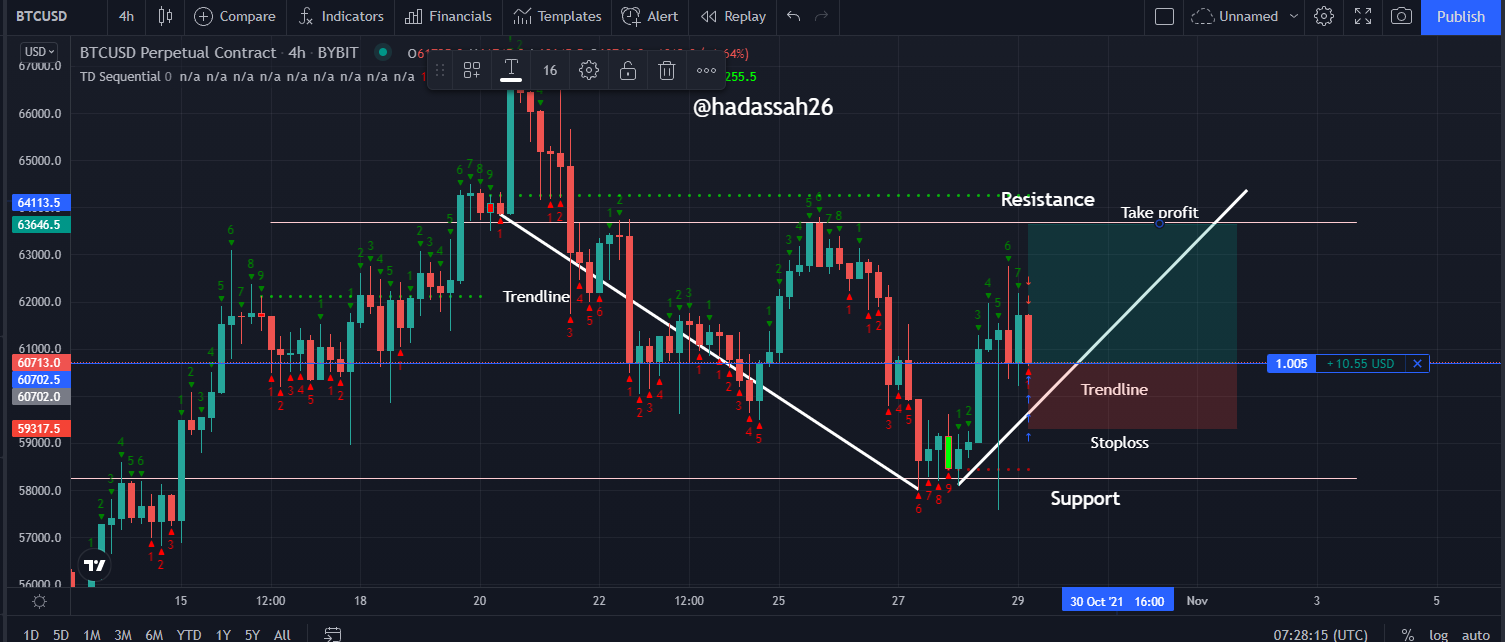
From the chart above of BTCUSD in a 4-hour time frame, I observed a trend reversal using the trendline. It was on a downtrend until it got to major support that made it turn and it switched to an upward trend. And the TD sequential indicator coincide with the support line, this was a confirmation of a buy order. So with this in place, I bought the BTCUSDT and I know that it is going to meet the resistance upward and after that, it is going to reverse. I entered my stop loss immediately just below the upward trendline and with the RIsk to reward ratio of 2:1, that led me to enter a take profit and it is at the point with the resistance. The screenshot will be seen below.
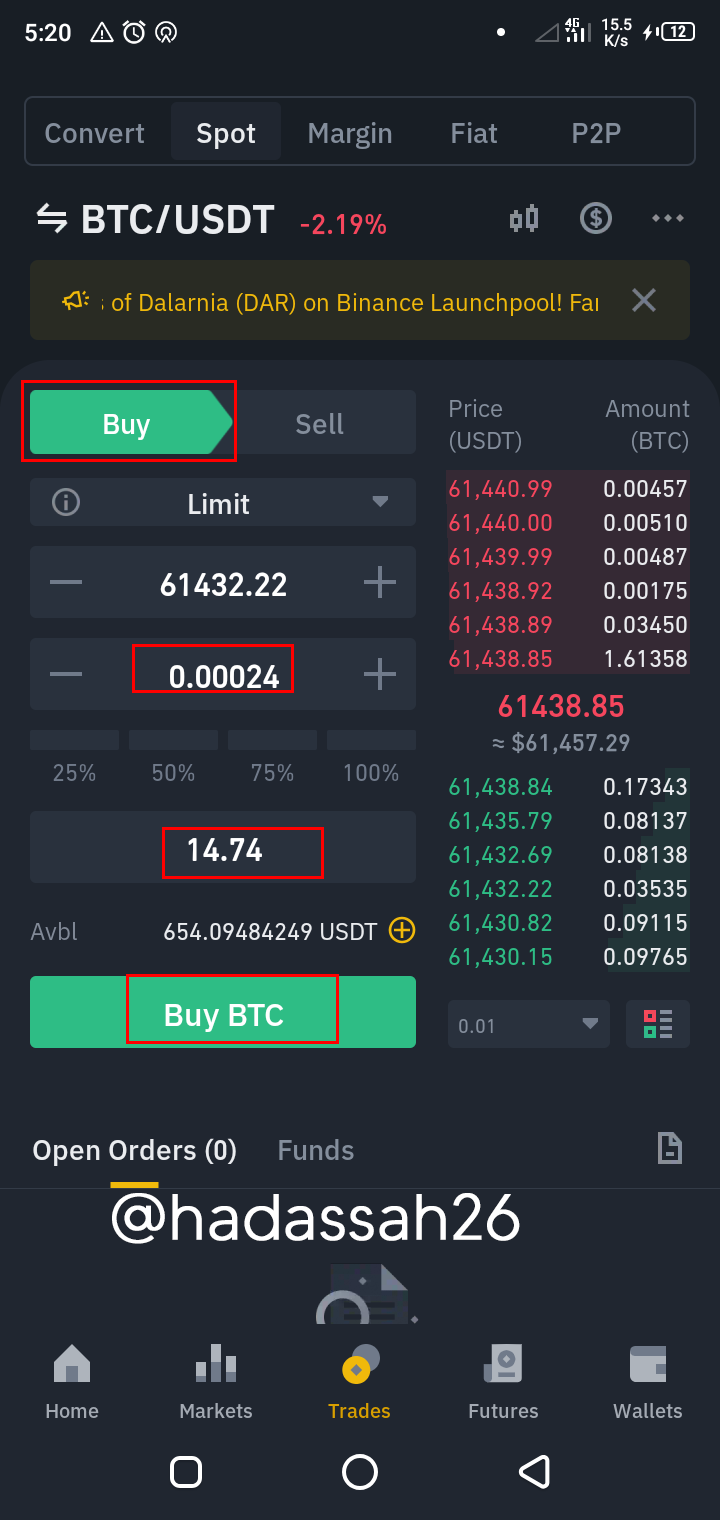
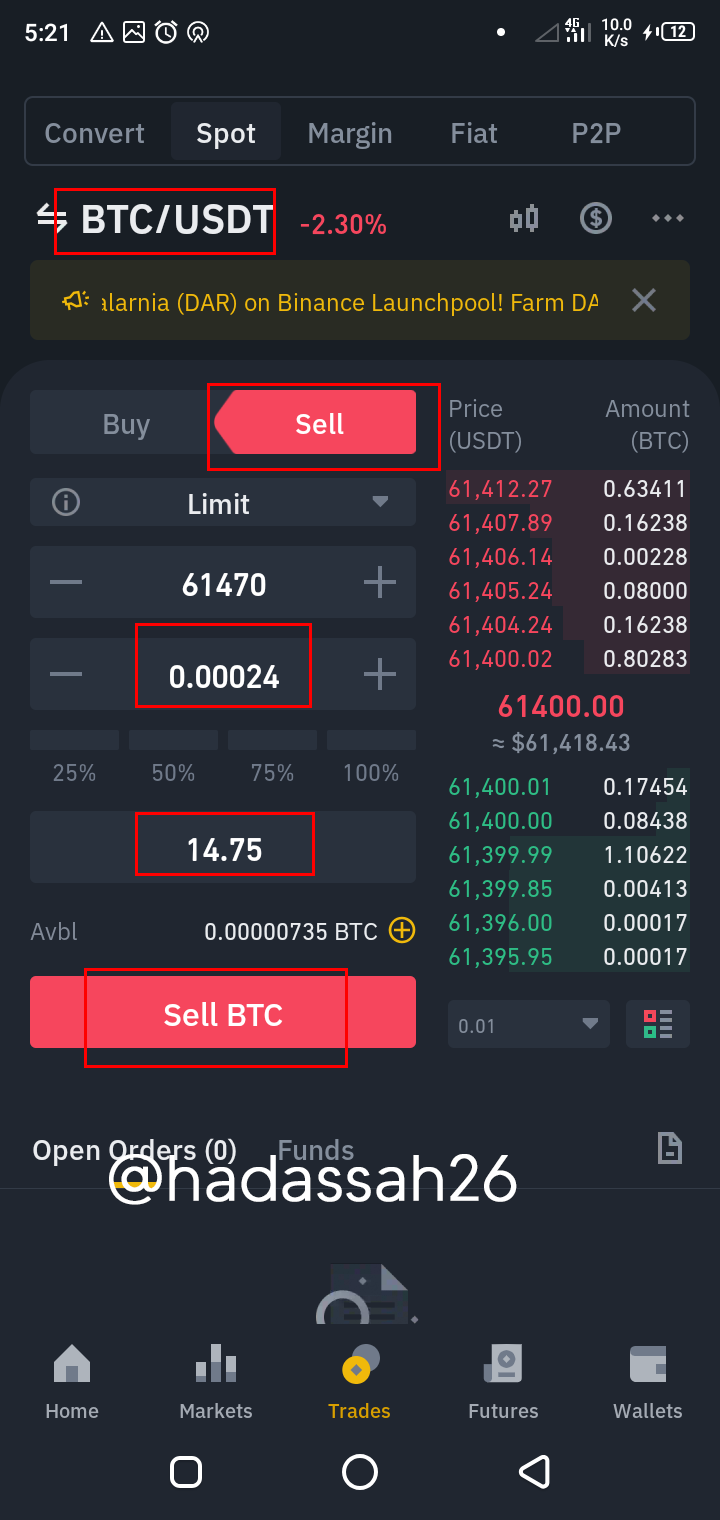
below is a screenshot of I purchased the token in finance on my mobile phone
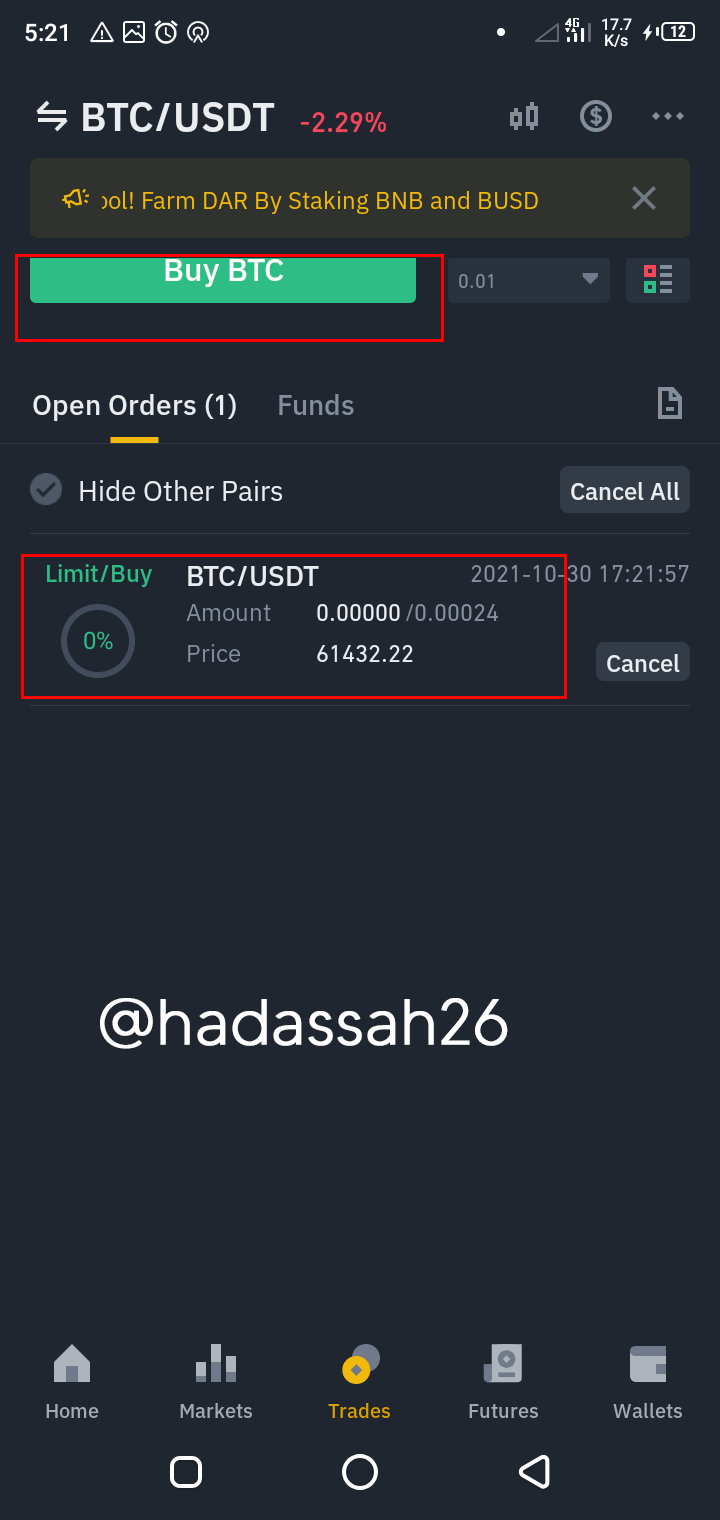
these are the also the screenshots of when I sold used the Binance on my mobile phone
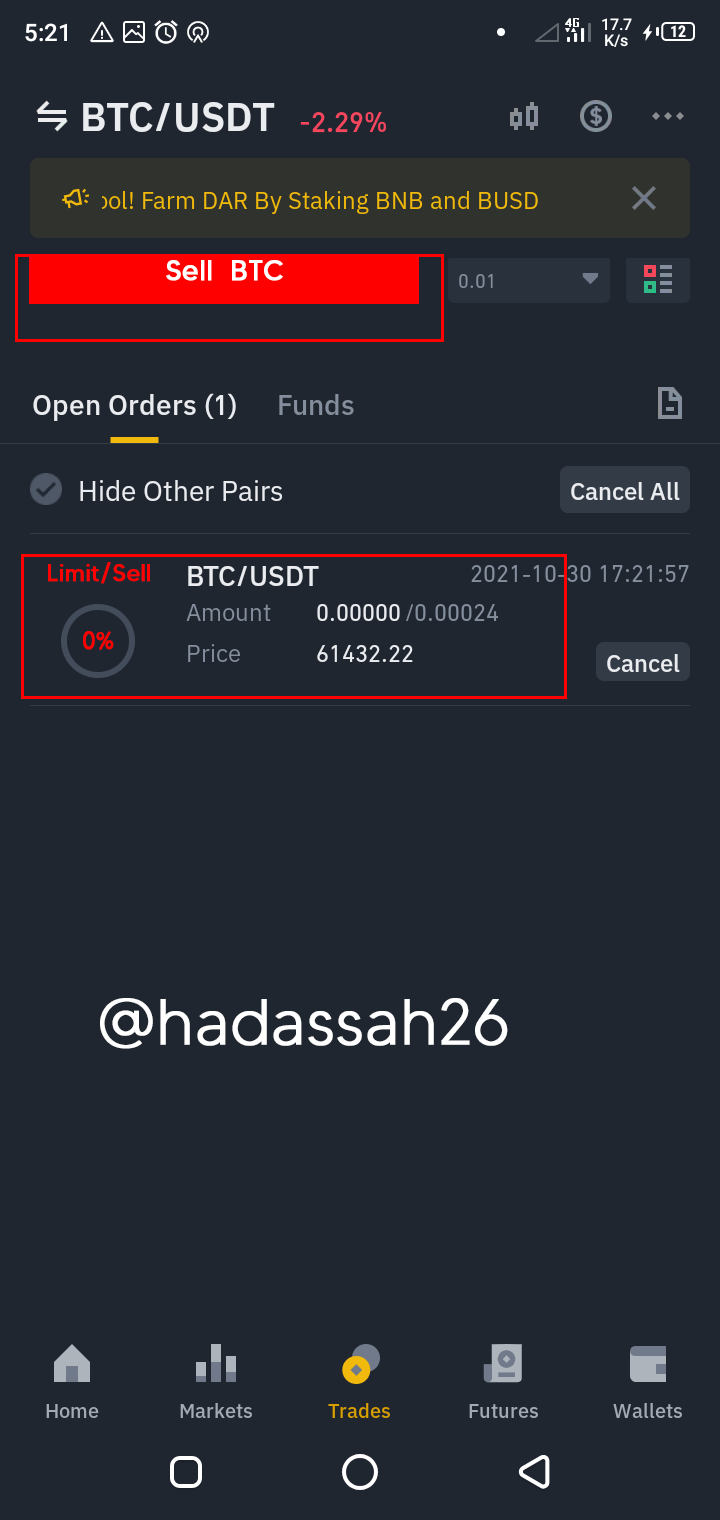
The result of the trade can be seen below

CONCLUSION
In conclusion, all traders are seriously looking for point of reversal in the market, so they make huge profit, and what has caused traders not to get this point is because improper information. The TD sequential indicator has brought enough enlightenment to the current day traders by giving them the exact point of reversal they were looking for all this while. Honestly, this indicator is very nice but you have to study it thoroughly and understand it, in and out. Then in doing so, you can now maximize it full potential. I want to thank professor @reddileep for bringing this topic.
Cc: @reddileep