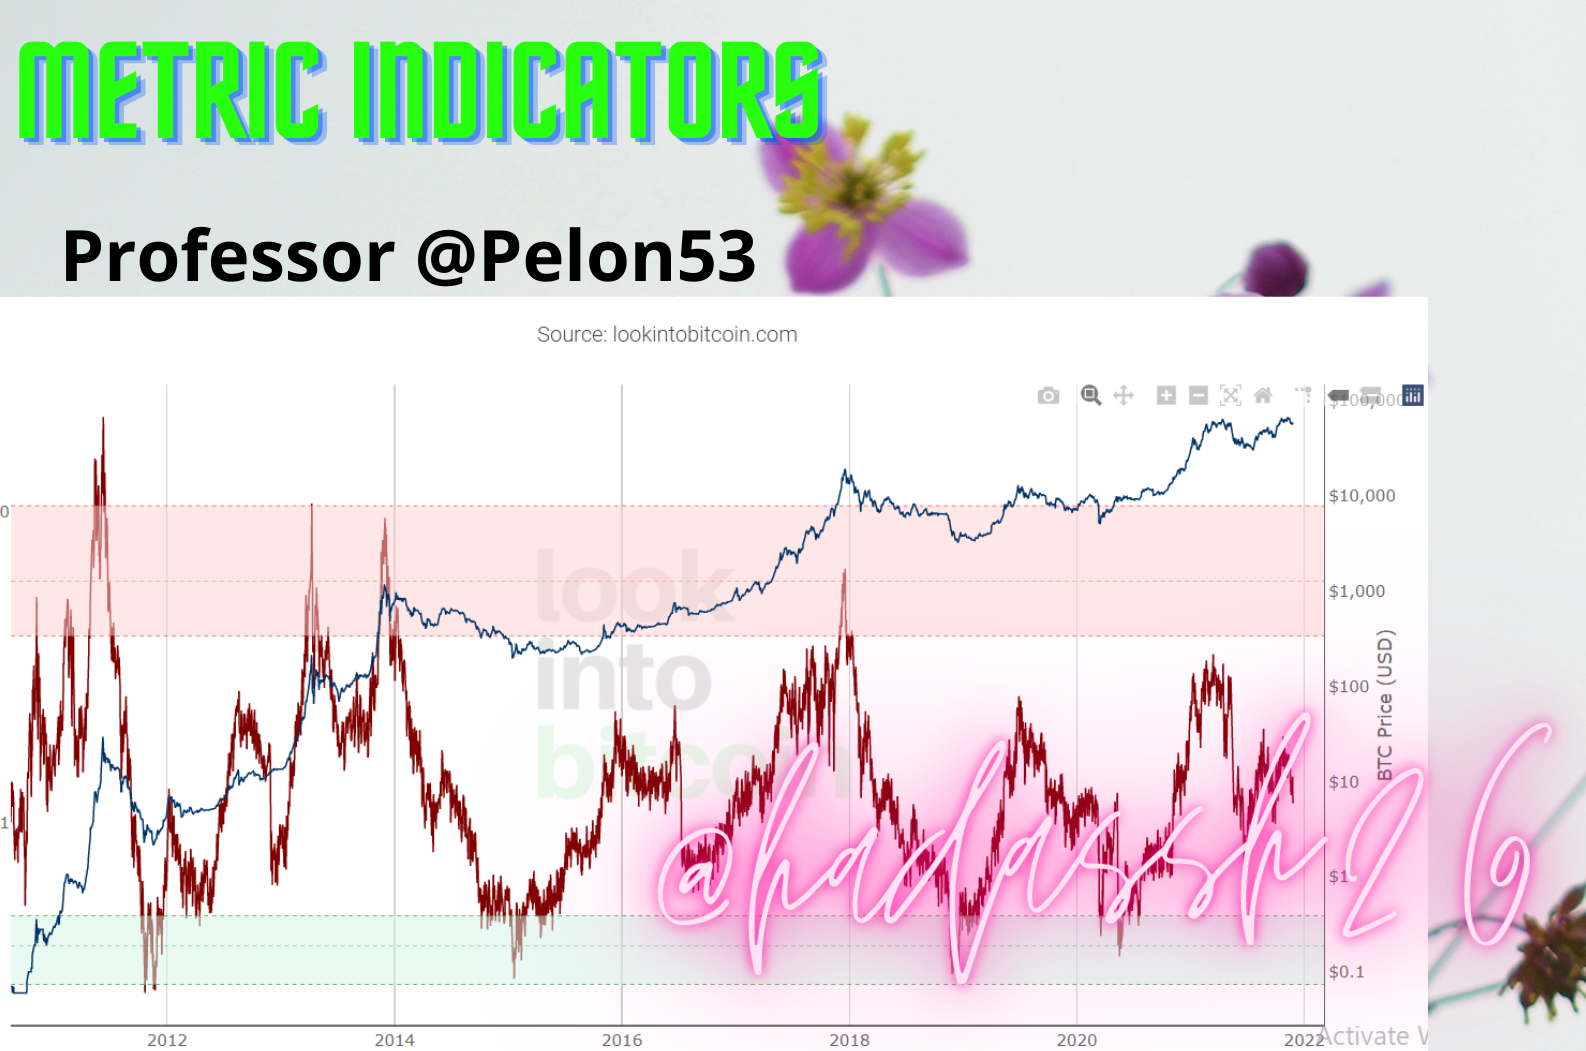
Metric Indicators - Crypto Academy / S5W2 - Homework post for pelon53.
Indicators tell us of the current situation of a currency or an asset, thereby giving us a heads-up on the next direction it should go.
Today we shall be taking a more unconventional approach to the world of indicators and talking about how the hash rate and mining of cryptocurrencies affect the bullish or bearish nature of crypto assets.
Good day beautiful Steemians, welcome to another week, I am @hadassah26 and this is my Steemit crypto academy week 2 season 5 homework for professor @pelon53 on Metric Indicators.
.png)

"1.- Indicate the current value of the Multiple Puell Indicator, of Bitcoin. Perform a technical analysis of the LTC using the Puell Multiple, display screenshots, and indicate possible market entries and exits."
David Puell a crypto enthusiast and financial/on-chain research analyst designed the Multiple Puell indicator from the understanding of the profitability of crypto mining.
Miners gain bitcoin by confirming transactions on every block, which in turn earns them bitcoin with the whole process known as mining.
Like every successful business, they run their expenses with profits gained from mining which is not some little money, but with the ever-fluctuating price of the bitcoin regardless of the constant mining cost, miners are sometimes forced to sell their mined bitcoin so as to cover the cost sometimes causing an over sell, and soon causing an undervalued position as compared to the average annual price.
On the other hand, the price of the bitcoin may start becoming profitable for miners, they start accumulating to sell at a higher price. When the price is seen to be overvalued, a sell sentiment circulates around the market. Investors also sell off their held bitcoin catching some profits before the price turns around to a new bearish trend.
The Multiple Puell indicator tells us of the current profitability of mining as compared to the yearly average profitability.
Designed in a way to notify miners and now traders of the relative profitability of crypto mining by the use of two stripes.
• A green stripe which is located below the indicator page, with a height of 0.1 to 0.5 of the total indicator page height.
• A red stripe which is located above the indicator page, with a height of 4 to 10 of the total indicator page height.
When the indicator line is on the green stripe, it is a good buy signal as the mining is considered relatively not profiatble and so price is considered undervalued. So also when the indicator line is on the red stripe, it is a good time to sell as mining has become very profitable, and price is becoming over-valued.
Investors can now make more value from trading their cryptocurrencies by knowing when to buy and when to sell off their cryptocurrencies relative to mining profitability.
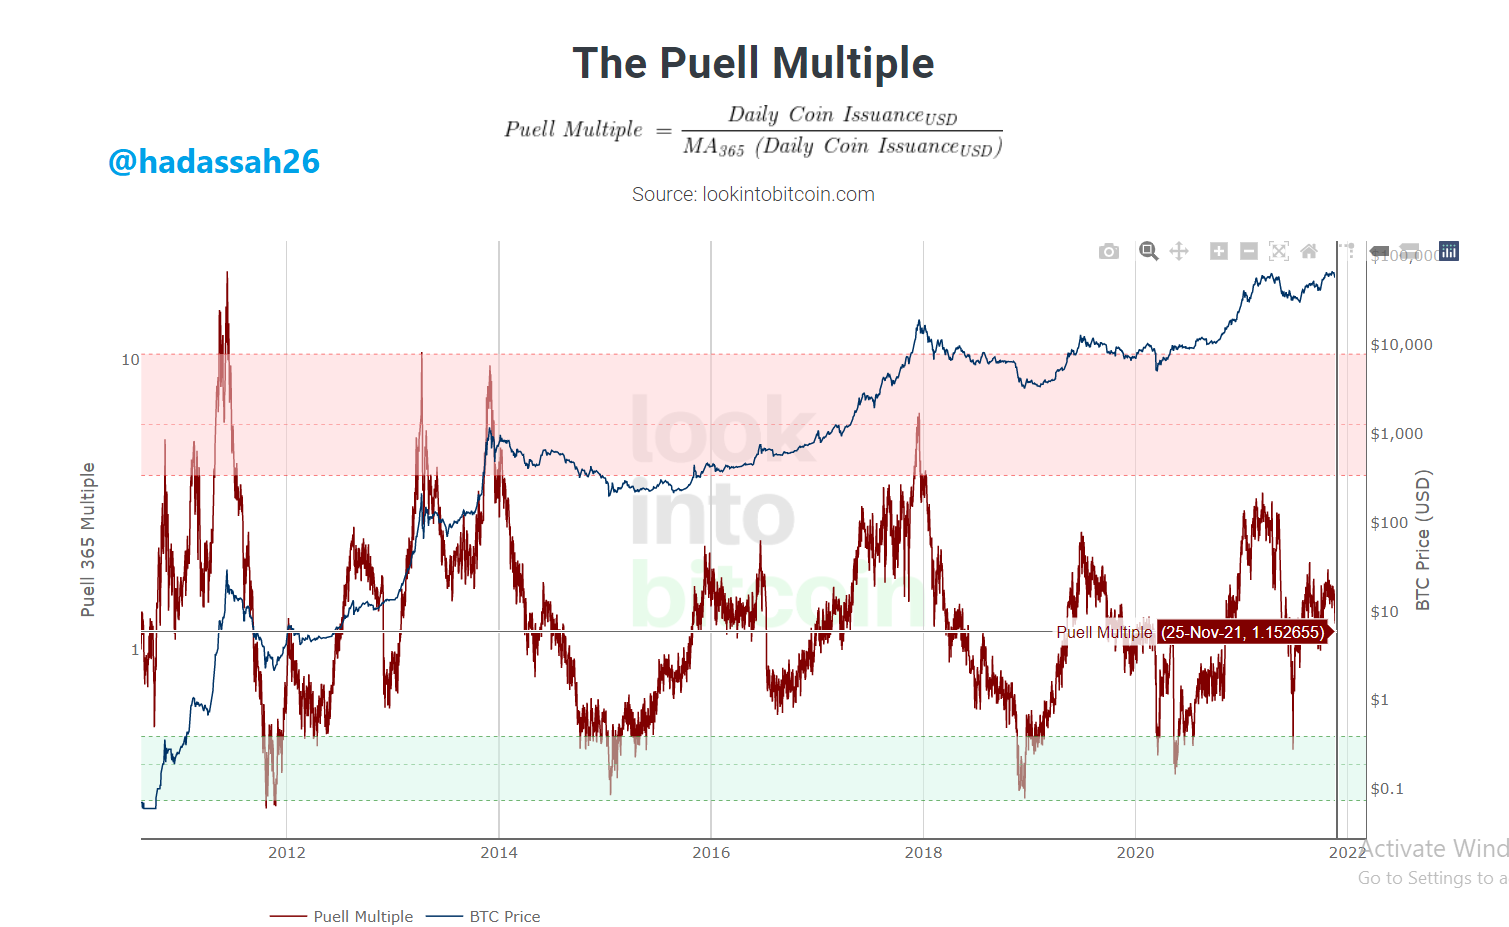
Looking at the current Value of the Puell indicator for the Bitcoin it is currently at 1.152655 (chart below)
.png)
This tells shows that the relative profitability of bitcoin mining is reducing according to the indicator relative to this year's average profitability.
Analyzing the LTC/USDT using the Multiple Puell Indicator, using the giving time period from glassnode.com, we can see that the price of the LTC is positively correlated to its Multiple Puell indicator, taking instances,:
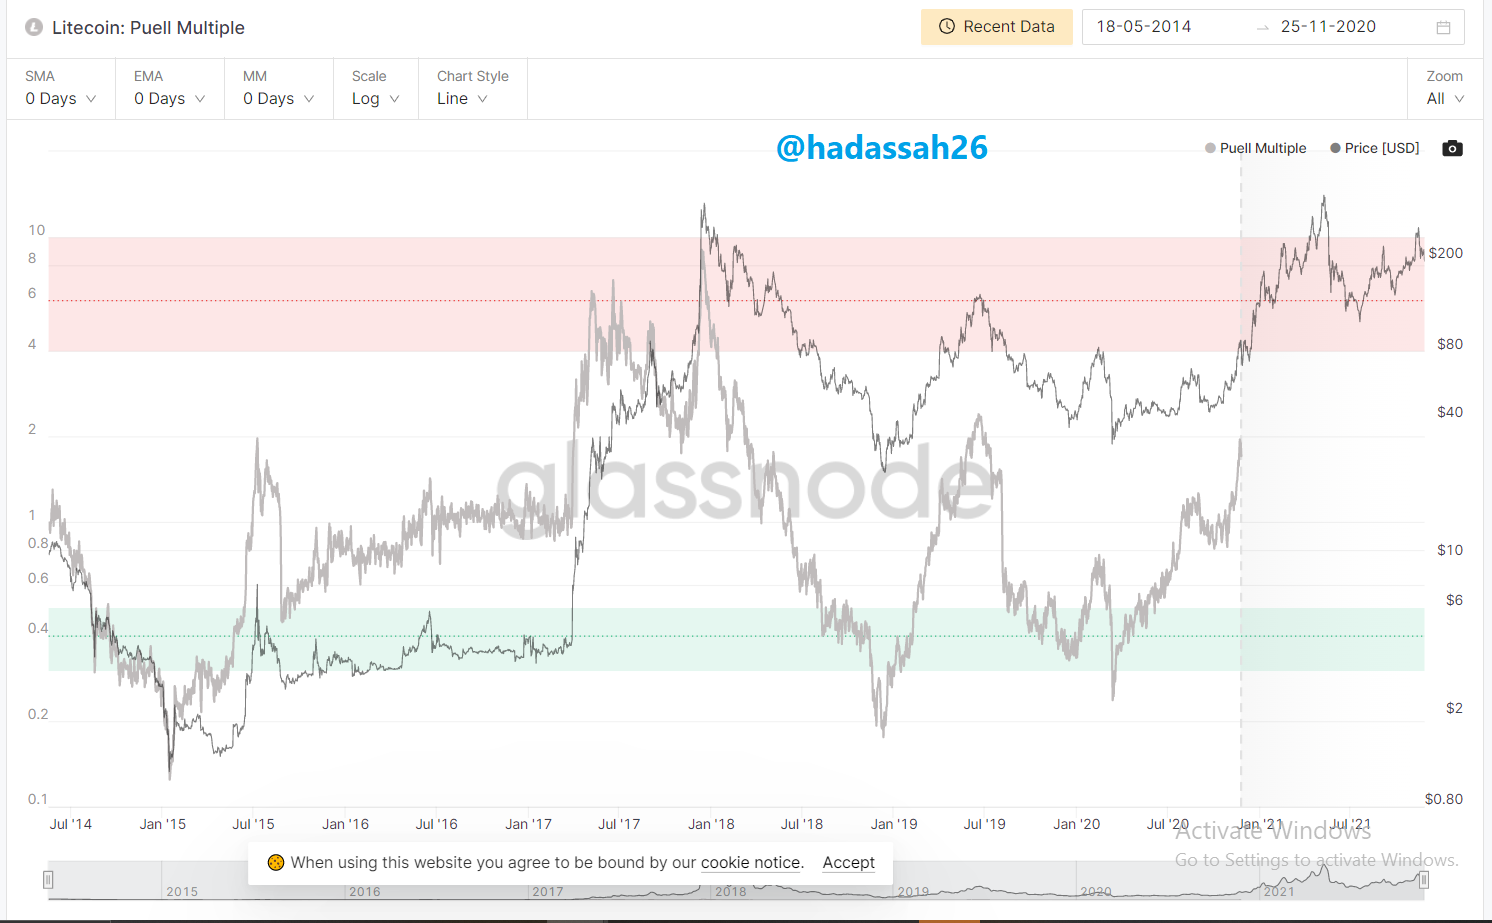
Using the Multiple Puell Indicator for the LTC (Lite coin), we can see that the LTC confirms to its signals which are best for long positions.
With the LTC and Multiple Puell Indicator correlating, we can check the dip as at the 18th of March 2020, the Puell indicator had reached and even broken the greeen strip, a strong signal of price non profitability and need for a reversal. Traders took advantage of this and spiked back price, gaining as it trended back up.
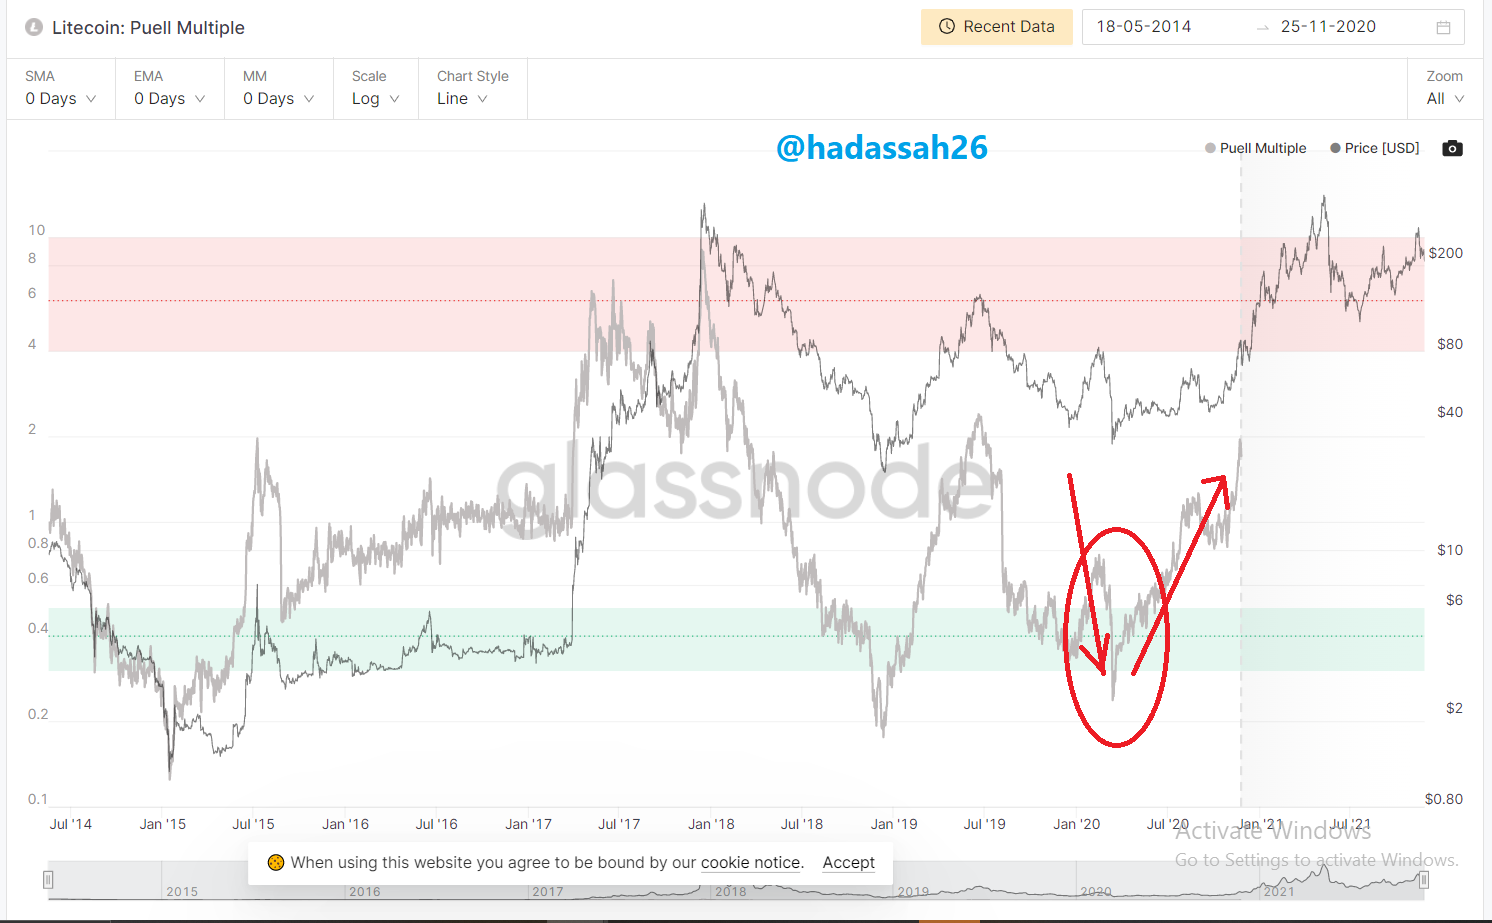
Finding the entry point into a cryptocurrency using the Multiple Puell Indicator is simple as we only have to search for points where the indicator meets either the green or red strip.
When the indicator meets the green strip, it is a good time to buy in as the cryptocurrency is considered "under-valued".
So also, when the indicator meets the red strip, it is a good time to sell as it has become too profitable to miners, it is now considered "over-valued"
Example of these areas are shown in the chart below:
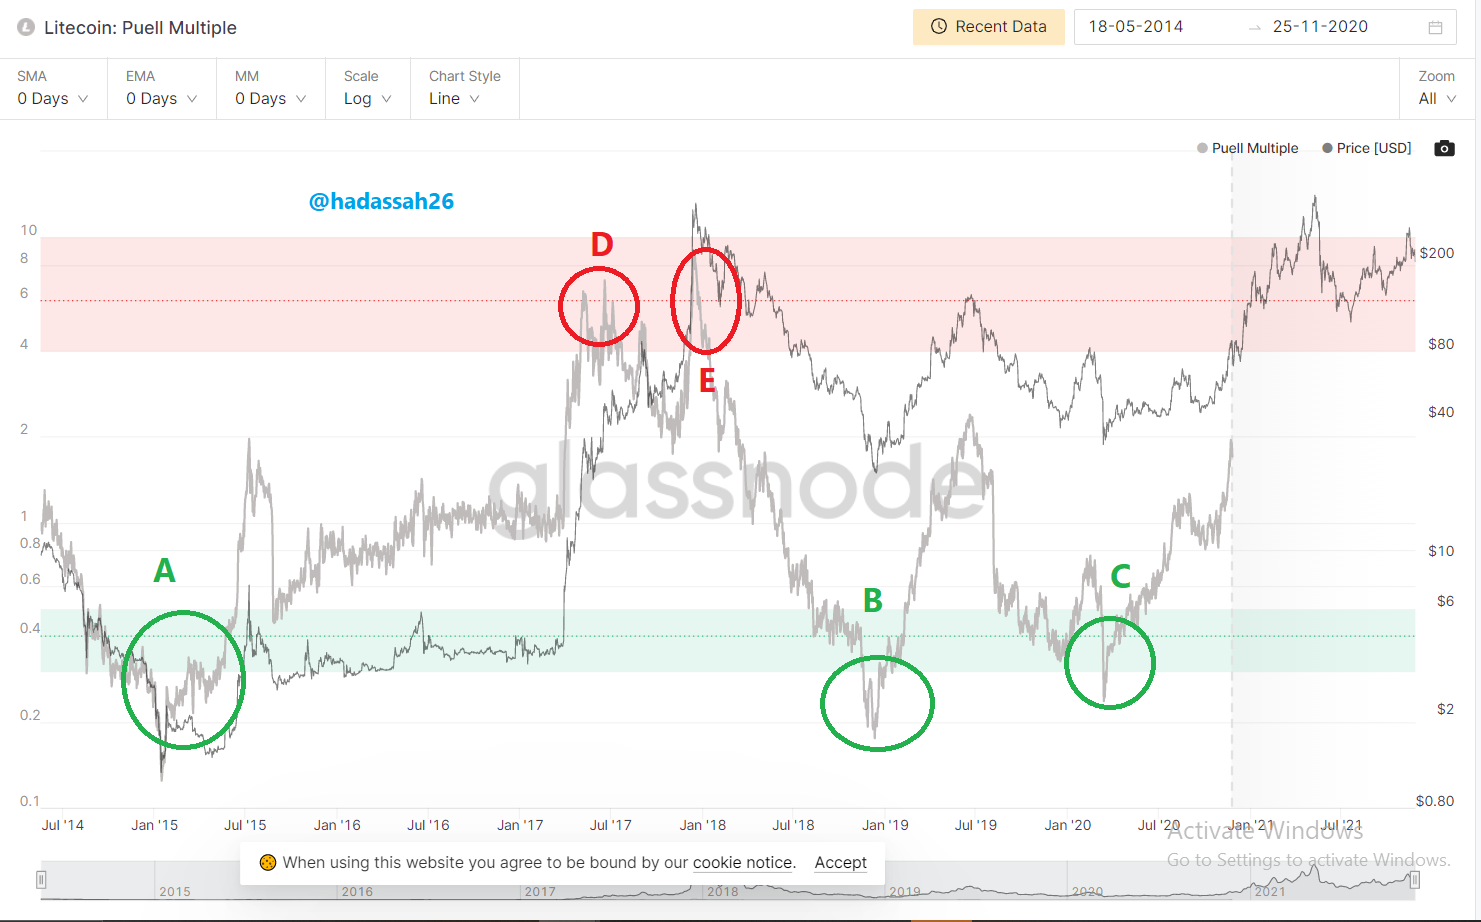
From the chart above, we can see that the points "A", "B", and "C" are good entry points, then points "D" and "E" are good exit points.
"2.- Explain in your own words what the Halving is, how important the Halving is and what are the next reward values that the miners will have. When it would be the last Halving."
Scarcity is a major determinant of value. If everyone had easy access to gold, it would no longer be gold, but rather sand. The scarcity of an item or asset makes it more valuable, so also the excessiveness of an item makes it valueless.
In the creation of the bitcoin, its creators (Satoshi Nakamoto) knew that if everyone had bitcoin, it would rather be a crypto item instead of a valued currency, that is why they put a cap on the total amount of bitcoin that was ever going to be produced and more keep reducing the amount of bitcoin given to miners as reward for confirming transactions so as to reduce the amount of bitcoin in circulation.
Definition Halving
Halving is the process of reducing the amount of a crypto currency in circulation through the reduction of rewards given to its miners by half so as to reduce inflation, and increase its value.
Other crypto assets undergo halving in other ways such as burning, or a gradual deflationary measures.
As described above, Halving is important as it is majorly to reduce the over circulation of a cryptocurrency therefore curbing over supply which causes drop in price.
The bitcoin halving takes place after every 210,000 Blocks, approximately after every four years, with the next halving period being on the 26th of March 2024 and the last halving going to take place in the month of February 2140.
"3.- Analyze the Hash Rate indicator, using Ethereum. Enter the current value of the Hash Rate. Show screenshots."
Cryptocurrencies are a means of financial transaction, and so have to be produced in a way that proves worth. This means that the production of cryptocurrencies should not just be like manner from the heavens, but should be earned from a reasonably worthy means of production.
The method of production of cryptocurrencies is called mining. Mining is different for different cryptocurrencies depending on their consensus algorithm. The consensus algorithm of Ethereum is the proof of stake, which involves individuals putting their physical cash into the system to produce the Ethereum which can now be exchanged for other cryptocurrencies.
The Ethereum proof of stake mining has grown over the recent years as more people stake their money to invest in either the Ethereum or convert them to other cryptocurrencies.
The Hash rate indicator gives us a detailed idea of the amount of stakes that go on the Ethereum blockchain called hashing.
Looking at the hash rate indicator chart below, we can see that the current hash rate is at 798 Tera hash per second.
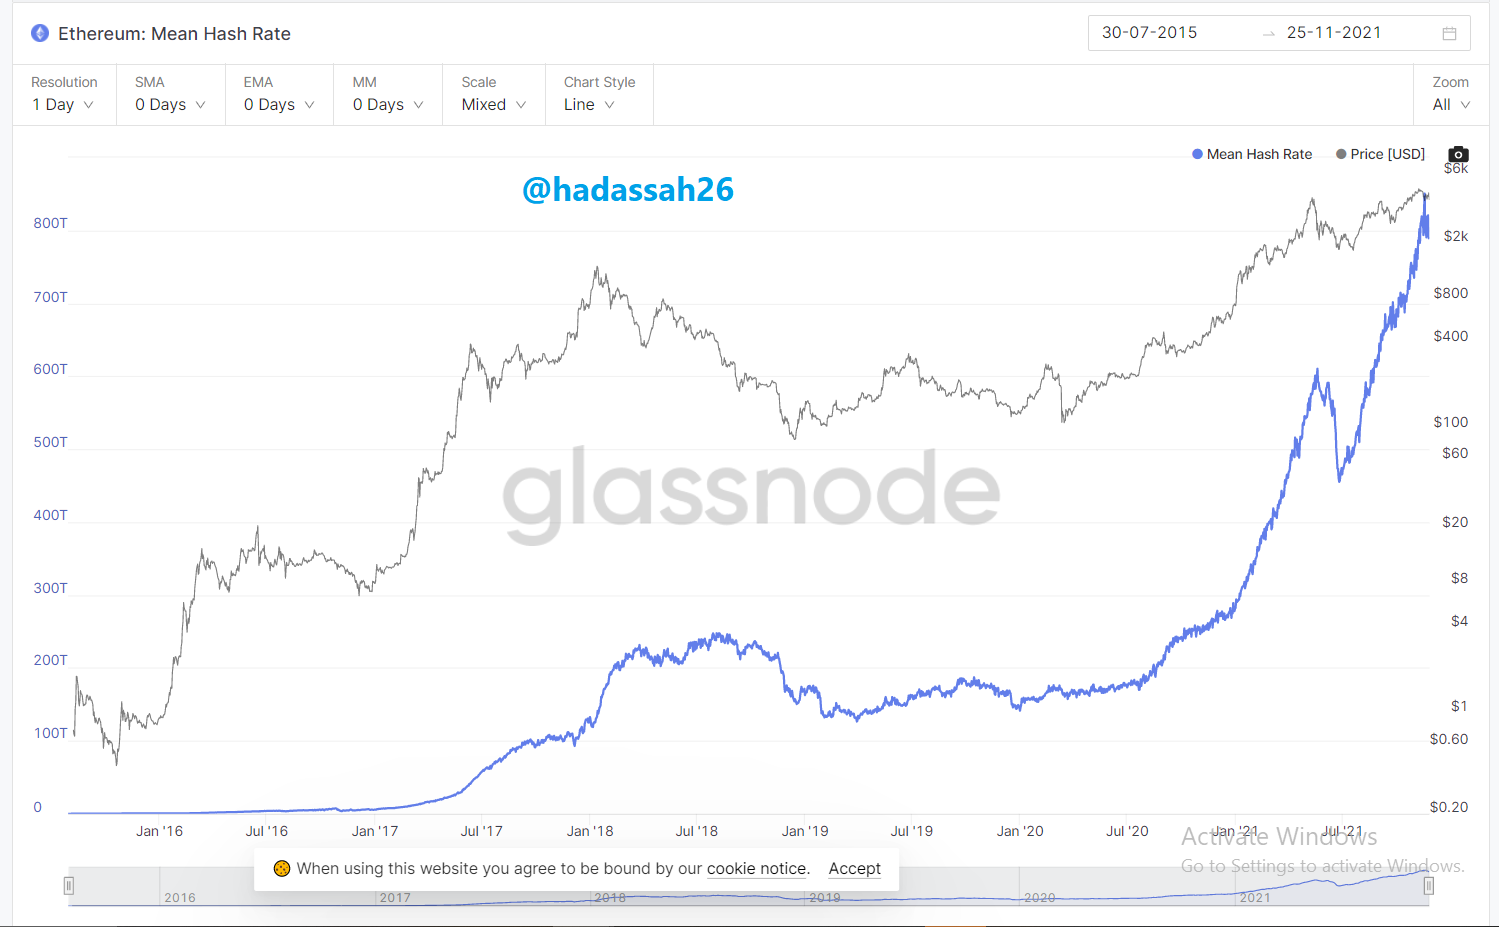
An increment in the hash rate shows promise on the price of the Ethereum and so the hash rate indicator can be used to predict the price movement of cryptocurrencies.
"4.- Make the calculation of Stock to flow current model. Explain what needs to happen in the next Halving with the Stock to Flow. Calculate the Stock to flow model for that date, keeping in mind that the miners' reward is halved. Show screenshots."
Stock flow is the amount of a currency or asset in circulation divided by its current rate of increment. The idea of stock flow is to measure how much of a valuable item is in circulation, so one can find its relative value.
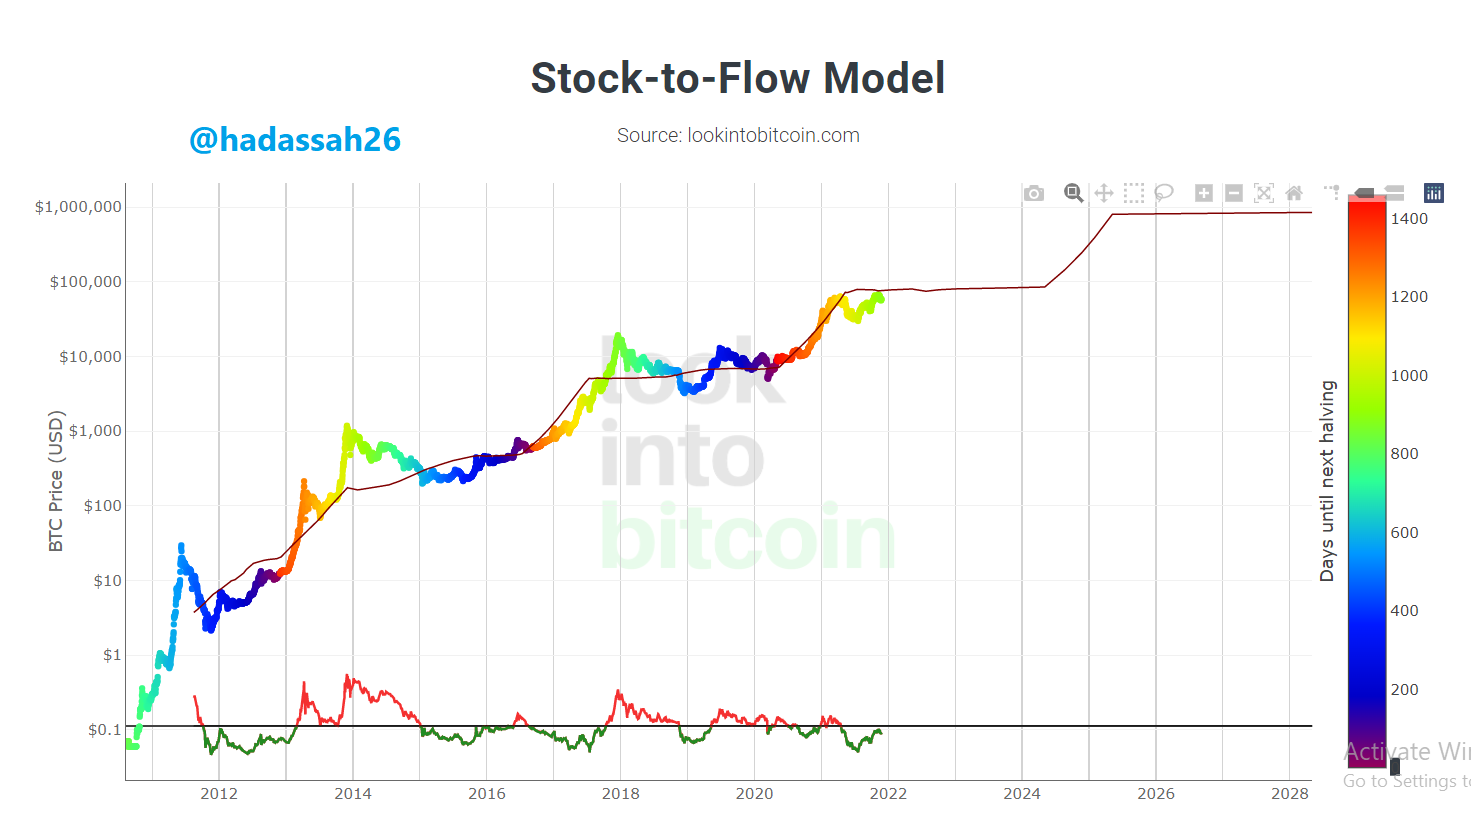
To calculate the stock flow of bitcoin we have to get the total amount of bitcoin in circulation, calculate for the current yearly increment, divide the former by the later (stock flow), then compute the Stock flow model.
Where the Stock flow model of bitcoin can be computed as 0.4*SF(Stock flow)^3.
Where Stock flow can be calculated by:
Finding the current bitcoin in circulation = 18,881,962.5 from source.
Calculating for the current yearly increment(considering the last halved period) = 6.25 BTC per Block * 52,560 Blocks per year = 328,500 BTC per Year.
Therefore, Stock Flow = 18,881,962.5/328,500 = 57.48
The Stock flow model = 0.4 * (57.48^3) = 75,964.42
Explain what needs to happen in the next Halving with the Stock to Flow
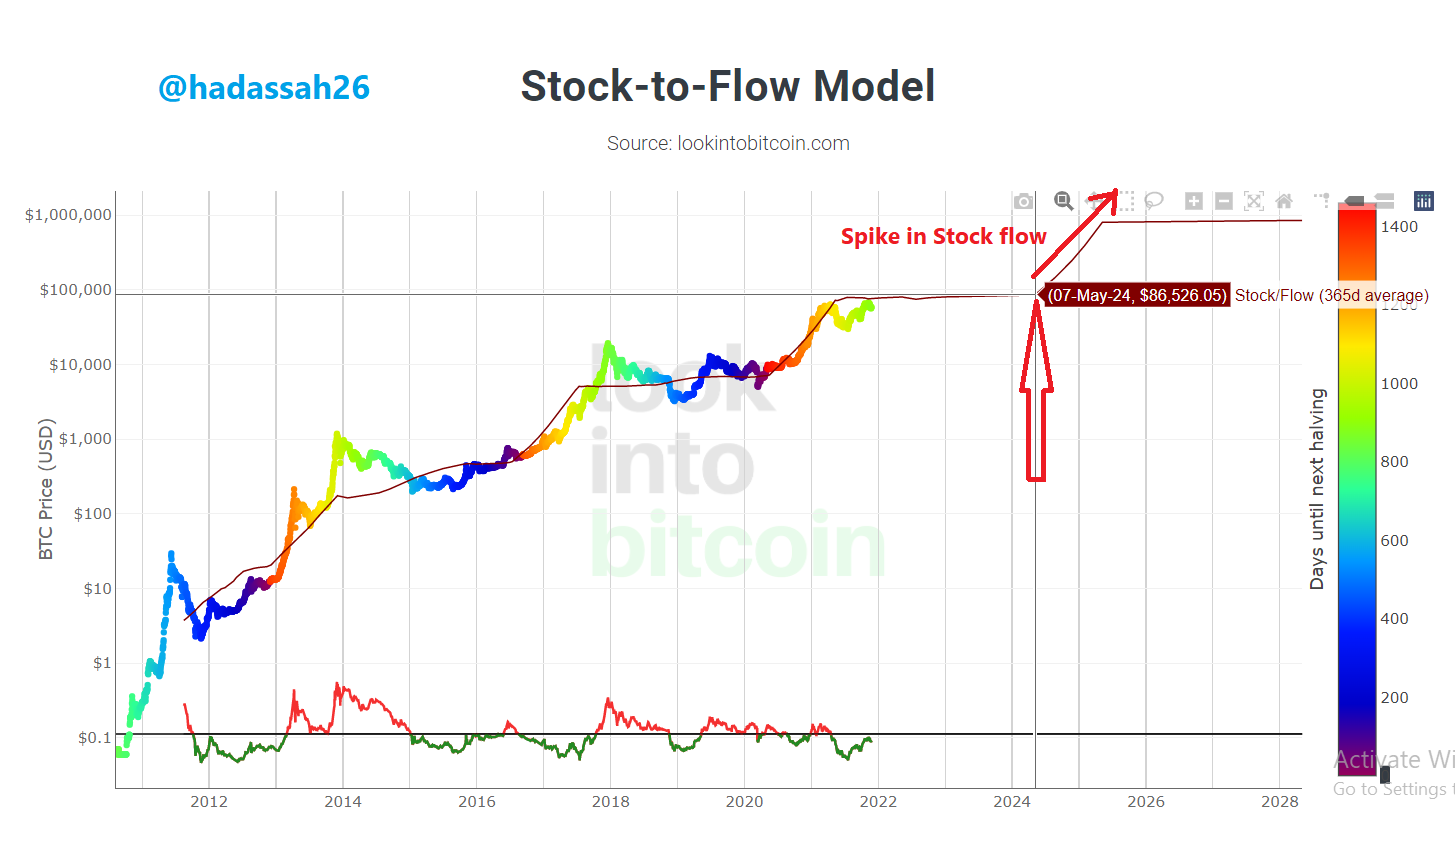
During the next stock to flow, the yearly input rate of bitcoin into the system quickly drops, causing the result of the qoutient of the total bitcoin in circualtion and the current yearly input to increase rapidly causing a rather positive gradient stock flow index.
.png)
As seen from the chart above, the stock flow increases, due to the rapid reduction of the yearly increment.
Calculate the Stock to flow model for that date, keeping in mind that the miners' reward is halved
Calculating the next stock flow date, we first have to calculate how many bitcoins will be in circulation during that time:
Bitcoins in circulation by the next halving:
The next halving being on the 26th of March, 2024, we sum the current bitcoins produced by the number of bitcoins produced within that time:
Current bitcoins in circulation: 18,884,006.25 from source
Number of bitcoins to be mined before March 26th 2024 = Number of blocks produced between today and March 26th * Number of bitcoins per block.
Calculating number of blocks to be produced, we calculate the block production time between today and March 26th.
With 10 minutes being the block production time for bitcoin, therefore, number of blocks to be produced = 851 days between today and March 26th divided by 10 minutes. = 122,544 blocks to be produced between now and 26th March.
= 122,544 * 6.25 BTC per block
= 765,900 Bitcoins to be mined between now and the next halving.
Summing = 18,884,006.25 + 765900 = 19649906.25 Btc to be mined between today and 26th March 2024.
Getting the Stock flow at 26th March, = 19,649,906 / (3.125*52,560)
= 119.634130898
Stock flow model = 0.4 × sf ÷ 3
= 0.4 ×119.634130898 ÷ 3 = 15.951217453
= Approximately 16.
Analysing the crypto market from its roots is a good fundamental study.
The Multiple Puell Indicator should be used by every crypto miner and even traders, as it makes one understand the root cause of price fluctuations.
The Hash Rate and Stock flow Model indicators are also great Metric indicators and also should be applied cautiously.
Thanks to professor @pelon53 for this wonderful lecture. it has introduced me to a new dimension of trading and crypto analysis.
CC @pelon53