Onchain Metrics Part-3 (GIOM, Adjusted Large Transaction Volume)- Steemit Crypto Academy- S5W5- Homework Post for @sapwood

In the market, traders are buying and selling different assets every second of the day. And as the buying and selling occur, these lead to different changes in the price of the asset in the market. It may even lead to the formation of a different chart pattern that has stayed over a long period. In time, Some traders hold the price of the asset with a huge amount of asset, and these, in turn, play an important role in the formation of the charts in the market.
Global In/Out of the Money (GIOM) is a method used on the on-chain data, in which so many prices are recorded of a particular asset, of where that asset was bought and at that moment where the asset was bought and held is also recorded, with their addresses, with these happening with time, it forms a cluster which is used to make it easy for that price range. The GIOM is used to check if that address that is held for any assets is making a profit or losing it. The GIOM is made up of many clusters. Let look for an example now.
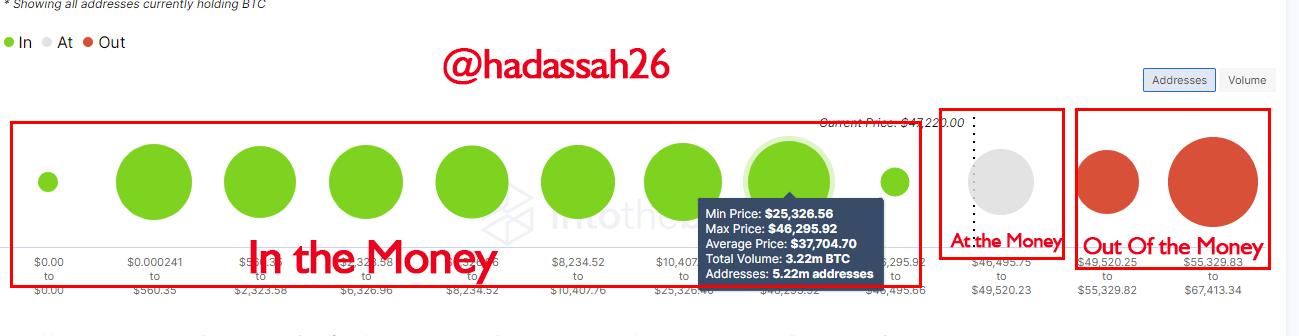
From the chart above, that is an example of GIOM cluster, with a total volume of 3.22 million BTC which has been held for some time, it has held by 5.22 million addresses, and the max price of the BTC that is being held is $46,205 and the min price that is being held is $25,326.56 with an average price of $37,704.70.
Cluster is formed from the constant holding of price around a particular region, from the above chart, the cluster is formed between the maximum and the minimum price of the BTC that is being held. Which ranges from $46,205 and $25,325. The maximum of the Range can also serve as the resistance while the Minimum of the Range of the BTC can also serve as the Support. The GIOM is a fundamental indicator which can be used to determine the Support and the resistance in the market at any time frame
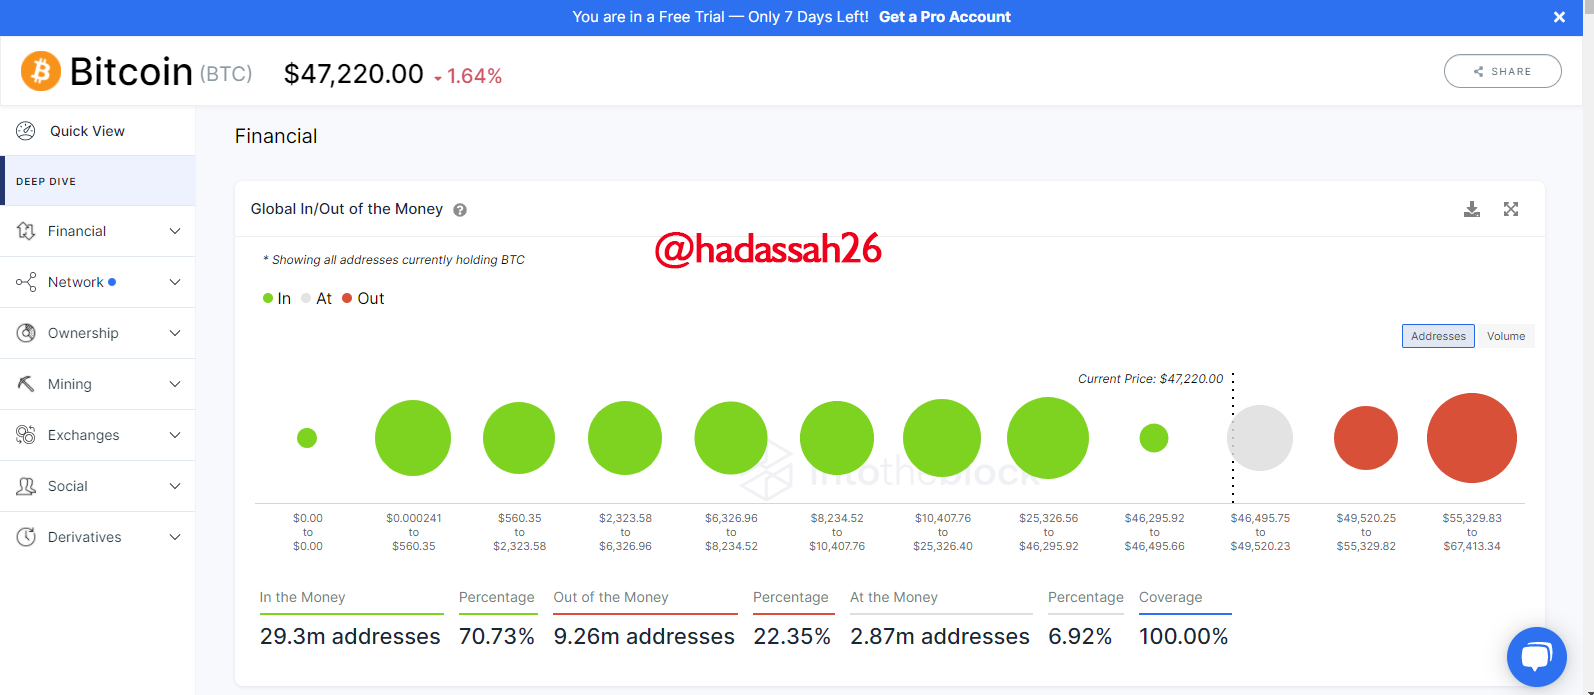
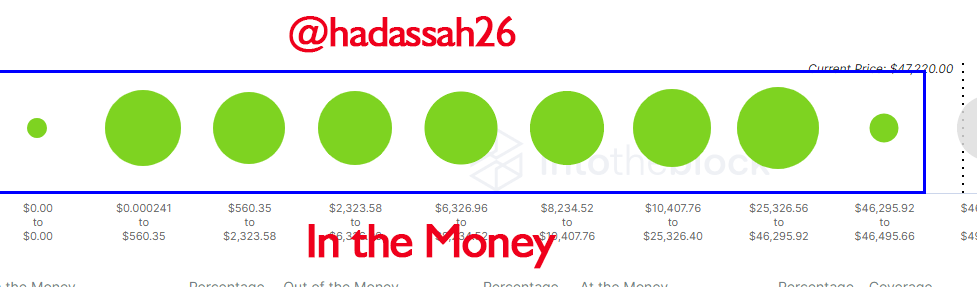
In The Money (ITM): Which also means In The Money. ITM is used when the price of the asset is bigger than the maximum range of the present cluster. This simply means that the cluster is in the Money (ITM). for example, from the above chart that the range varies from $46,205 to $25,325. if the current price of the asset is $50,867, then you can say it is In The Money(ITM). This affects the size of the cluster. Currently, it has 29.3 million addresses which is an equivalent of 70.73% is current In The Money.
At The Money(ATM): In the Situation, if the current price of the asset is equal or falls within the range of the cluster then it can be said to At the Money (ATM). for example, from the above chart that the range varies from $46,205 to $25,325. if the current price of the asset is $36.867, then you can say it is In At The Money(ATM). This affects the size of the cluster. Currently, it has 2.87 million addresses which is an equivalent of 6.92% is current At The Money.
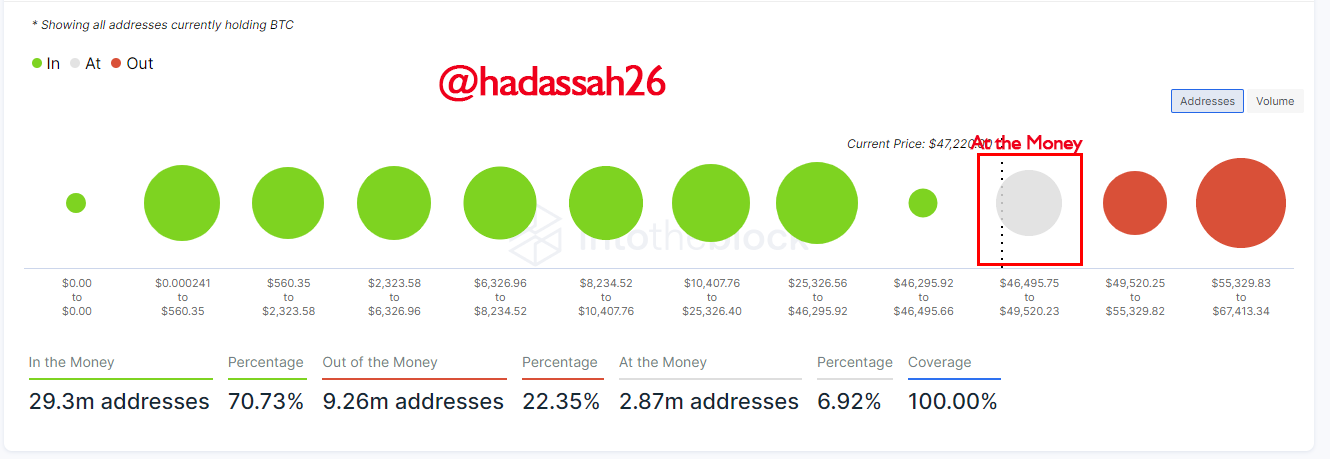
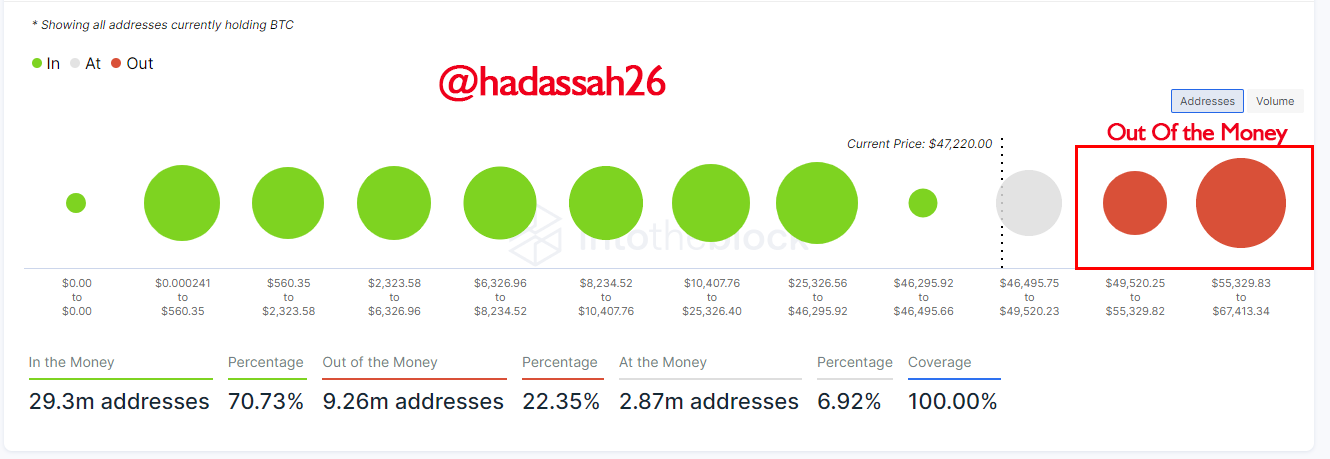
Out of the Money(OTM): In this Situation, if the current price of the asset is lesser than the range of the cluster then it can be said to Out of the Money (ATM). for example, from the above chart that the range varies from $46,205 to $25,325. if the current price of the asset is $16,867, then you can say it is In Out of The Money(OTM). This affects the size of the cluster. The more the size, the larger the effect it will have on the Resistance Currently, it has 9.26 million addresses which is an equivalent of 22.35% is current Out Of The Money.
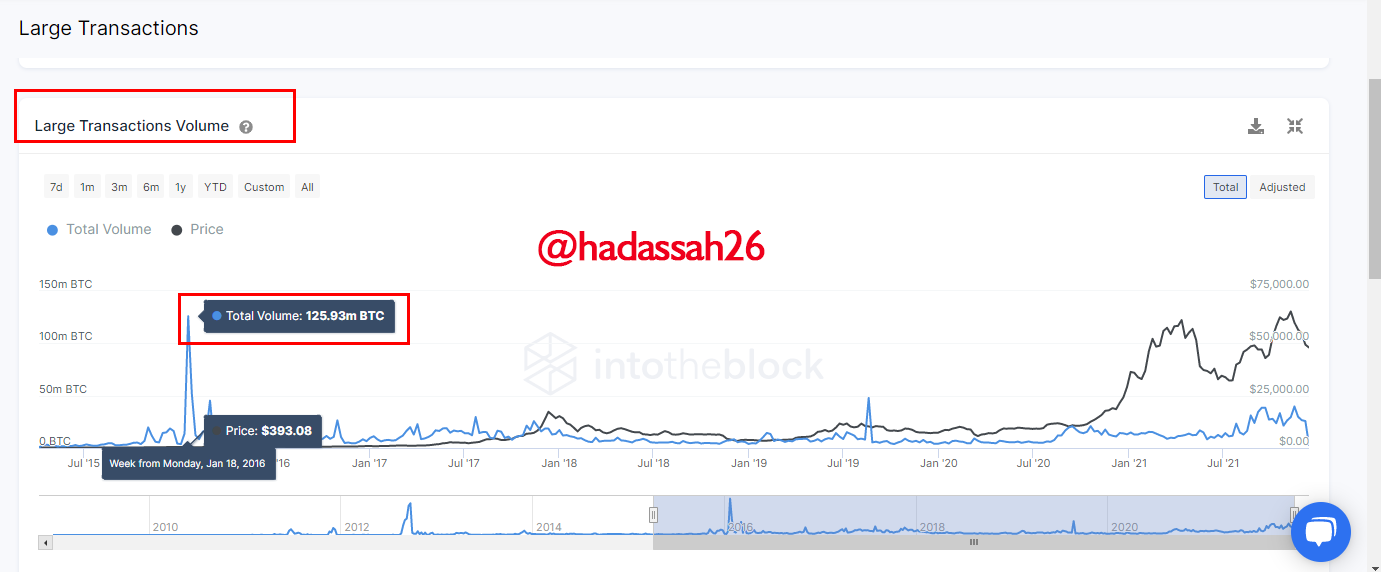
The large Transaction Volume indicator is another wonder that is found on the On-chain metric platform which job is to check for every transaction that is greater than $100k. The large Transaction volume indicates that a whale has entered the market or a big financial institution like the banks or others has also entered the market.
The large transaction normally brings all the transactions which are greater than the $100k, and it uses it to plot a graph as either total or adjusted. Most of the time, the whales or the big financial institutions normally buy or sell in the market.
The Total large transaction most times produces misleading results, such that one address can make more than two transactions, which the total large transaction, will just record. But the Adjusted transaction filter, the transaction by checking the address and verifying them one at a time.
From the chart above, you can see that spike is 125.05 million BTC at a $393.08 level
In this question I will be using the Ethereum asset on-chain metric:
Global In/Out Money:
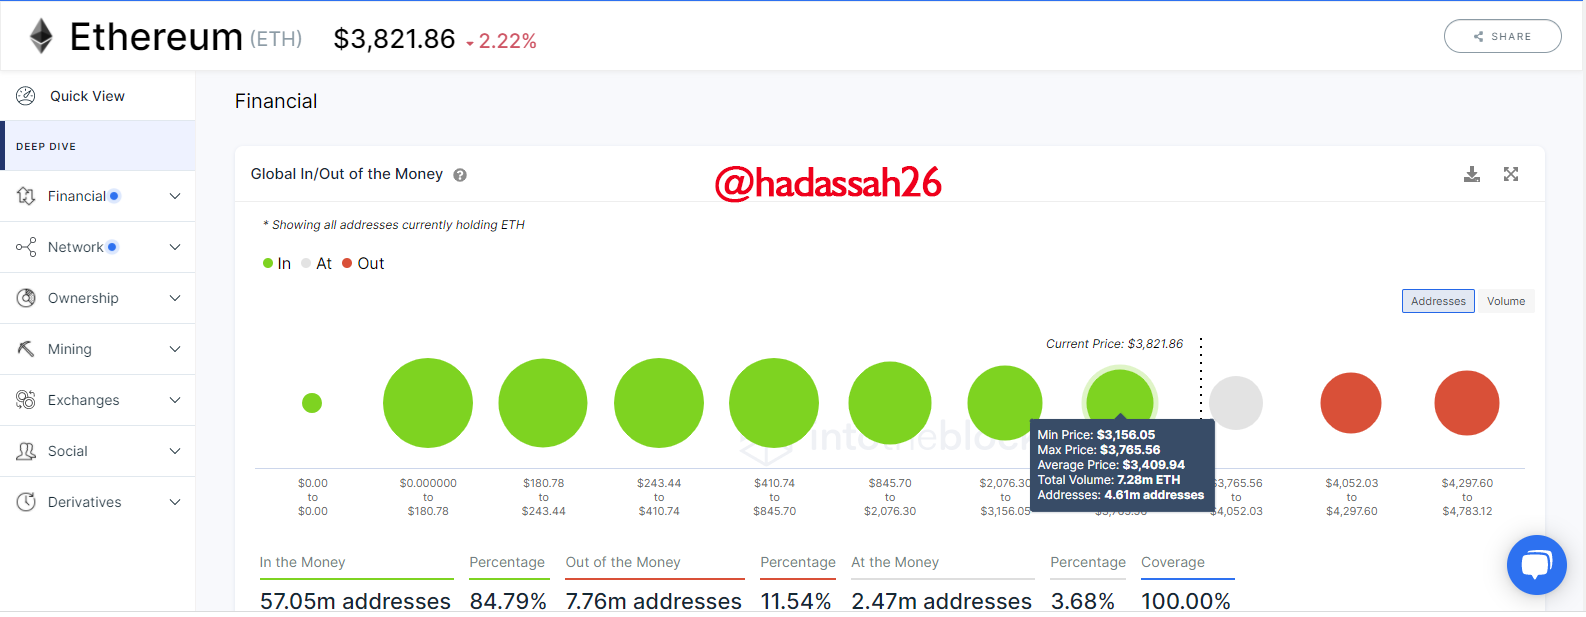
The Ethereum has a current total volume of 7.28million ETH and 4.62 million addresses. And a Maximum price of $3,765 and a minimum price of $3,156.05, and an average price of 3,409 currently. Which forms the cluster
In The Money (ITM): in ethereum, the cluster produces 57.05m addresses with a Percentage 84.79%
At The Money(ATM): in ethereum, the cluster produces 2.47m addresses Percentage 3.68%
Out of the Money(OTM): in ethereum, the cluster produces 7.76m addresses Percentage 11.54%
Adjusted Large Transaction volume
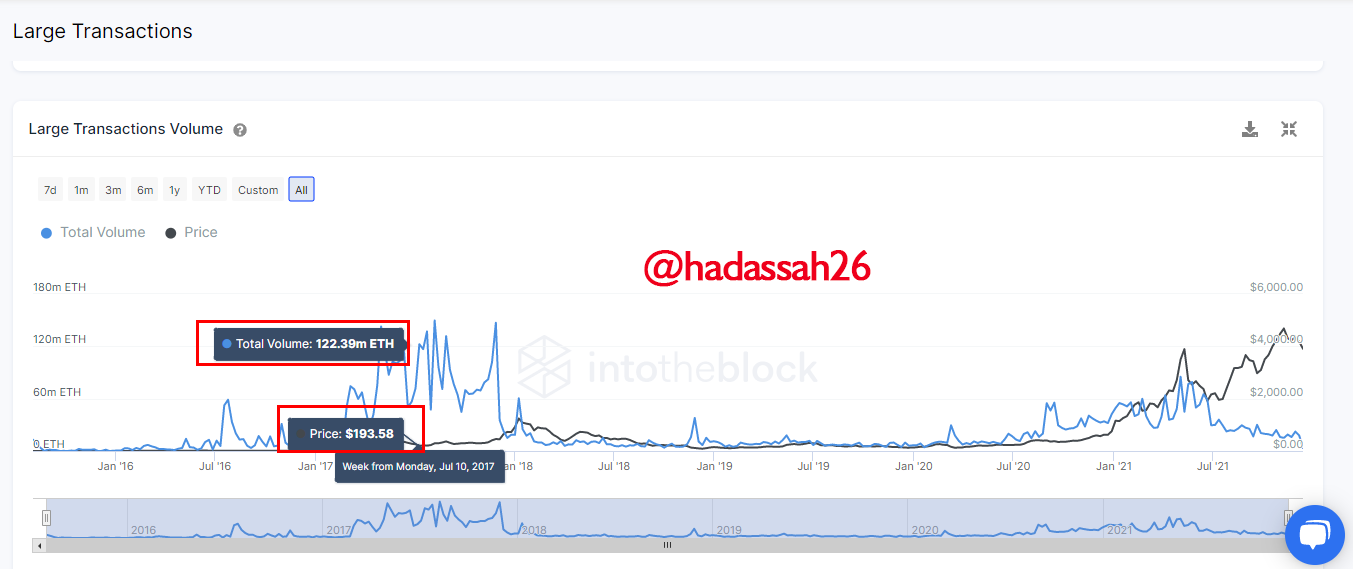
On the 10th of July 2021, the volume of the adjusted large transaction started to fall. The last main spike produced on the 27th of November 2021, which produced up to 147 million ETH, at a price of $457.44, which is supporting a bullish ETC
The Cluster is a good medium to measure the price of an asset and its behavior. Using the GIOM as a fundamental indicator that shows the resistance and the support. the GIOM shows the relationship between the price and cluster. Clusters are the range in price which large bank institution or whale investor and invested and held the price for some couple of days.
Cc: @Sapwood
Beautiful writeup
This is really a great post.
I just gave you an upvote, do more of quality post and I will be your follower