Puria Method Indicative Strategy- Steemit Crypto Academy- S5W4-Homework post for @utsavsaxena11


For years now, traders have formed the habit of trading in such a way that they mostly now follow price trends, and this is what the Puria Indicative Strategy is all about. Traders realized how important trends to their making of reasonable profits from the market. Nearly all strategies in the crypto market are aimed at getting the current trend of the market, because of this, traders have developed many methods of trading such as price action, market structure, different types of patterns just to get the trend of the price in the market. The use of trendline, which is used to check the direction of the trend is another important thing.
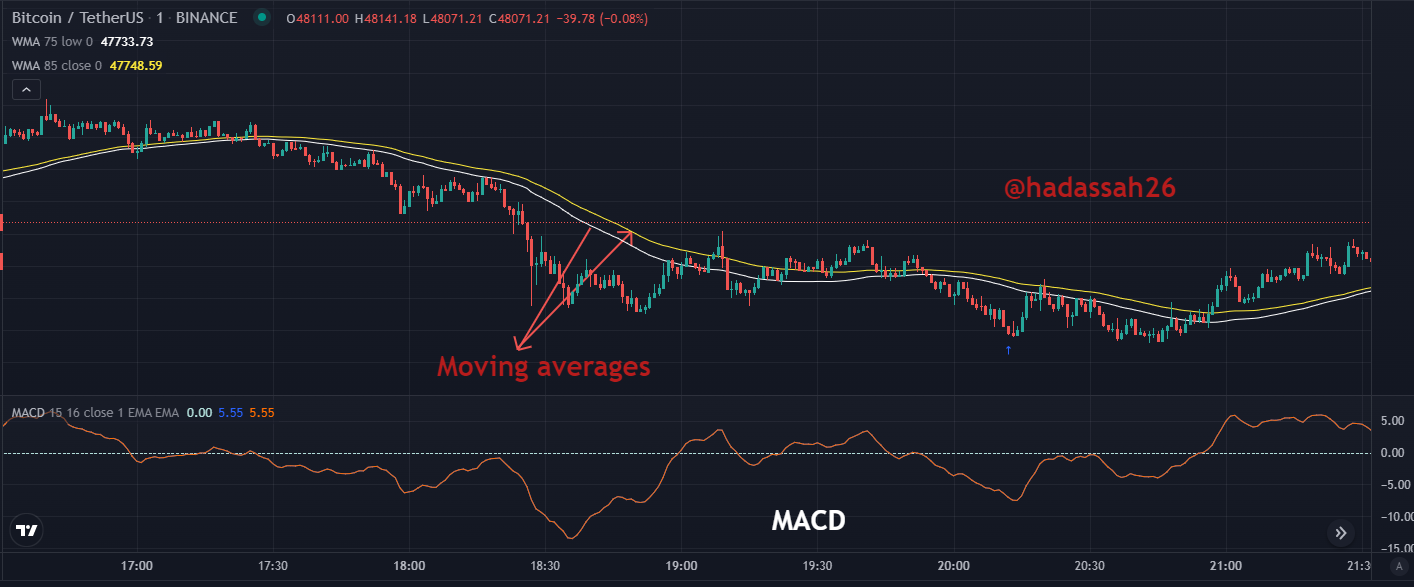
The Puria indicative strategy is a strategy that combines great technical analysis tools such as the two moving averages and a MACD(Moving Average Convergence Divergence). In the Puria indicative strategy, the Two moving averages serve as support and resistance while MACD is used to determine good entry and exit point in the market.
What are its main settings
Let's carefully look at the settings for the 2 moving averages and the MACD (Moving Average convergence divergence)
THE MOVING AVERAGES
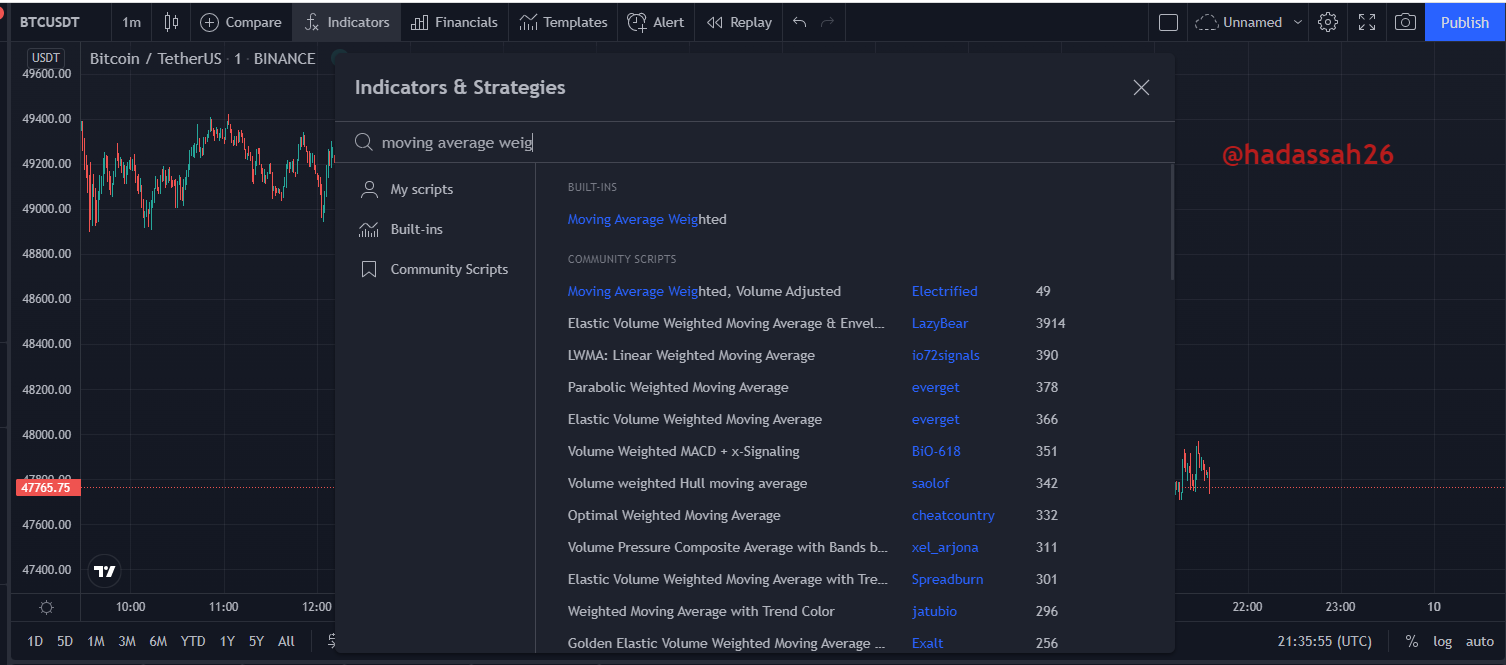
There are 2 moving averages used in this strategy, the moving averages are gotten from the Weighted moving averages. I will be using the tradingview platform, I lick on the indicator icon after opening the tradingview using my browser. Then I will search for the Weighted moving average and they will appear automatically. Then I will begin my editing by inputting the value of my choice to make the moving averages work in my favor.
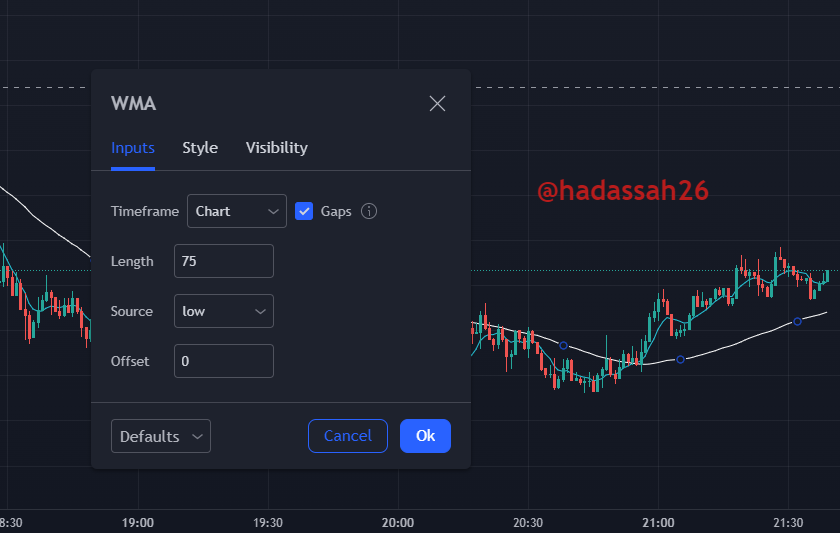
The first weighted moving average will have the following settings,
Period = 75
Apply = low
Colour =white
Method = Linear weighted
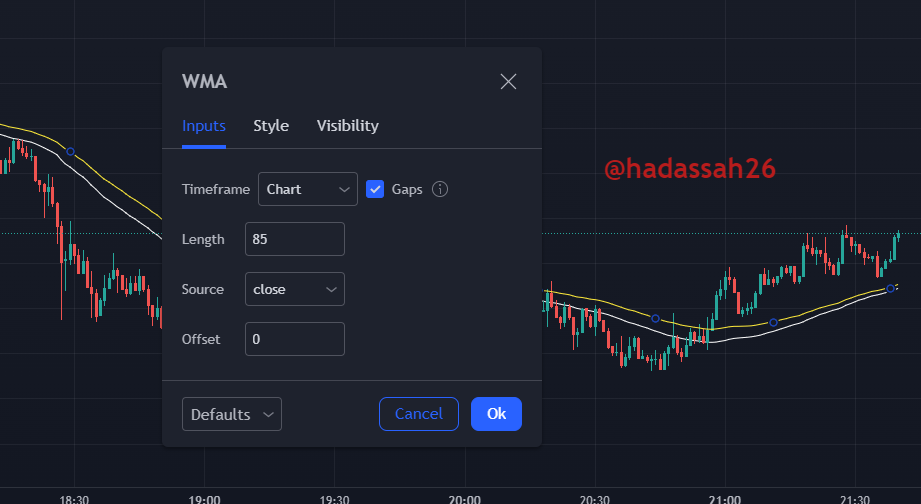
The Second weighted moving average will have the following setting
Period = 85
Apply = close
Colour =Yellow
Method = Linear weighted
MOVING AVERAGES CONVERGENCE DIVERGENCE (MACD)
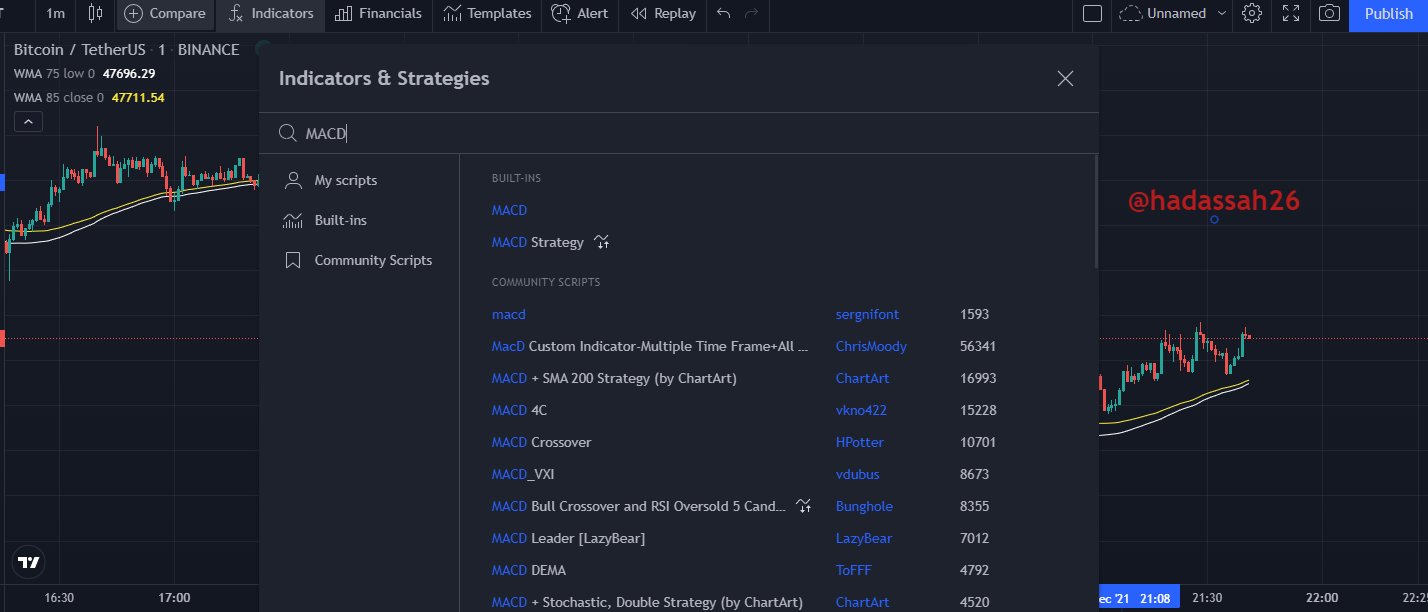
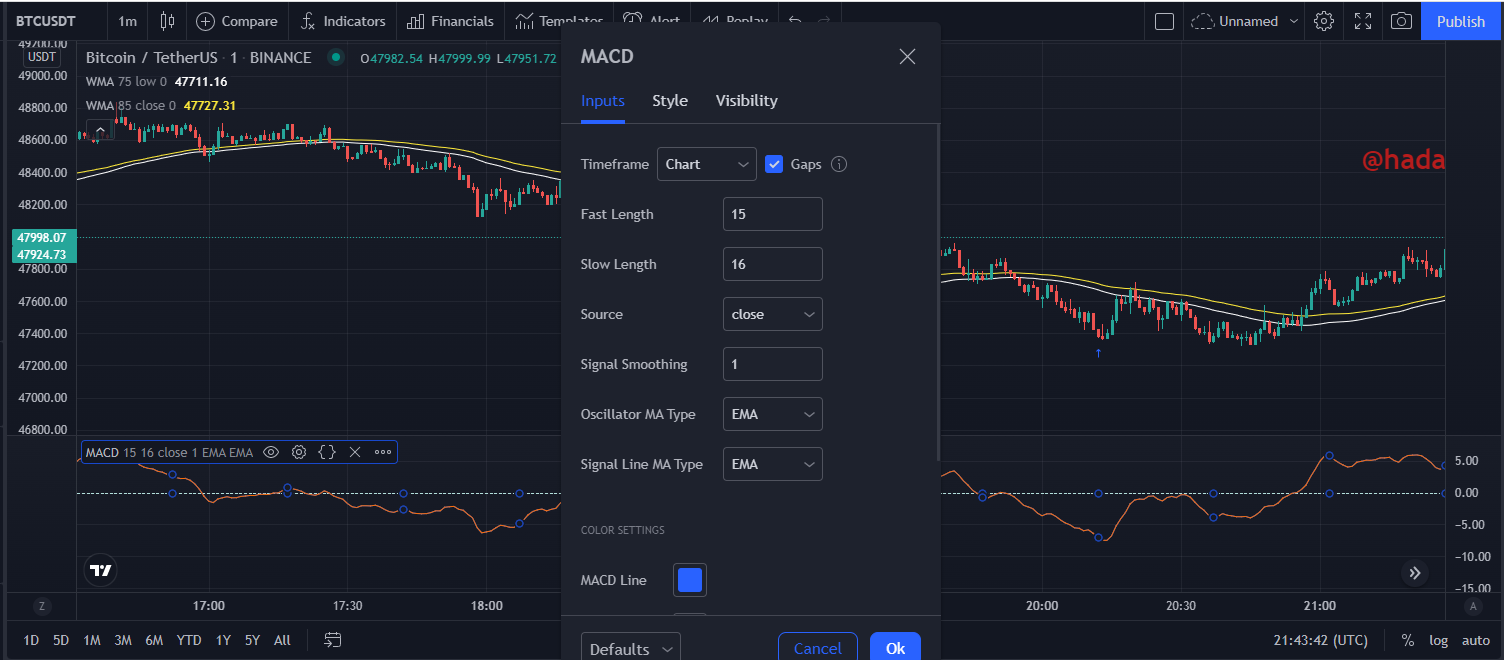
Select the indicator icon and search for MACD on the search bar, and select the MACD, Then click on the gear icon to edit the settings of MACD. These are the following settings for the MACD
Fast length= 15
Slow length = 16
Signal Smoothing moving Average = 1
which timeframe is best to set up this trade and why?
The Puria indicative strategy was basically made for intraday traders, in intraday trading lower timeframes are mostly. Intraday traders use Time frames ranging from M5, M15, M30, H1 and H4. this is because the Puria Indicative strategy produces many signals during the day and those signal can mostly be seen on a smaller time frame. And the Intra Day traders are looking for regular and frequent profit from the market. SO the best time frame using the Puria indicative strategy is using the lower time ranging from M5 to H4
How to read the signal with the Strategy
The Puria indicative strategy, as I have said, it is very easy to read, understand and use.
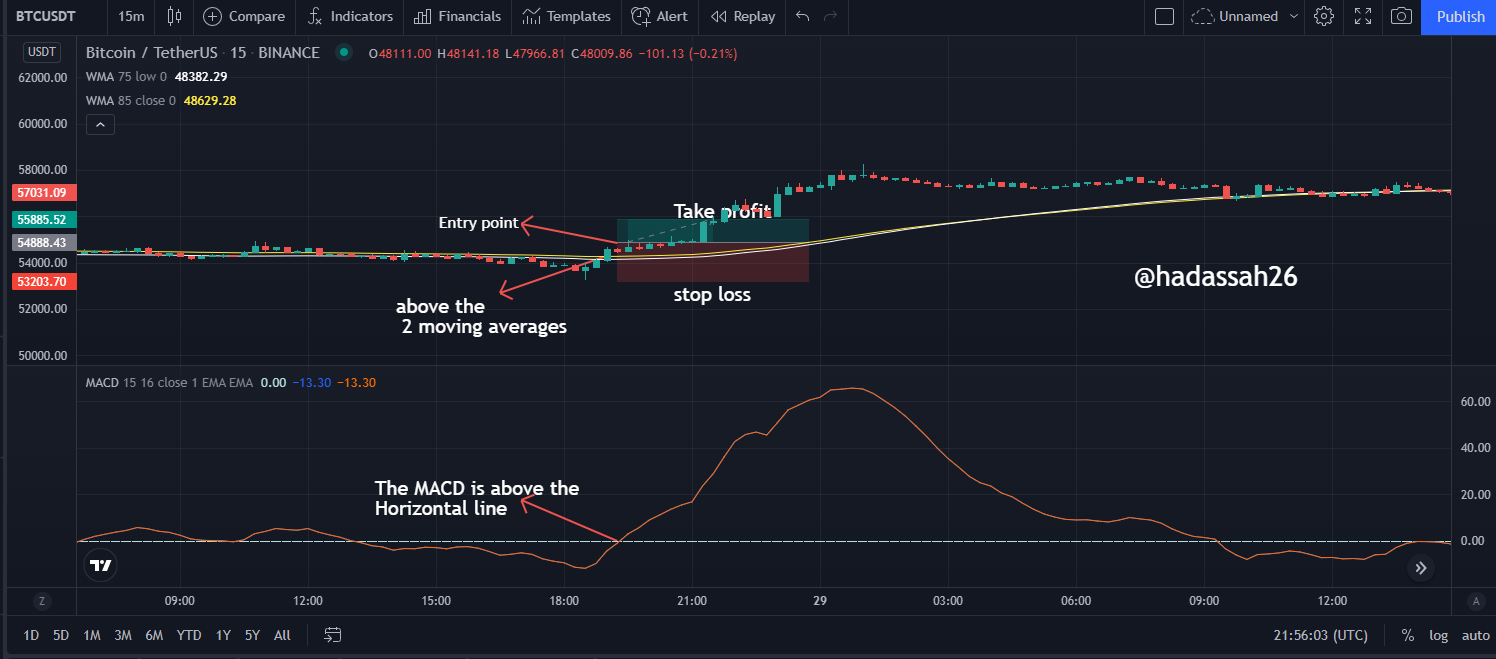
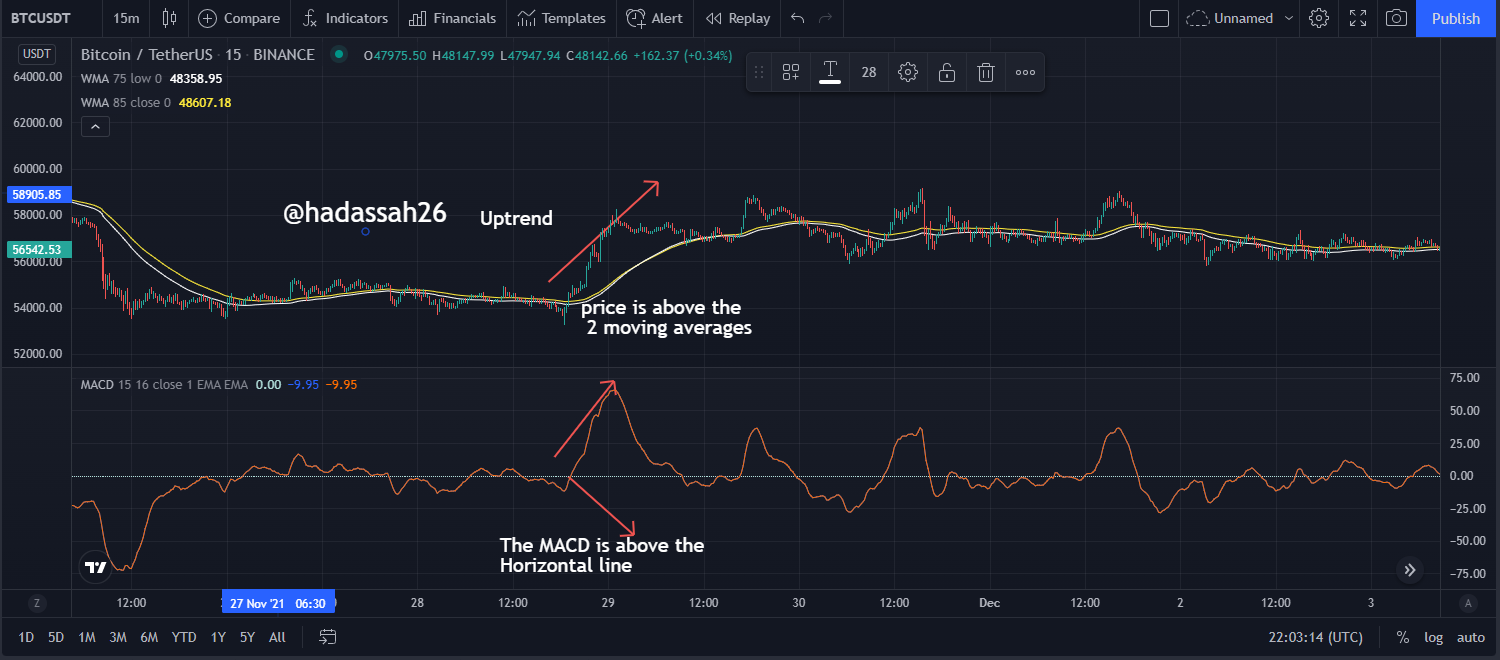
In the case of a buy signal
The MACD has to be above the Horizontal line which indicates the 0 points, this is then used to identify the trend of the market and know the direction of the market, while if the price moves above both moving averages which are acting as a support in this case. Then a buy order can be executed.
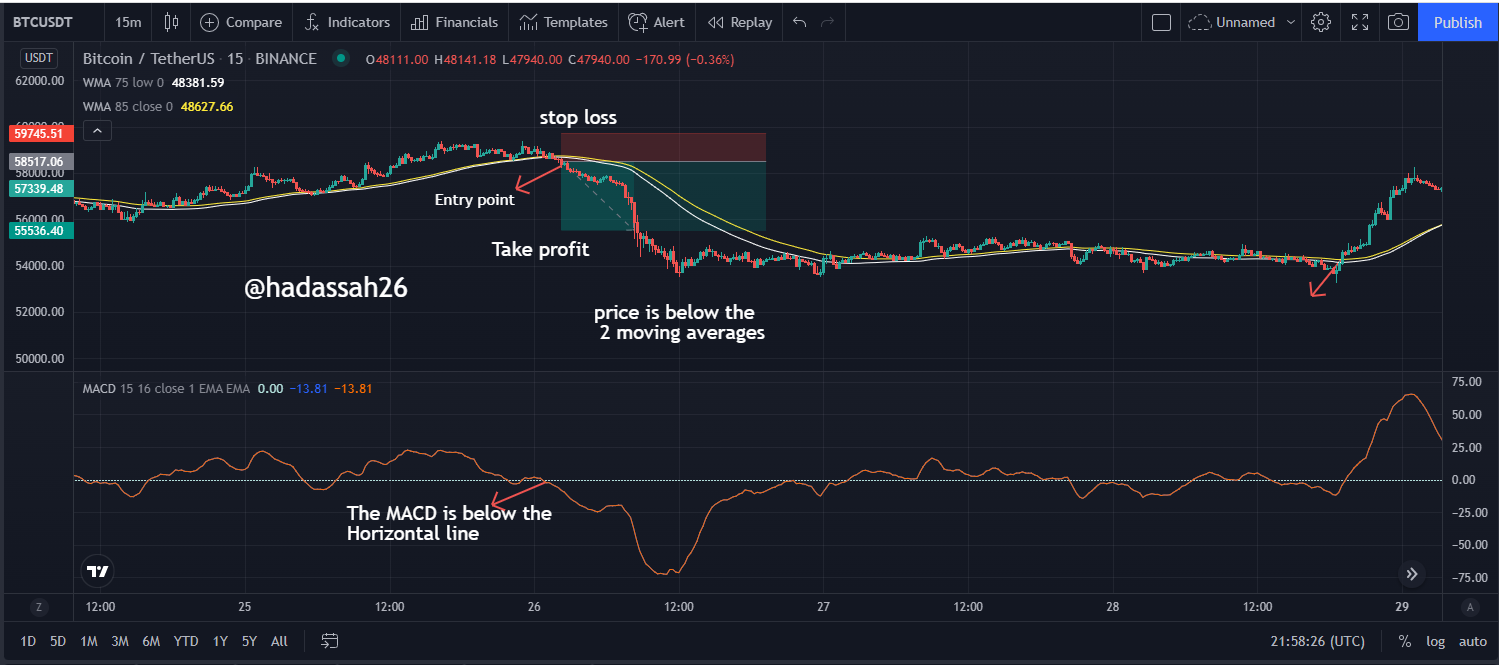
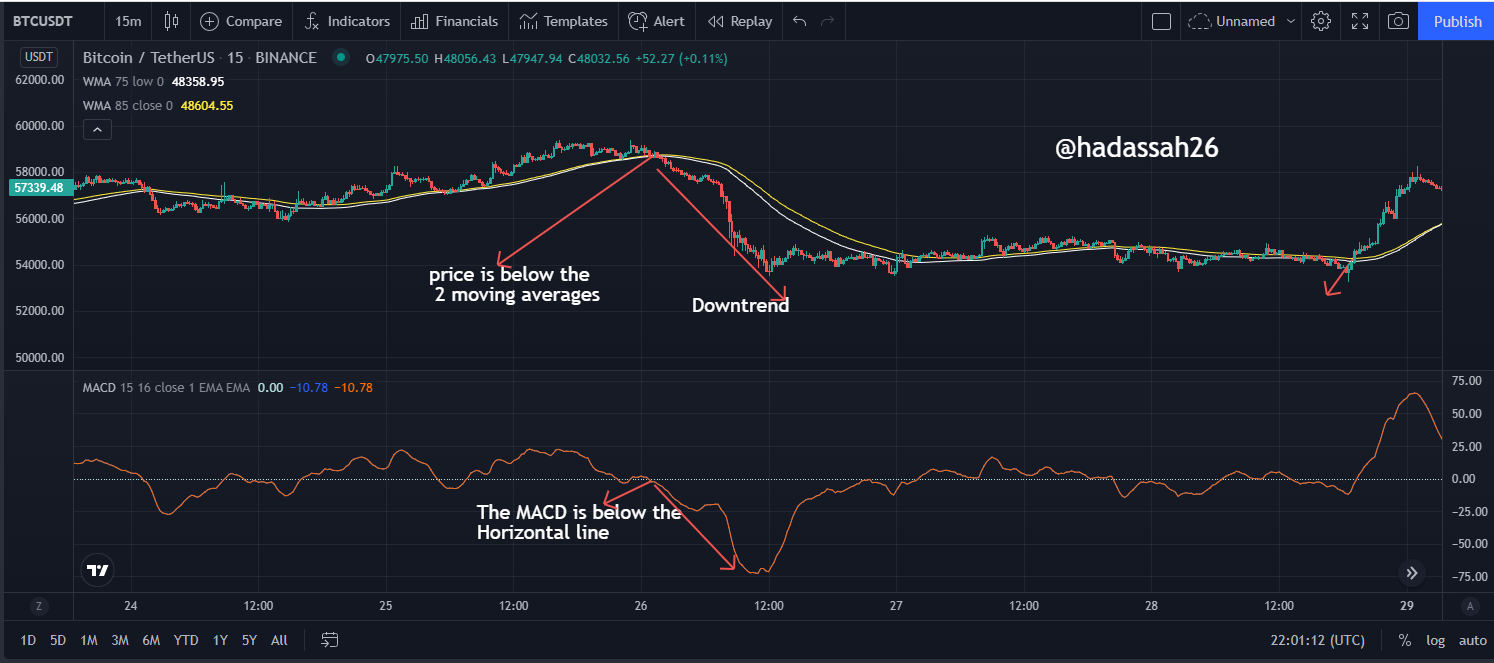
In the case of a Sell signal
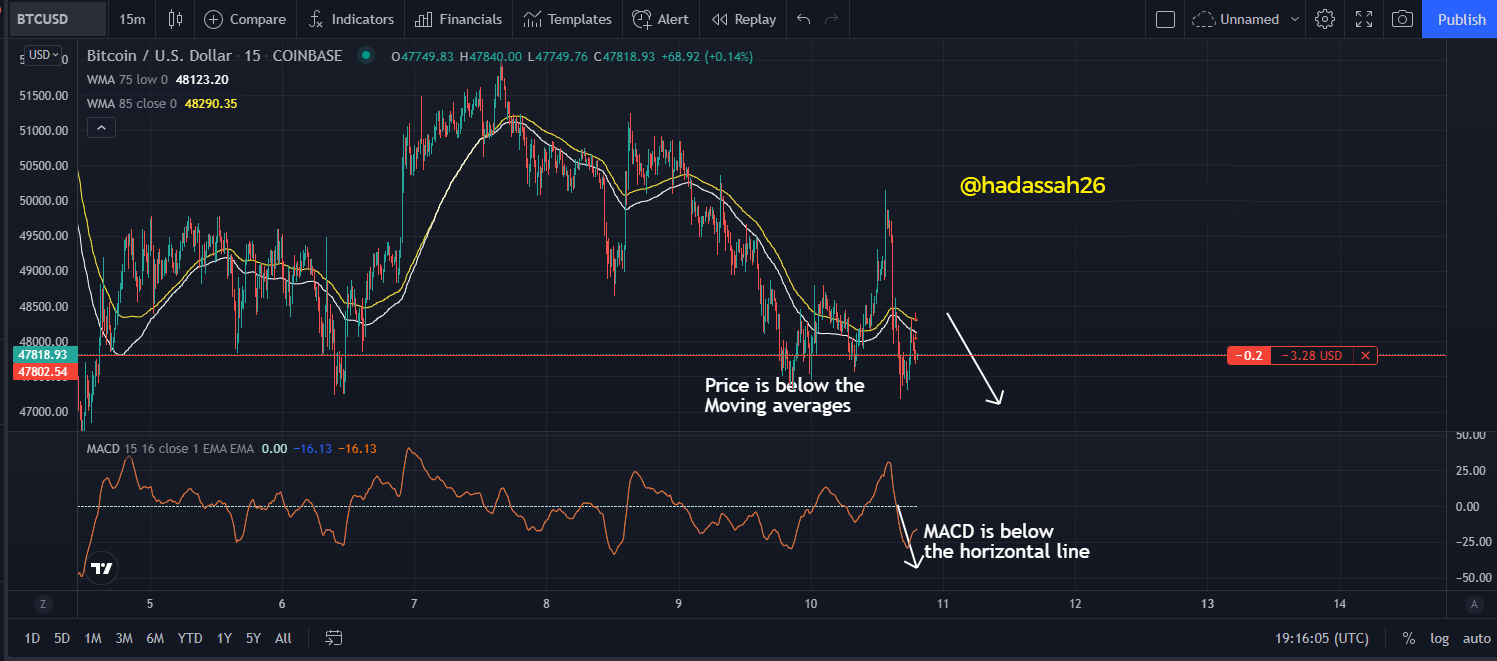
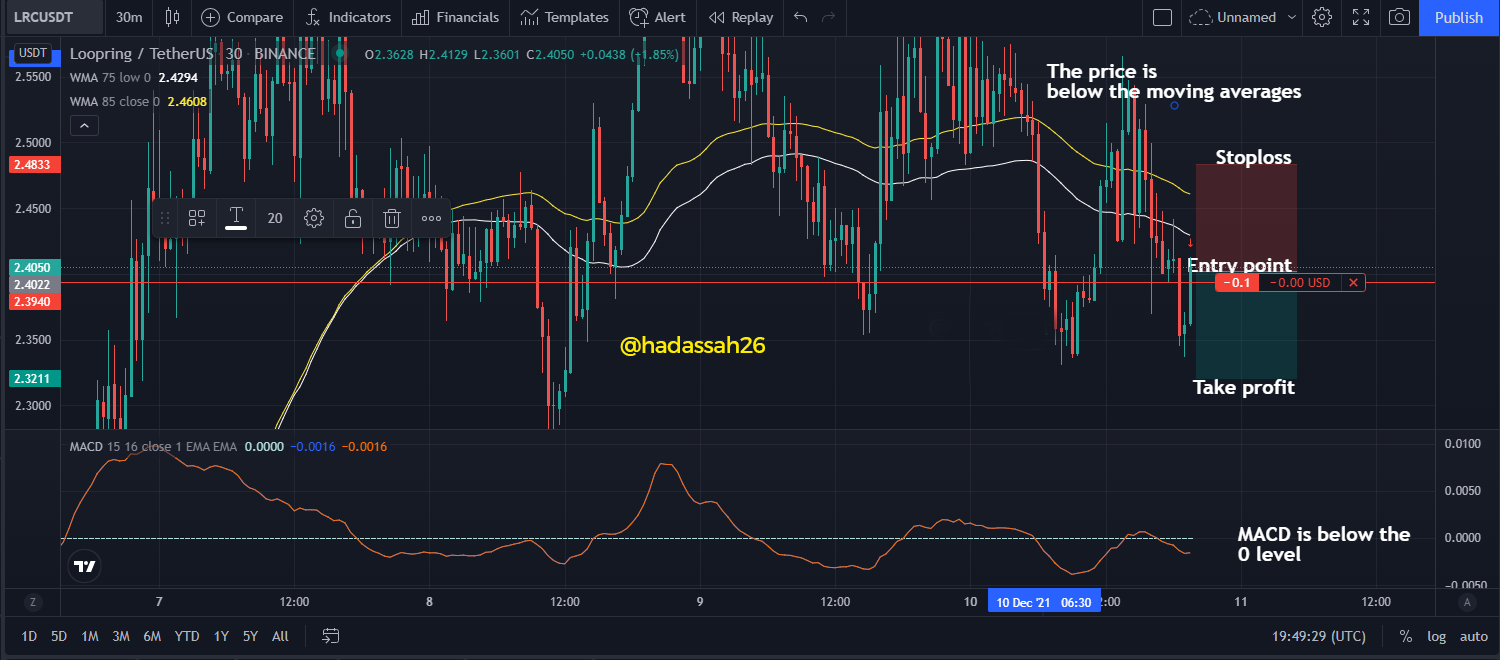
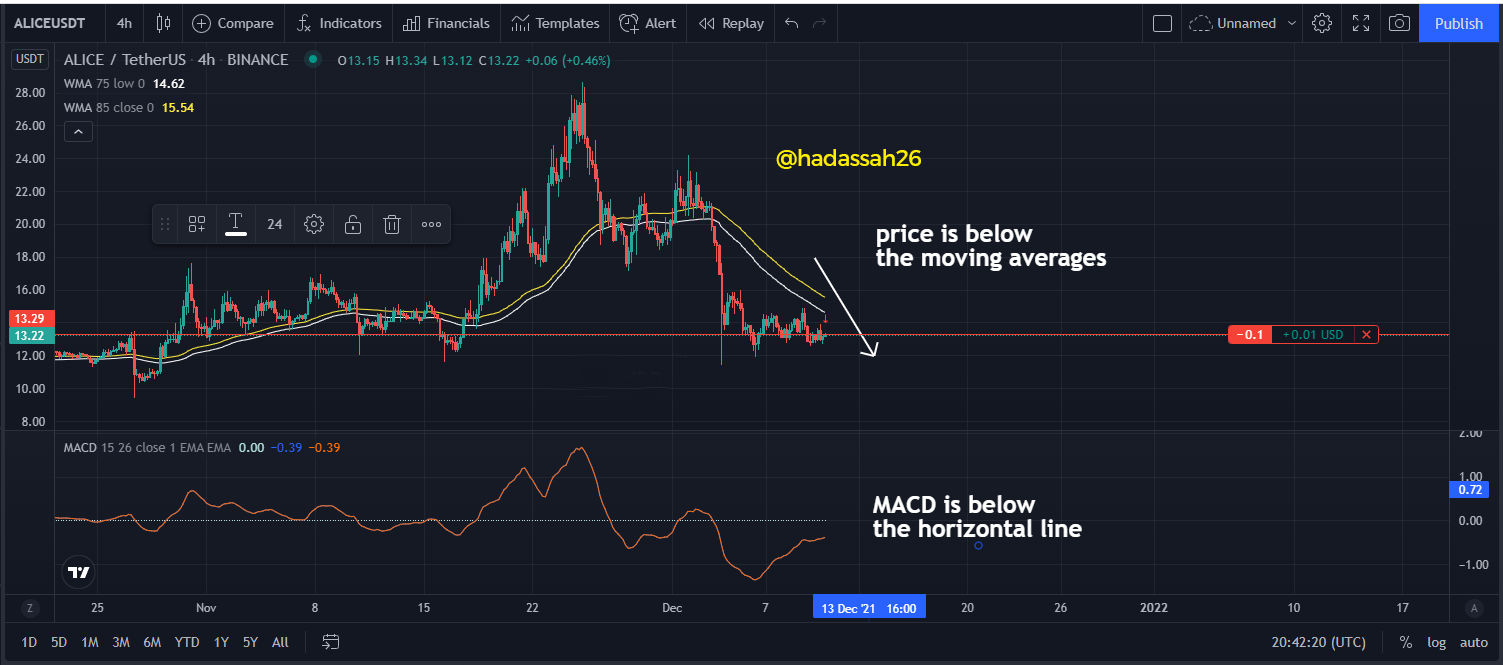
The MACD has to be below the Horizontal line which indicates the 0 points, this is then used to identify the trend of the market and know the direction of the market, at this point the price will be on a bearish trend while if the price moves below the both moving averages which are acting as resistance in this case. Then a sell order can be executed.
Using the Puria indicative strategy, it is easy to identify your trends in both directions.
We will be looking at how to know when a trend is bullish or when a trend is bearish
Identification of the Bullish trend
For you to properly identify your trend, make sure that all your technical indicators, which comprises the 2 moving averages and the MACD are all added and all the settings are done properly.
The first thing to look out for is the position of the MACD line in the MACD windows. The MACD must be above the horizontal line or the 0 points. This means that the bullish trend is about to begin. This is the first confirmation but wait until the second we confirm from the 2 moving averages.
On the side of the moving averages, the price on the chart should be above both of the moving averages. With this second confirmation, our trend can be said to be a bullish trend. We can note to see the price making several higher highs and higher lows.
Identification of the Bearish trend
For you to properly identify your trend, make sure that all your technical indicators, which comprises the 2 moving averages and the MACD are all added and all the settings are done properly.
The first thing to look out for is the position of the MACD line in the MACD windows. The MACD must be below the horizontal line or the 0 points. This means that the bearish trend is about to begin. This is the first confirmation but wait until the second we confirm from the 2 moving averages. On the side of the moving averages, the price on the chart should be below both of the moving averages. With this second confirmation, our trend can be said to be a bearish trend. We can note to see the price making several lower lows and lower highs.
Is it possible to identify trend reversal in the market by using this strategy?
It is very possible to identify trend reversal using the Puria indicative strategy. Reversal is simply a change of trend in the market.
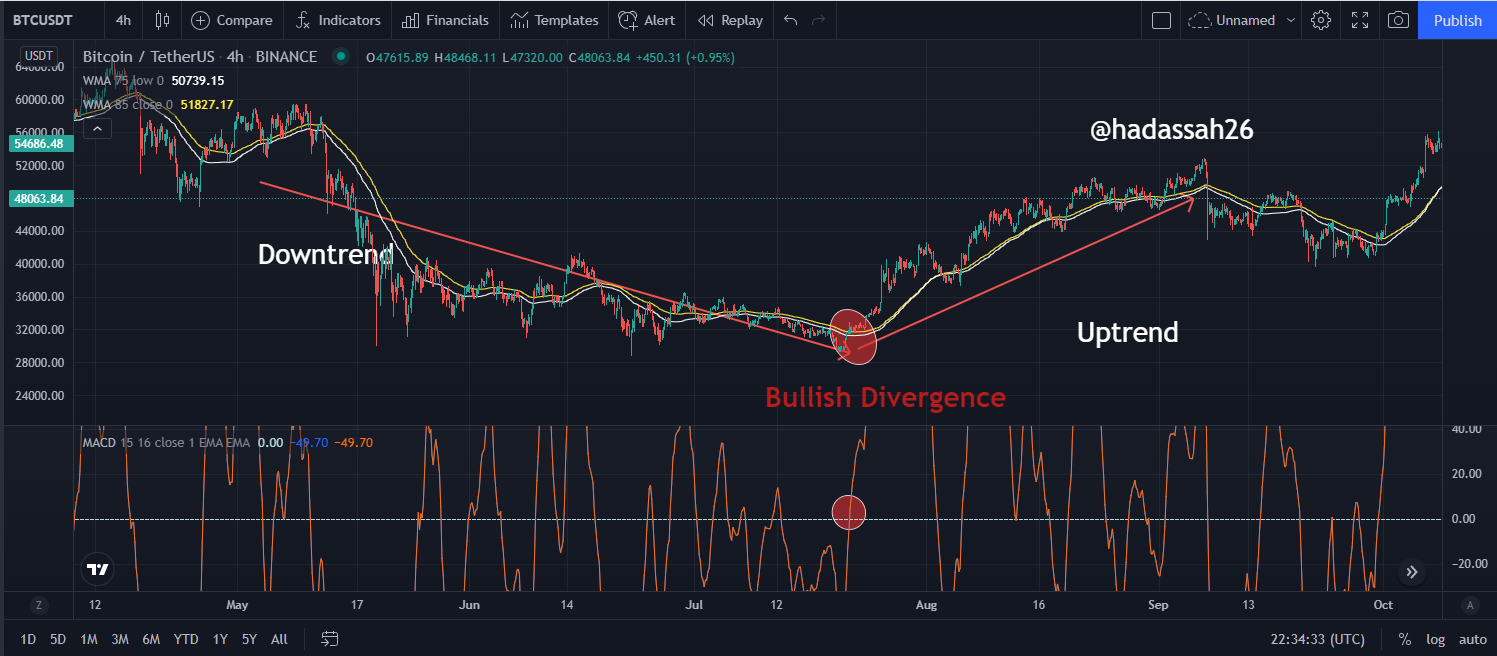
How to use the Puria Indicative strategy to identify the bullish reversal
Firstly the price has to be on a bearish trend with a series of lower lows and lower highs and the price also should be below both moving averages and on the MACD, the MACD line should also be below the horizontal line. Which is a normally bearish trend. At this point, the moving averages will be acting as a resistance to the price.
Using the Puria Indicative Strategy, you can identify a bullish at the moment the price breaks through the moving averages which act as resistance, and also the on the side of the MACD, the MACD line breaks through the horizontal line heading above, once you confirm this two-point, you should know that this is a bullish reversal.
How to use the Puria Indicative strategy to identify the bearish reversal
Firstly the price has to be on a bullish trend with a series of higher highs and higher lows and the price also should be above both moving averages and on the MACD, the MACD line should also be above the horizontal line. Which is a normally bullish trend. At this point, the moving averages will be acting as a Support to the price.
Using the Puria Indicative Strategy, you can identify a bearish at the moment the price breaks through the moving averages which act as support, and also the on the side of the MACD, the MACD line breaks through the horizontal line heading below, once you confirm this two-point, you should know that this is a bearish reversal.

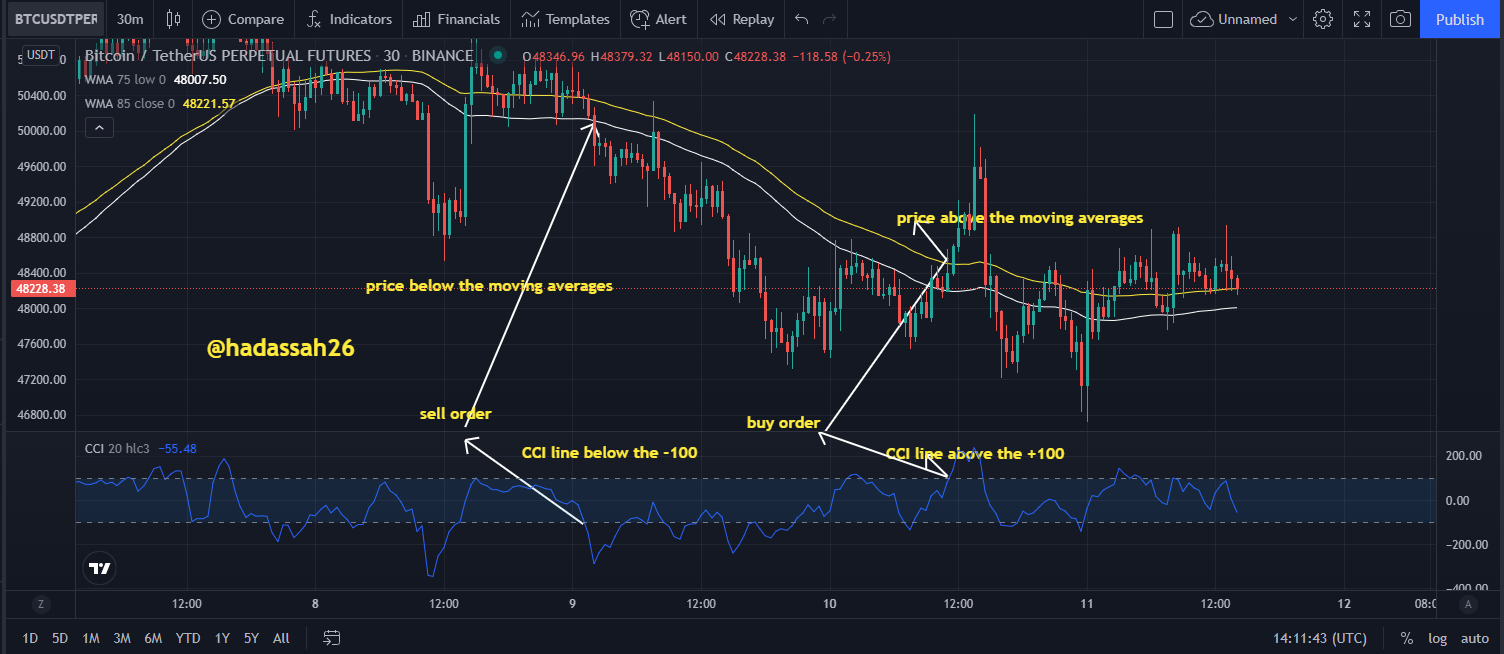
For the case, I will be using the CCI, in place of the MACD, and I will combine it with both moving averages.
The CCI has -100, 0 to +100 range, once the line crosses the -100 it is an indication of a sell but if it crosses through the +100 it signifies a bullish trend which is a buy then the moving averages, when the price is above the moving averages, it is an indication of a buy but if the price moves below the moving averages then it is a sell. So we can combine of them to give us something tangible.
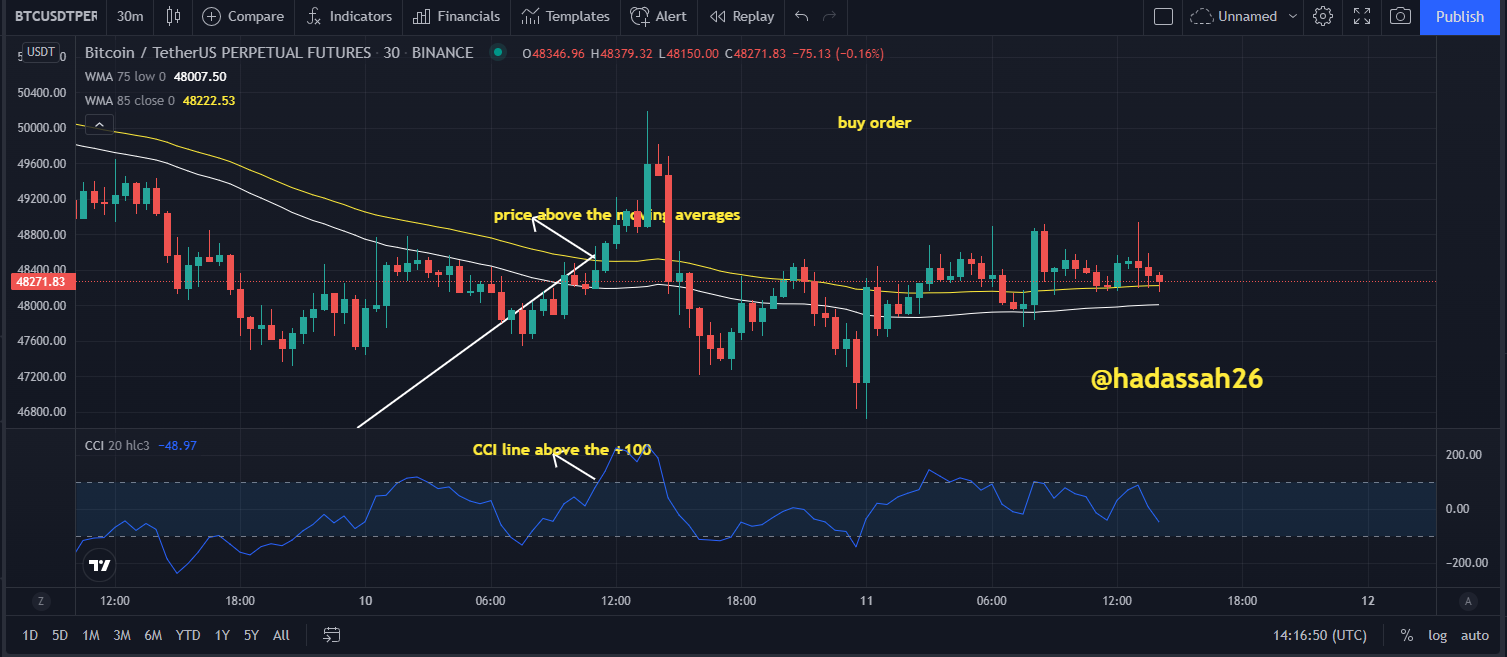
For a Buy Order
Using The CCI indicator, for you to buy, the CCI line should be above the +100 level while the price should be above the moving averages. And the price should be on the uptrend .
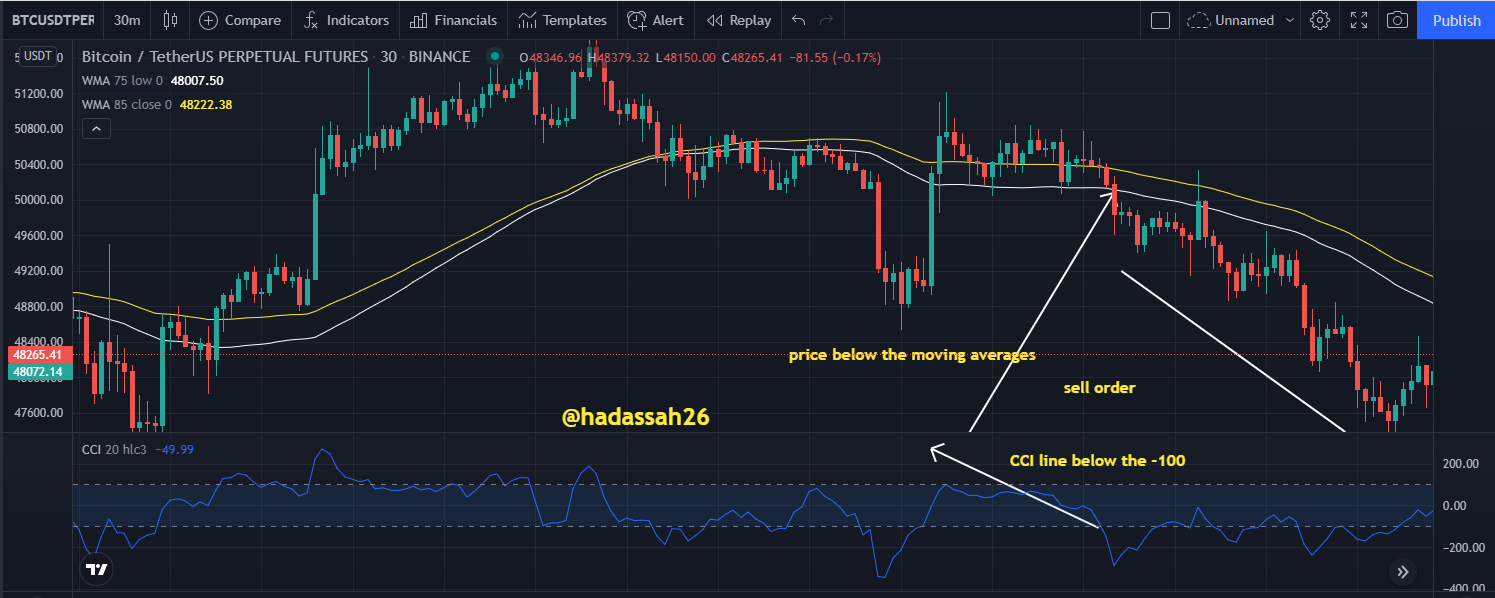
For a Sell Order
Using The CCI indicator, for you to sell, the CCI line should be below the -100 level while the price should be below the moving averages. And the price should be on the downtrend .
- Set up 10 demo Trades (5 buying and 5 selling ) on 5 cryptocurrency pairs using puria method indicative strategy. Explain any 2 of them in detail. Prepare a final observation table having all your P/L records in these 5 trades.
Buy Order
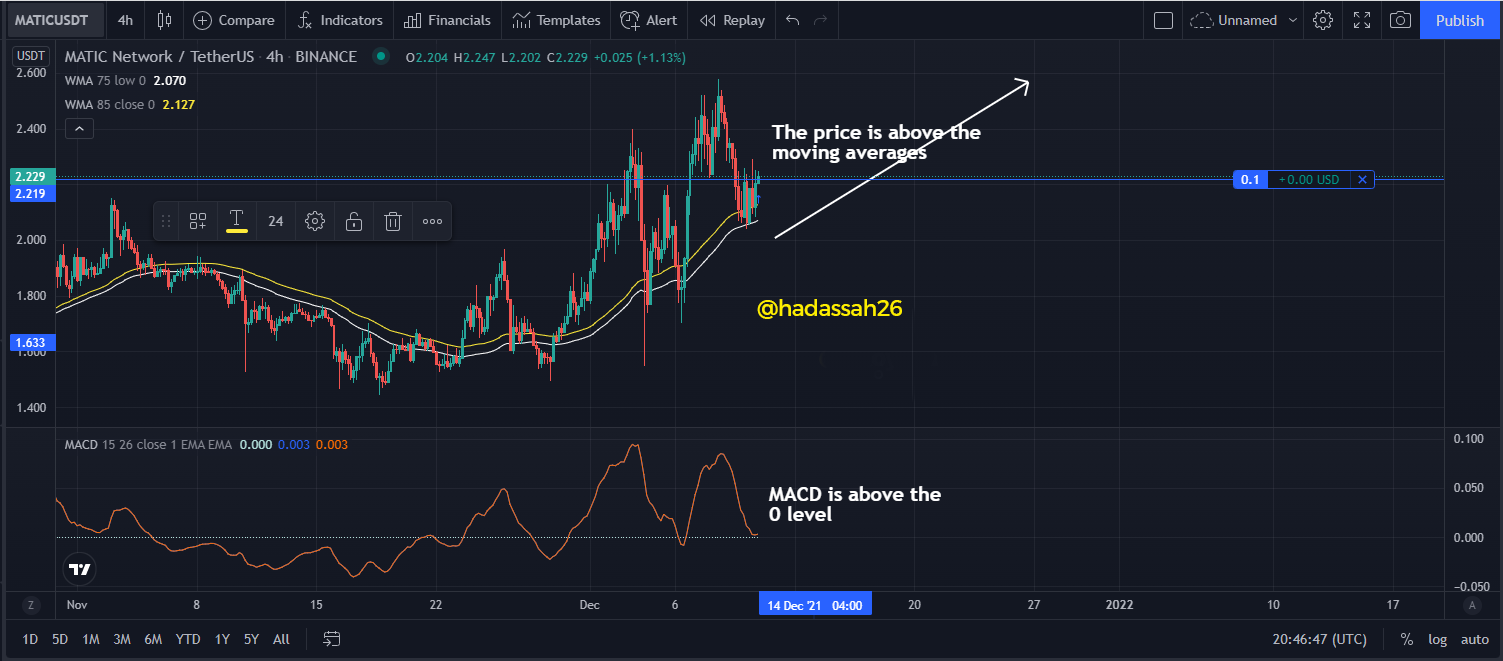
MATIC/USDT
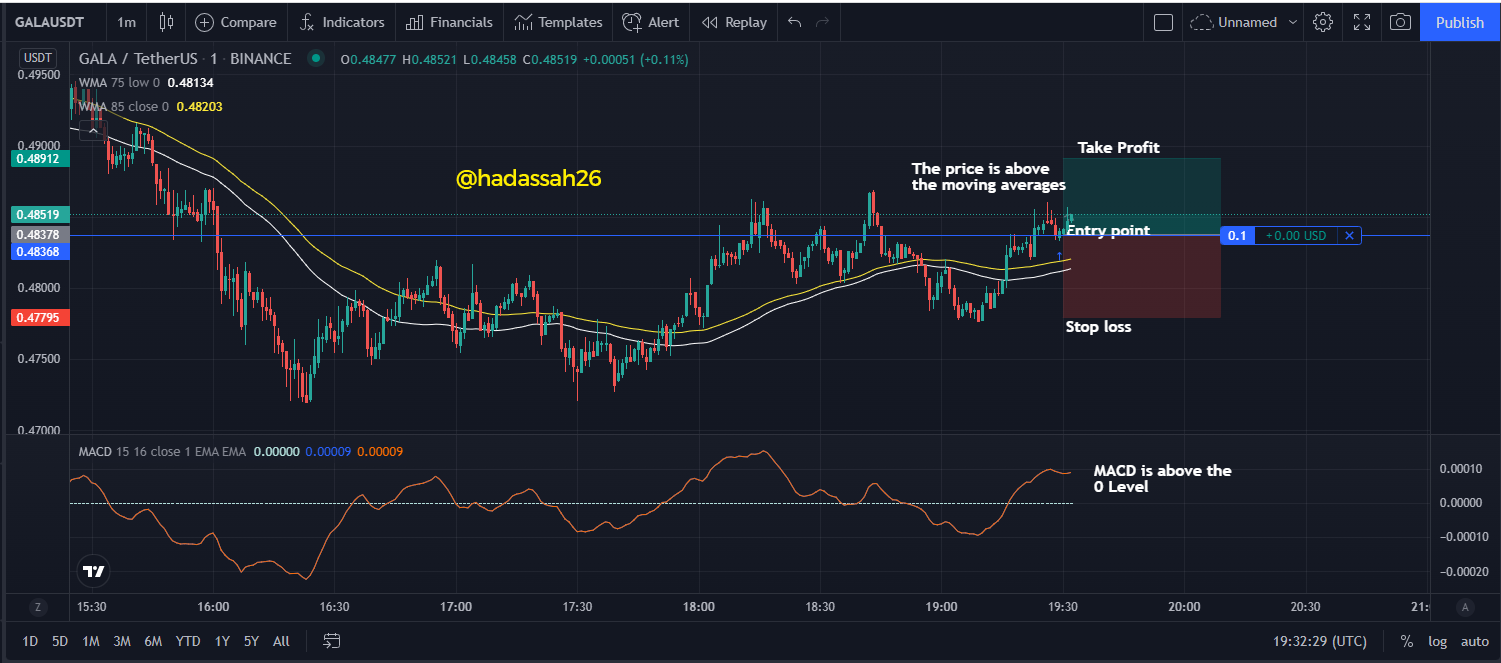
GALA/USDT
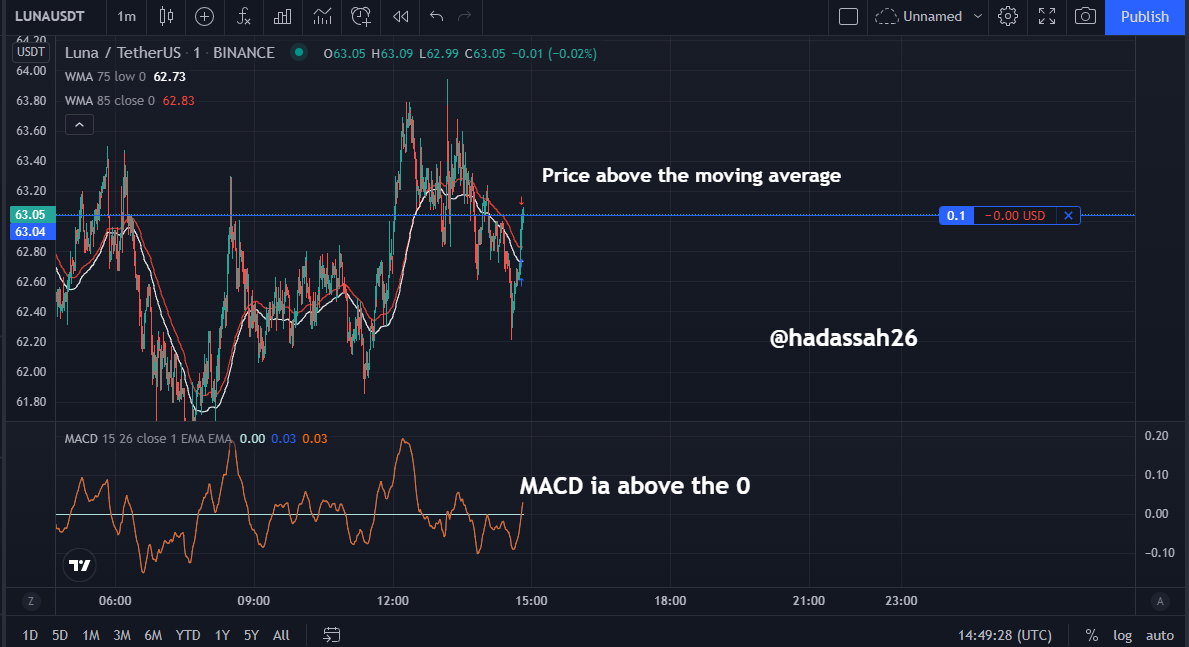
LUNA/USDT
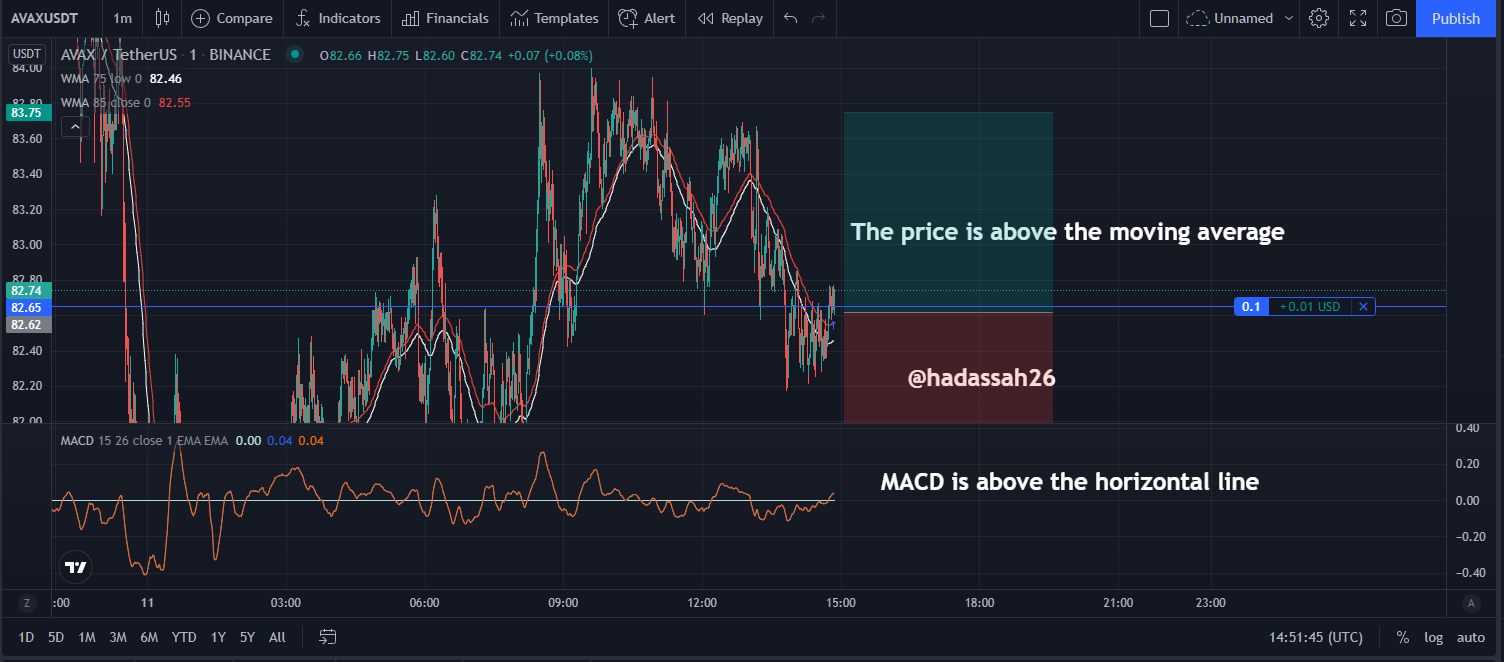
AVAX/USDT
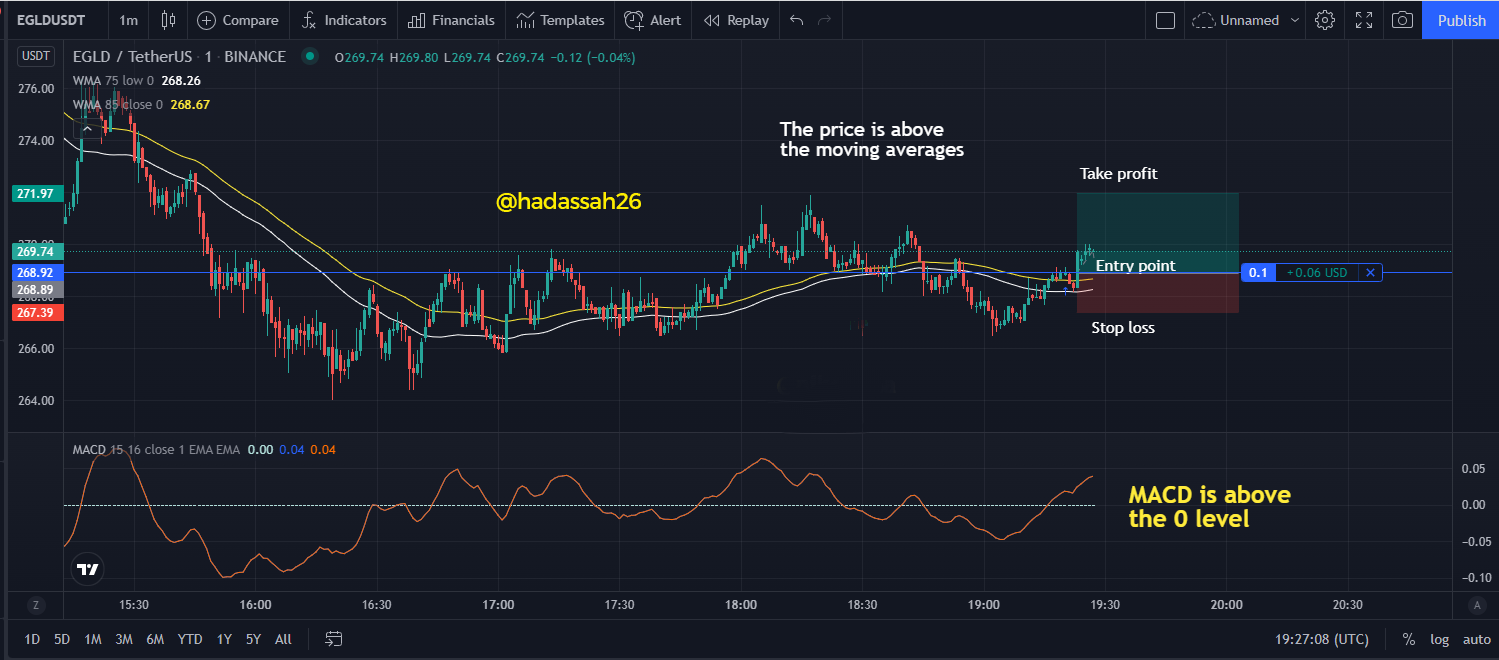
EGLD/USDT
The reason I bought in the EGLD/USDT in the 1mins timeframe is that the price on the market is above the two moving averages and the MACD also is above the horizontal lines in the MACD window and the market is on an uptrend too. So with all this reasons in place I decided to buy
SELL ORDER
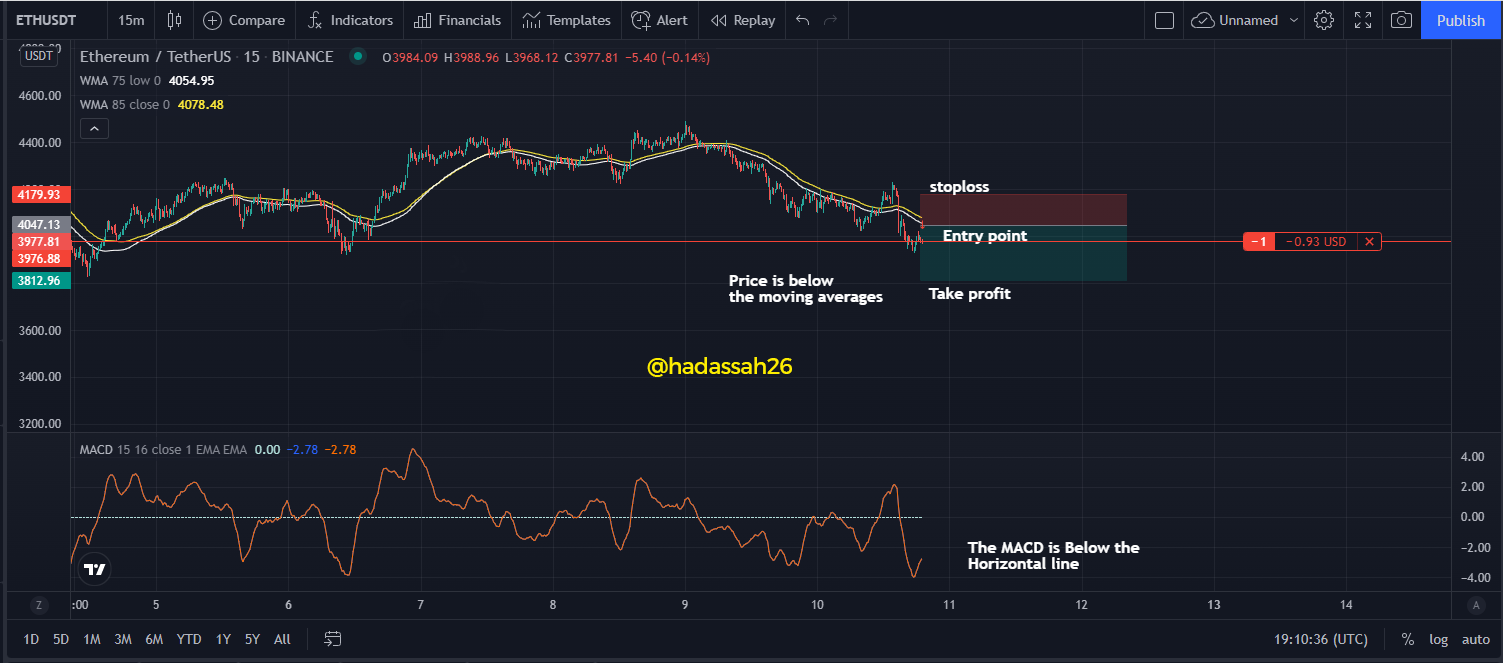
ETH/USDT
BTC/USD
LRC/USDT
ALICE/USDT
DOT/USDT
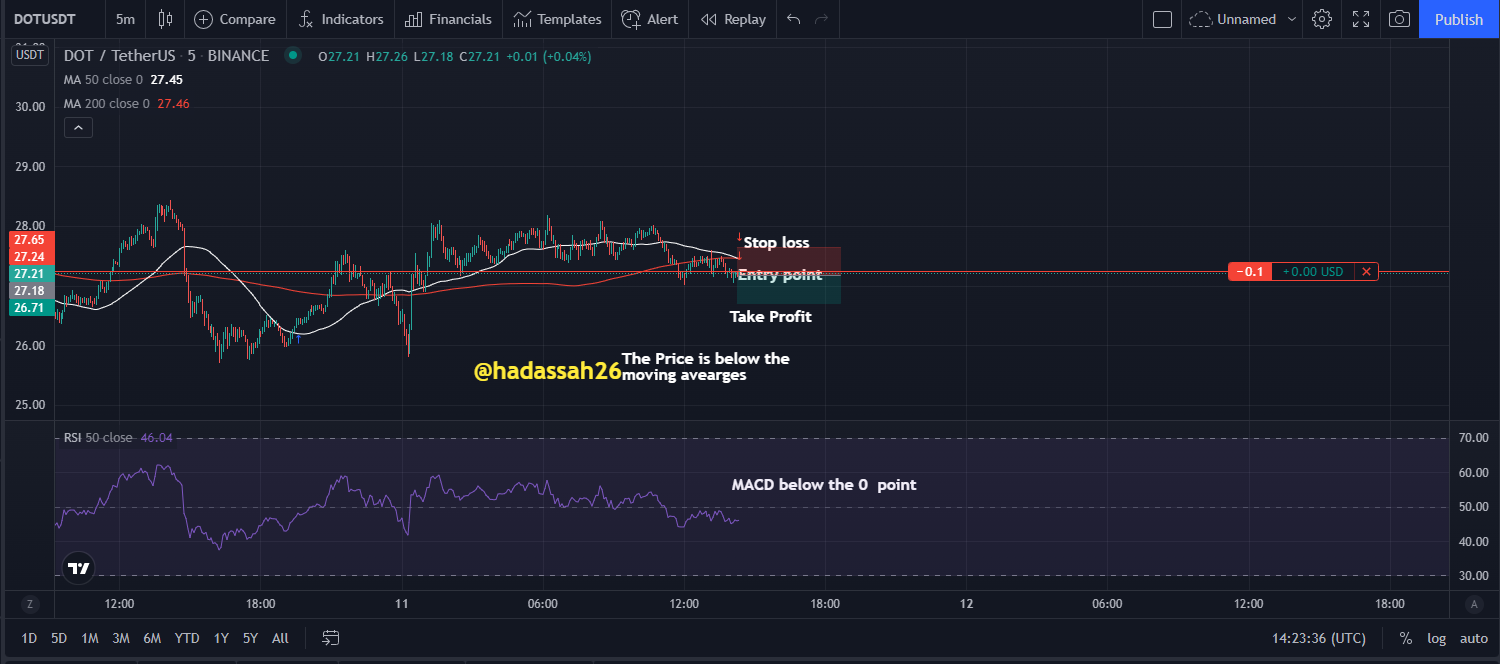
The reason I sold in the DOT/USDT in the 5mins timeframe is that the price on the market is below the two moving averages and the MACD also is below the horizontal lines in the MACD window and the market is on an downtrend too. So with all this reasons in place I decided to sell
Components of the table:
| S.no. | Pair | Buying Price | selling Price | profit | loss | time frame |
|---|---|---|---|---|---|---|
| 1 | MATICUSDT | 2.229 | still running | 4hrs | ||
| 2 | GALAUSDT | 0.48368 | still running | 1min | ||
| 3 | LUNAUSDT | 63.05 | still running | 1 min | ||
| 4 | AVAXUSDT | 82.65 | still running | 1 min | ||
| 5 | EGLDUSDT | 268.92 | 0.06 | 1 min | ||
| 6 | ETHUSDT | 4047.13 | -0.97 | 15mins | ||
| 7 | BTCUSD | 47818.93 | -3.97 | 15mins | ||
| 8 | LRCUSDT | 2.4050 | still running | 30mins | ||
| 9 | ALICEUSDT | 13.29 | +0.09 | 4hrs | ||
| 10 | DOTUSDT | 27.21 | still running | 5mins |
In this question, I will be using a unique strategy that is called the MONEY IN THE BANK STRATEGY.
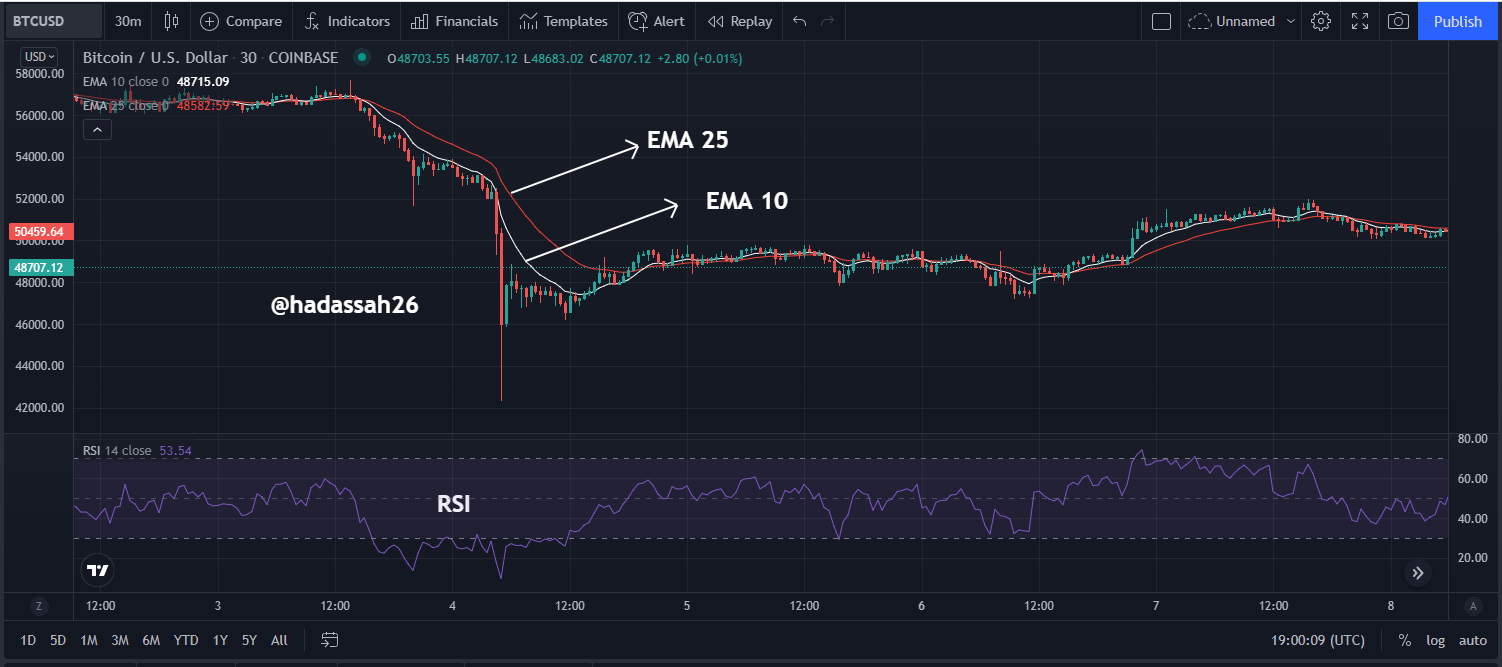
This strategy is made up of three indicators, which comprises the two Exponential Moving averages and a Relative strength index. The EMA is 10 and 25. if the EMA 10 crosses above EMA 25, this is a sign of buy entry, but if the EMA 10 crosses below EMA 25, this is a sign of sell entry.
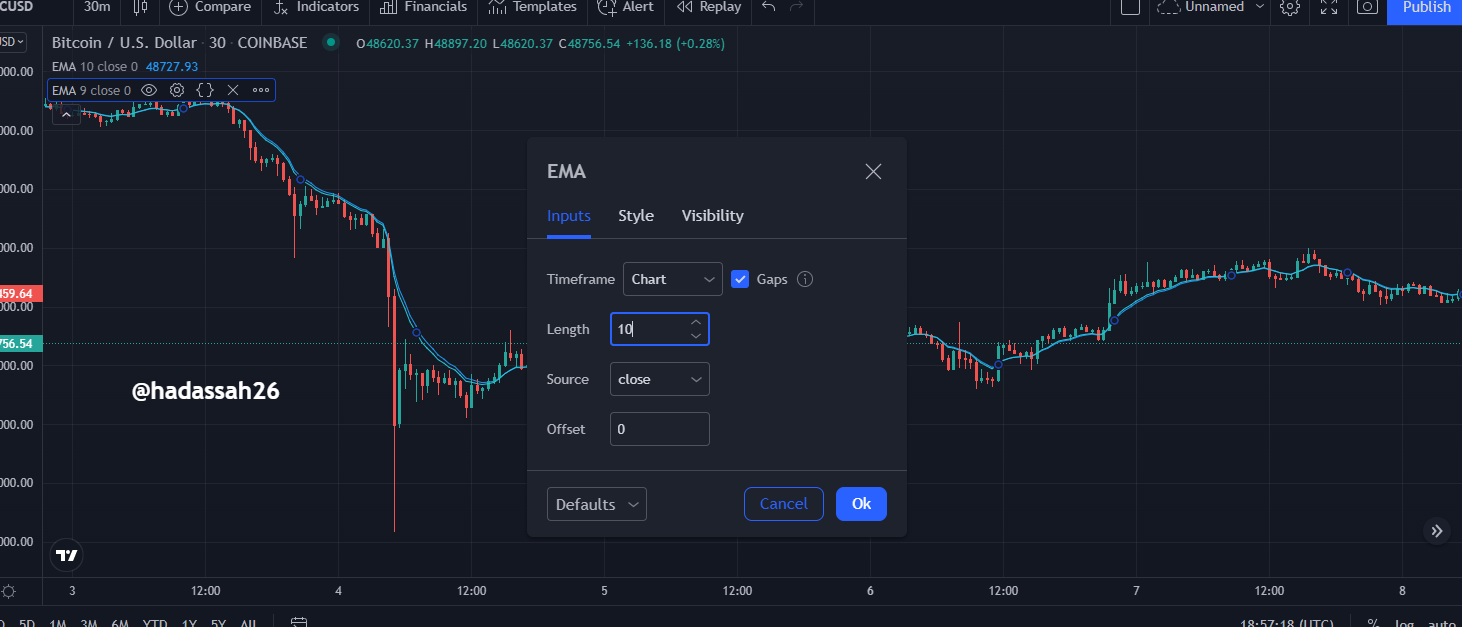
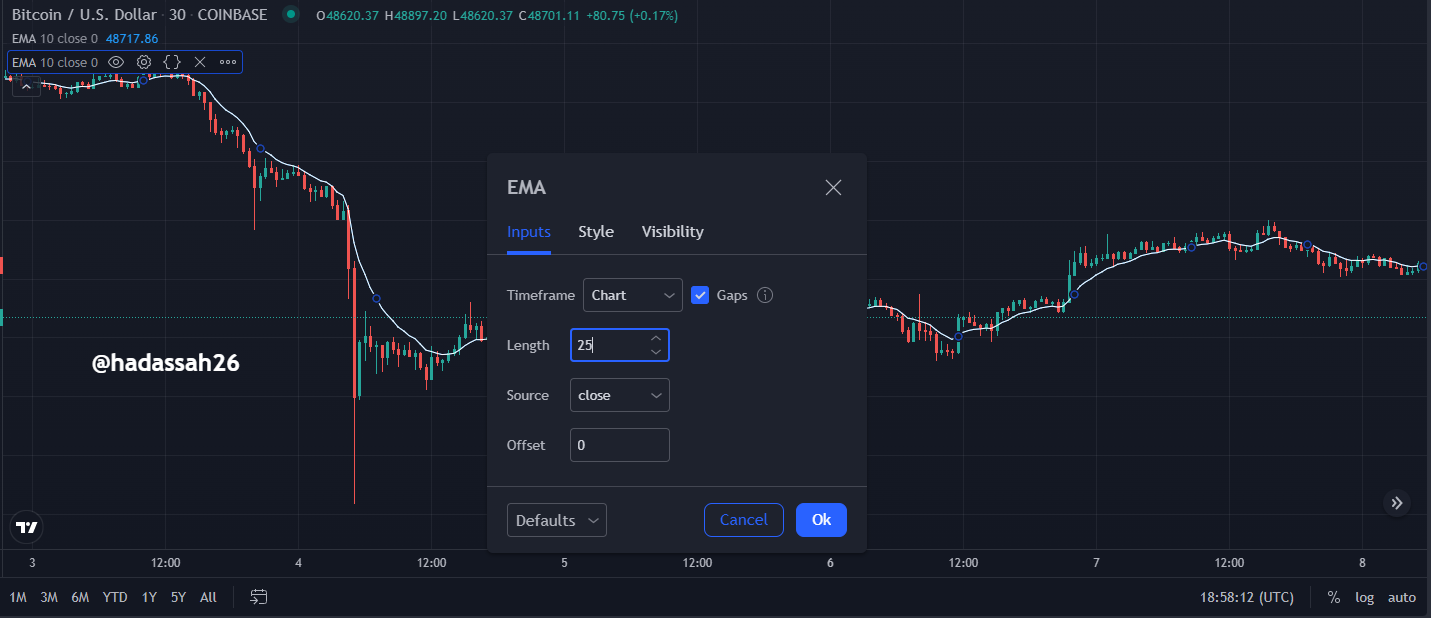
The Relative Strength Index is set to 14 level period, if the level of the RSI is from 70 and above, it is a buy sign and if the RSI is from 30 and below, it is a sell sign,... Now you have to combine the RSI and the two EMA
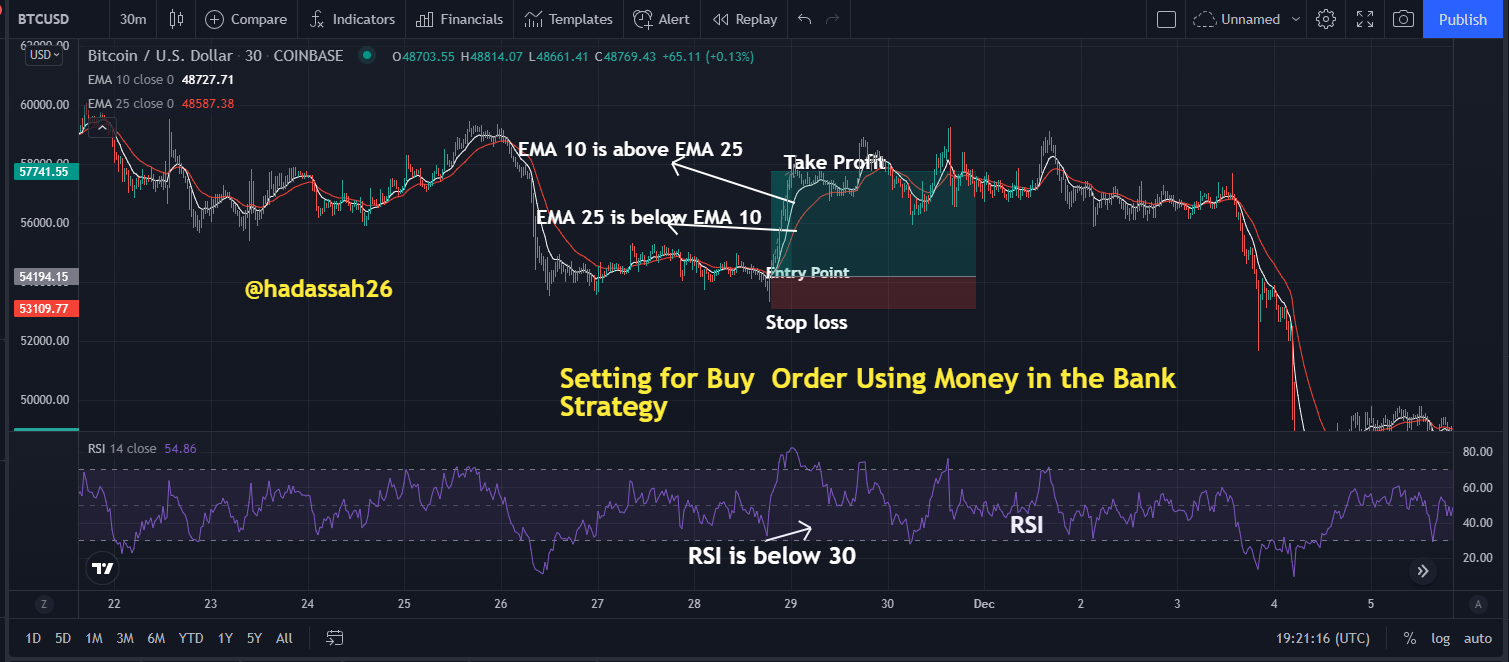
Trading Setup For Buy using The Money in the Bank Strategy
In this Money in the bank Strategy, the EMA 25 will be below the EMA 10 serving as a strong support and the price will be above both of them while the RSI will be below the 30 level which is a sign for oversold which means that sellers are tried and buyers are ready to take over the market.
For the buy setup, the RSI must be Above the 70 level w
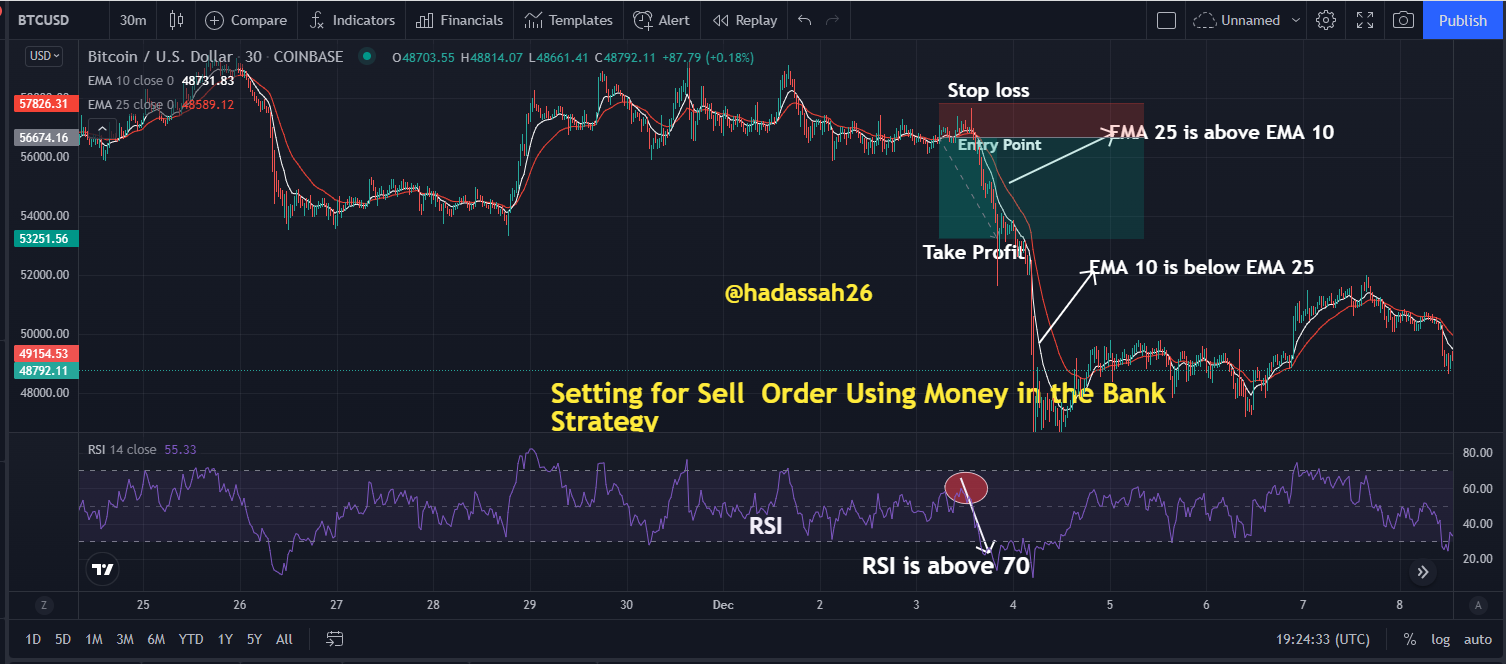
Trading Setup for Sell using The Money in the Bank Strategy
In this Money in the bank Strategy, the EMA 25 will be above the EMA 10 serving as a strong Resistance and the price will be below both of them while the RSI will be above the 70 level which is a sign for overbought which means that buyers are tried and sellers are ready to take over the market.
The Puria Indicative Strategy is a very wonderful technical strategy that determine the trend of the price, even trend reversal and other useful stuffs. It is made up of the technical tools such as the Two Moving averages and a MACD with different settings, that make them essential and unique. Traders can use it determine wonderful entry and exit position in the market.
we went further to have a replacement for the MACD indicator and I use the CCI indicator and it worked perfectly. and I also created my own strategy and I named it the Money In The Bank strategy, the Strategy will help make fast money. Go through my work for more understanding. I am specially thank professor @utsavsaxena11 for this wonderful work.
Cc: @utsavsaxena11