Recognizing Simple Patterns in Trading - Crypto Academy / S5W2 - Homework Post for @sachin08

1. What is your understanding of Triangles in Trading? Explain all forms of triangles in your own words. (Screenshot required)
The technical analysis comprises different patterns and structures that make up the market. But in today’s case, we will be looking at the Triangle pattern in trading. Patterns are used to predict the price movement in the market, which is what most traders are looking for in the market.
Triangle is one of the famous chart patterns that are present in the market. Chart pattern comprises od candlesticks that have formed a particular pattern repeatedly over some time.
A Triangle pattern is that has the triangle shape, which is formed in a trending market and it shows the continuation of a trend in a particular trade. The market ranges for some time, after a long move, during the period where the market is ranging it usually forms a triangle which some persons call wedge, this is the period where the price uses to gain momentum, the price breaks through the support or the resistance of a ranging market, then it can continue its trend.
There are three types of a triangle pattern that most traders are looking for when a market is trending. Traders usually wait for the price to break through a support or resistance for them to join the trend and make their profit. These triangular patterns include,
- Ascending Triangle
- Descending Triangle
- Symmetrical Triangle.
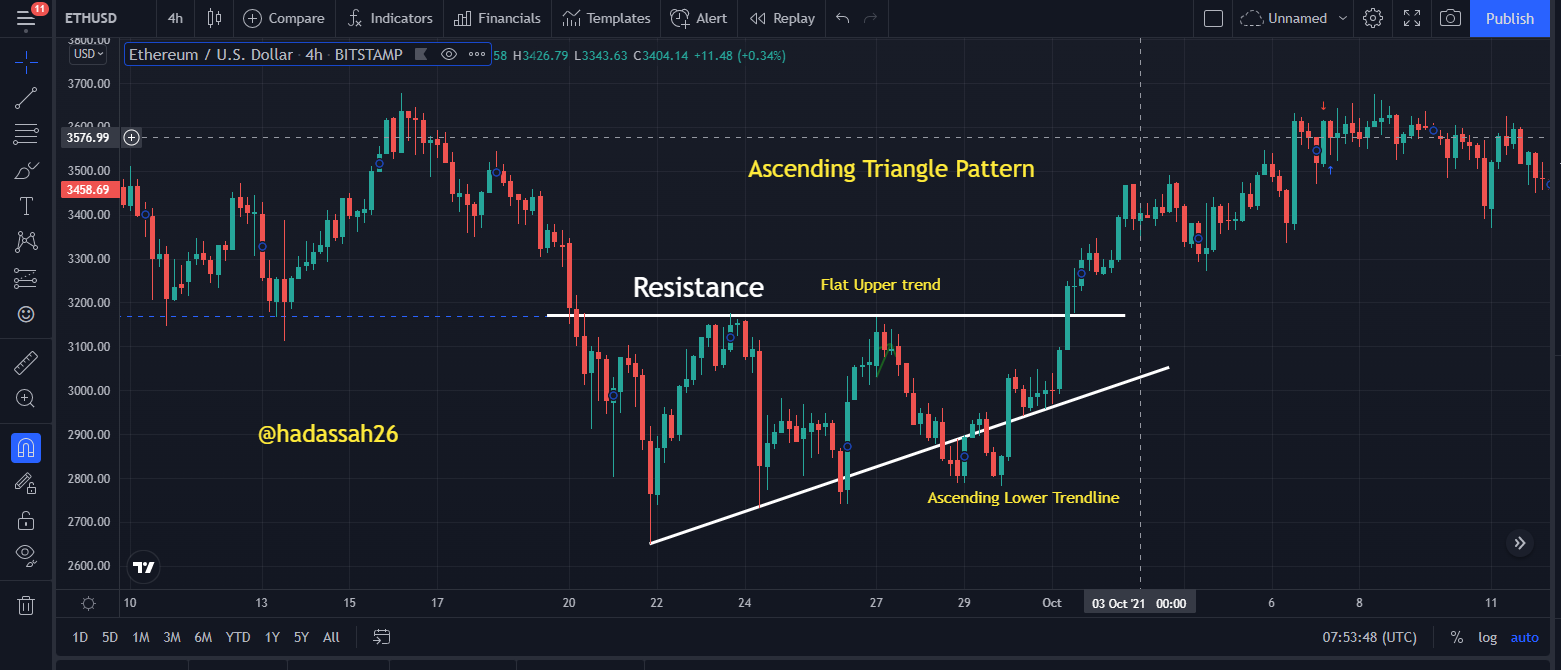
Ascending Triangle
This type of triangles patterns are mostly seen in a bullish market, it occurs after the market has been making a bullish trend for some while and consolidates for some time. During the consolidation, the Ascending triangle pattern is formed, it is made of mostly higher lows and some highs that show how prepared the buyers are willing to continue to take over the market that they had previously held.
The Ascending pattern is made of two trendlines: which are the Flat upper trend line and the ascending lower trendline. The flat upper trend is resting on a major resistance on the market, the resistance is preventing it from passing while the ascending lower trendline consists of higher lows moving in the upward direction.
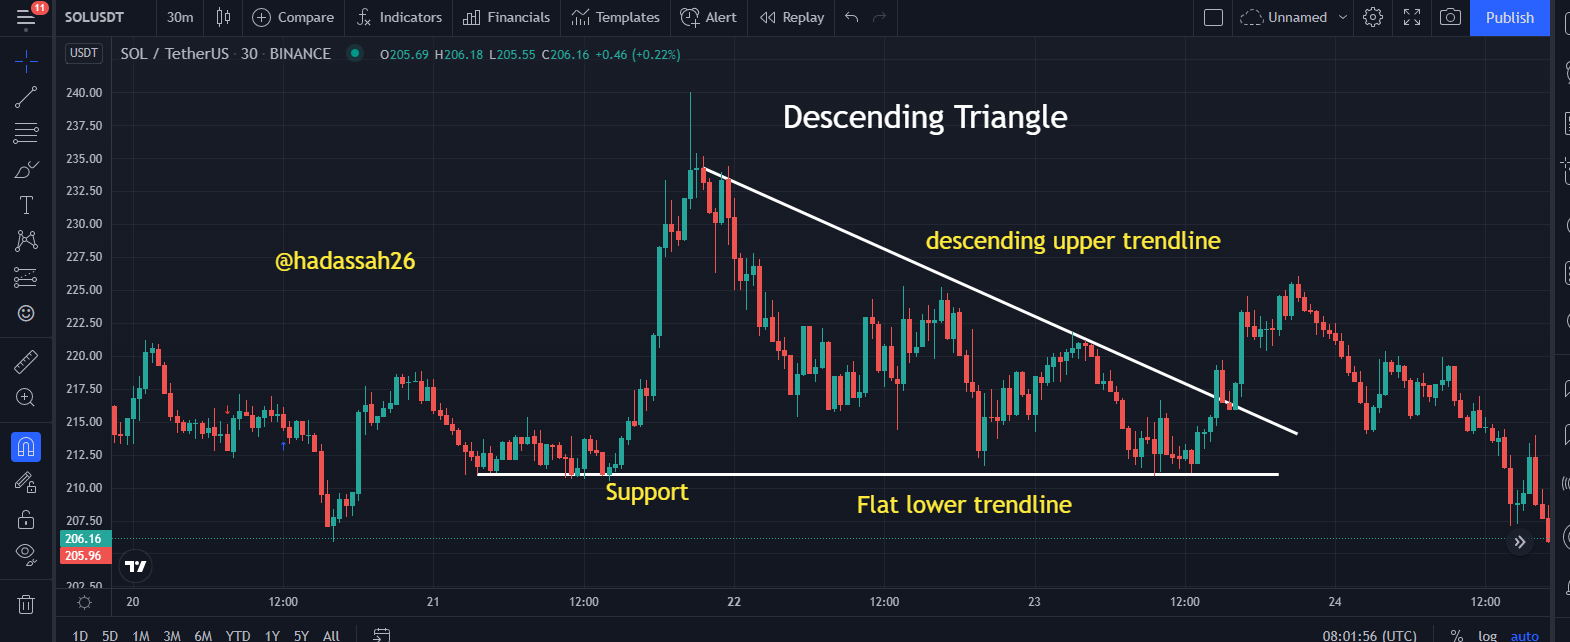
Descending Triangle
Descending Triangle is the reverse of the ascending triangle in terms of its direction, which is the bearish direction. This type of pattern is mostly seen in the bearish trend. It occurs after the price has been on a downward trend for some time, and consolidating, in the process of consolidation, it forms the descending triangle pattern. The descending pattern consists of two trendlines.
The Flat lower trendline and the descending upper trendline. The flat trendline sometimes shows a strong support line that is not allowing the price to go down while the descending upper trendline shows the descending lower highs which shows that sellers are overtaking the buyers in the market. The moment the price breaks through the support line below, it will continue in the downward direction.
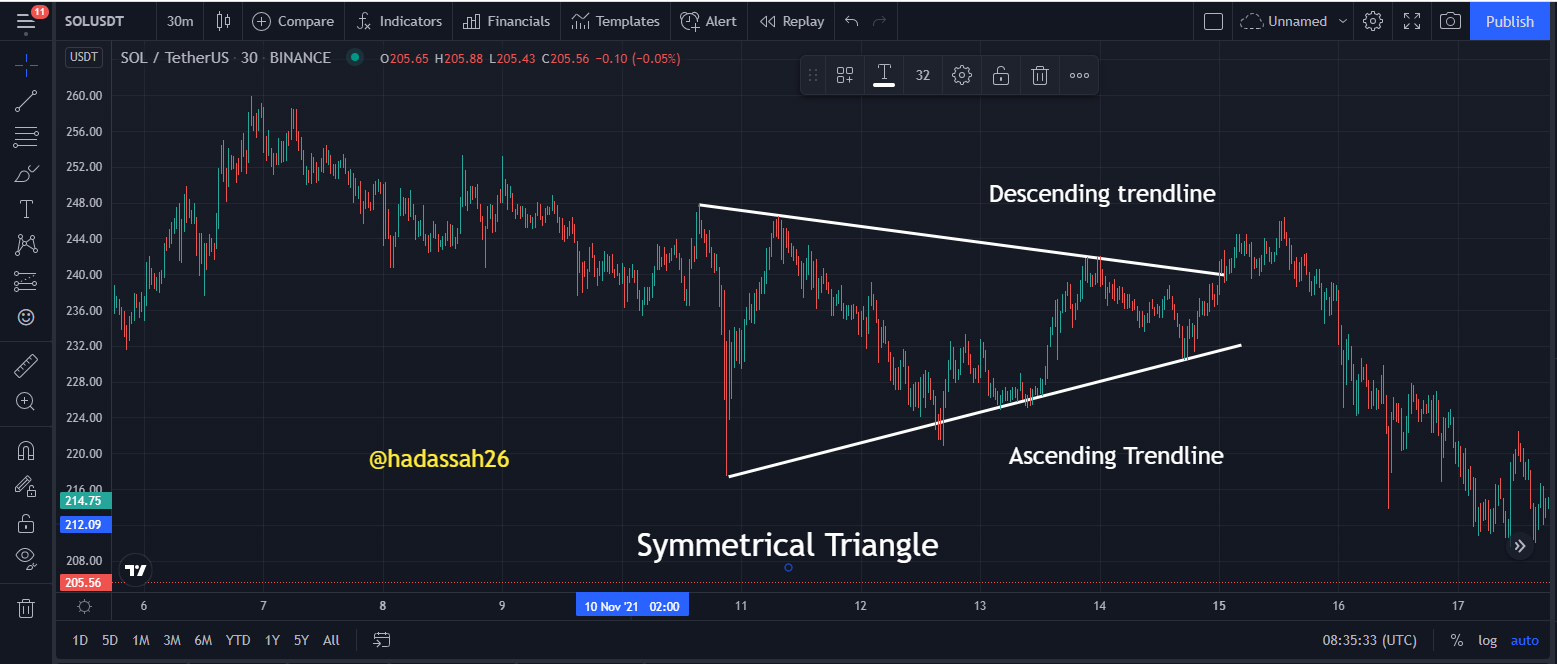
Symmetrical Triangle
The symmetrical triangle is a unique triangular pattern that has its uniqueness. It is different from both the ascending and the descending triangle pattern because it has no flat trendline. It also has two trendlines, one is ascending and the other one is descending.
And both of the trendlines are converging and this makes the triangular pattern a neutral triangular pattern, it can go resultant trendline can go either way, depending on the current trend of the market. If a market is on a bullish trend, when the symmetrical triangle is formed, it can break the upside and continue its movement in the upward direction. But if the current market is on a downward trend, when the symmetrical pattern happened, the price will break the downside and continue on a bearish trend.
2. Can we also use some Indicators along with it Triangle Patterns? Explain with Screenshots.
The triangle pattern is a wonderful pattern that has been used in time past by so many traders and it has proven to be successful, but it can not be used alone all the time to have a huge profit from the market. So for a long Confluence was introduced to the market, What is Confluence? This is the combination of more than one indicator or chart pattern in the market to give you an adequate result. So for the Triangle pattern to be used effectively, it has to be combined with another technical indicator.
A combination of the Triangle pattern with another technical indicator increases the possibility of you becoming more successful in the market. Combining the triangle pattern with the right technical indicator will correctly tell you the next direction of the trend, like in the case of the symmetrical triangle pattern.
It can also tell accurately the right entry point and the right exit point of the trend at any given time frame and any crypto pair in the market.
One of the technical indicators that can be used alongside the triangle pattern is the Stochastic oscillator. The Stochastic Oscillator is a volume-based indicator that shows you overbought and oversold, which are the two regions of the indicator. The Stochastic oscillator increases your chances of being more profitable when combined with the Triangle pattern.
The Stochastic Oscillator ranges from 0 to 100 levels. It comprises three regions in the range. The first is from the Overbought Region which ranges from the 80 - 100, the second is the neutral region, which is from the 20 - 80 region while lastly, we have the oversold region which is from the 0 - 20 region.
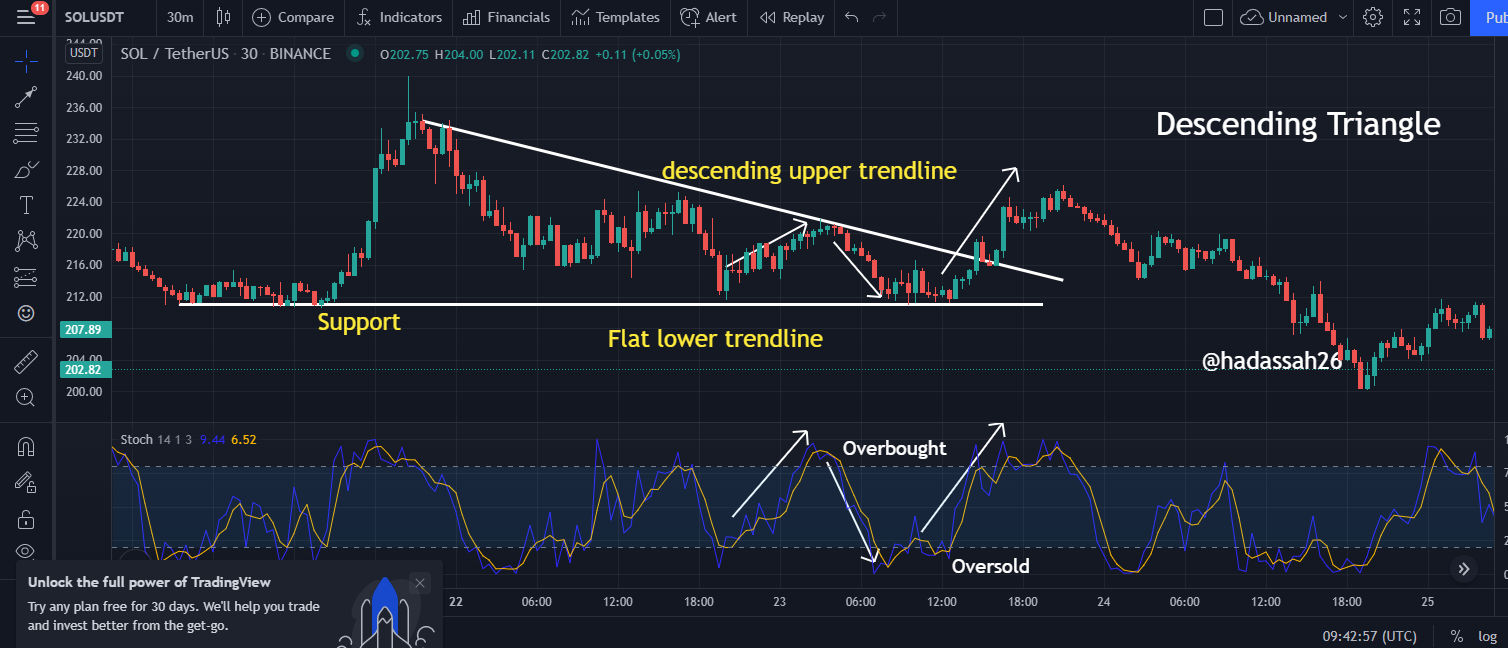
From the above, we can see how to combine the descending triangle pattern and the stochastic oscillator. Let's know how to use it effectively, for a buy order, the price must touch the flat lower trendline, and also the stochastic oscillator must also be at an oversold position, for you to execute a buy order while for a sell order, the price needs to have touched the descending upper trendline and the stochastic indicator must also show an overbought sign before you can sell. Over-bought normally shows that the buyers are exhausted while oversold shows that the sellers are exhausted.
3. Explain Flags in Trading in your own words and provide screenshots of both Bull Flag and Bear Flag.
As I said earlier that there are many chart patterns that available in the market, there is also the flag pattern, Flag pattern are the pattern that shows trend continuation after a quick rally is formed in either the upward direction or the downward direction.
During a trend, be it a bullish or a bearish trend there is always the form of a consolidation, which can be a channel or a rectangle depending, and this normally reduces the volume of the market at that time. After the consolidation, the price normally breaks through the Flag pattern and continues in that trend.
There are basically two types of flag pattern available
- Bull Flag Pattern
- Bear Flag Pattern.
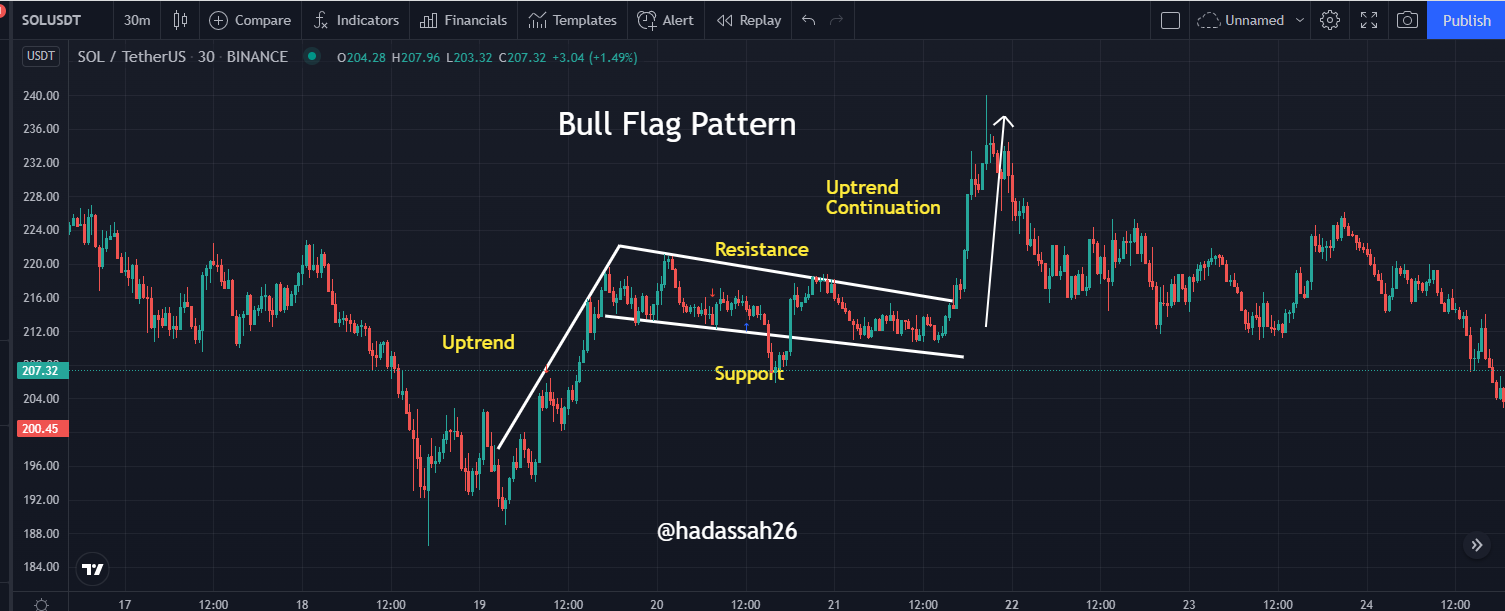
Bull Flag Pattern
This type of flag pattern is formed during a bullish trend. The Bullish flag pattern is a trend continuation pattern. The pattern begins with the flag pole which goes up for some time and then consolidates, to form a channel. The channel is made up of two trendlines which accurately determine the channels. They are parallel
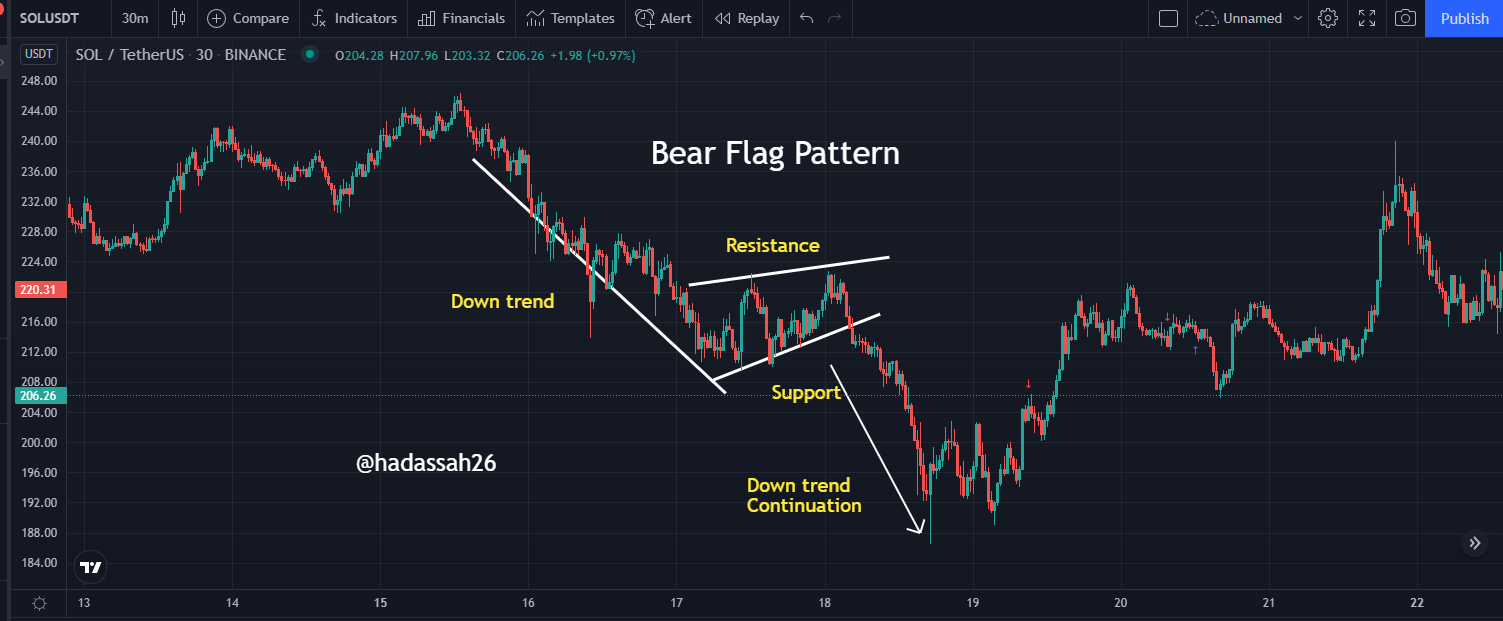
Bear Flag Pattern
This flag is similar to the bull flag pattern but it is in the opposite direction. The direction we are talking about is the bearish direction. The bear flag pattern is also a trend continuation pattern but in the bearish direction. Sellers normally wait for the formation of the bearish flag pattern.
This normally occurs during the bearish trend of the market, The price consolidates for some time, and during the consolidation, it forms a rectangle or channel, that channel is called the bear flag and the channel, the bearish movement of the price continues, but before that channels, it normally forms a flag pole also.
The volume of the price is also reduced in the formation of the bear flag, during the period the seller tends to gather momentum for the next downtrend.
4. Show a full trade setup using these Patterns on any Cryptocurrency chart. (Ascending Triangle, Symmetrical Triangle, Bear Flag)
Let me quickly show you how to make a true trading setup for Ascending Triangle, Symmetrical Triangle, and Bear Flag Pattern.
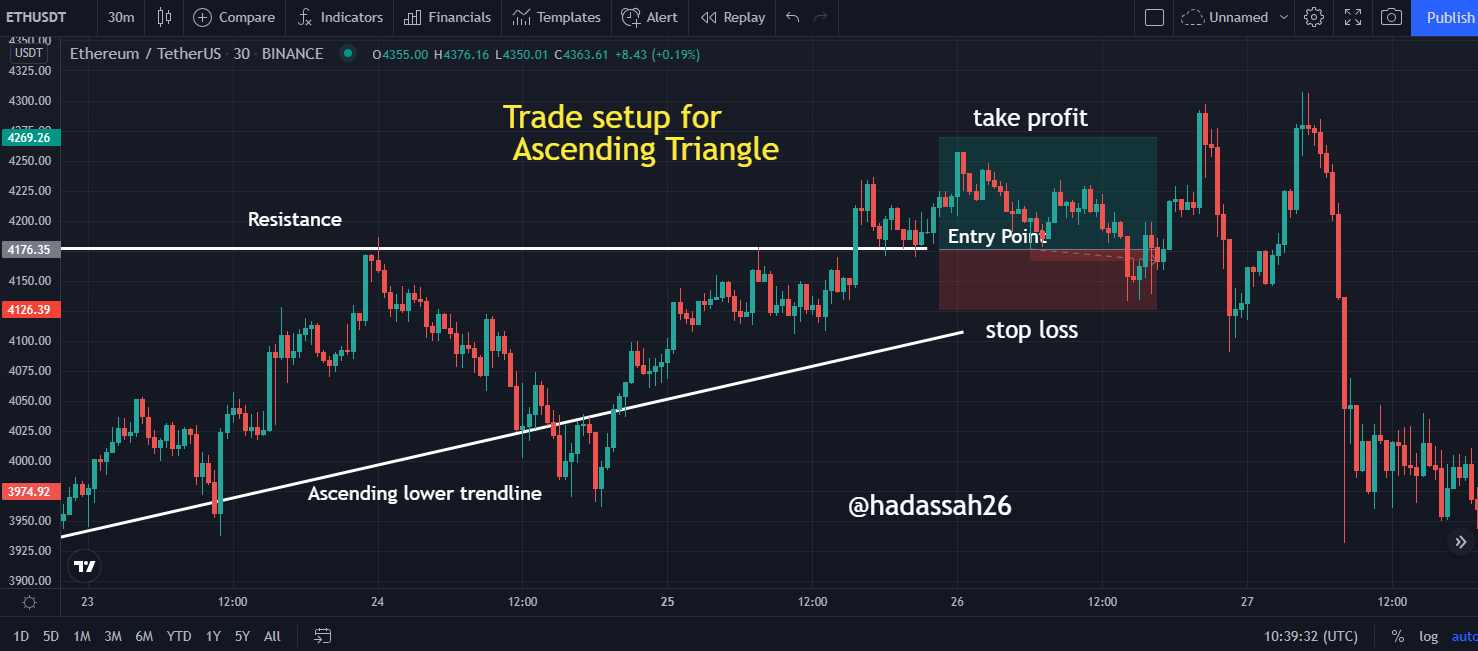
Ascending Triangle Trading Setup
We know that the Ascending Triangle is for bullish trend, so this simply means that the buyers will take charge of the market at this period, and the market is on an upward direction. After some time the price gets to consolidate, before the final break
The trend is resisted by the resistance line at the top of the chart, the resistance line is usually flat while at the bottom, we have a rising lower trendline, also forming support below and it also serves as a guide to the price. The two trendline forms a converging trend, pushing the trend further up until it breaks through the resistance line, and at that moment you should execute your buy order which should be your entry point, and place your stop loss before the rising trendline and using risk to reward ratio of 1:1 to place your Take profit.
You can see it below from the chart.
Symmetrical Triangle Trading setup
Knowing that the symmetrical triangle is a neutral pattern, you should be prepared for any of the trends, be it a bullish or bearish trend.
You should carefully check for the current price trend of the market whether it is a bullish or bearish trend. If bullish you should be waiting to enter a buy after the breakout but if bearish, you should be ready to enter a sell order after the breakout. From the chart, it was on a bearish trend, so I waited for both the trendlines to converge. We can see from the chart that the breakout occurred at the downtrend and it signifies a bearish order which means that sellers take over the market.
At the moment I confirmed the breakout, I place a sell order, which is my entry point. Using my upper line, I used it to determine my stop loss, and using the risk to reward ratio of 1:2 I determine my take profit take.
You can see the chart for proper understanding.
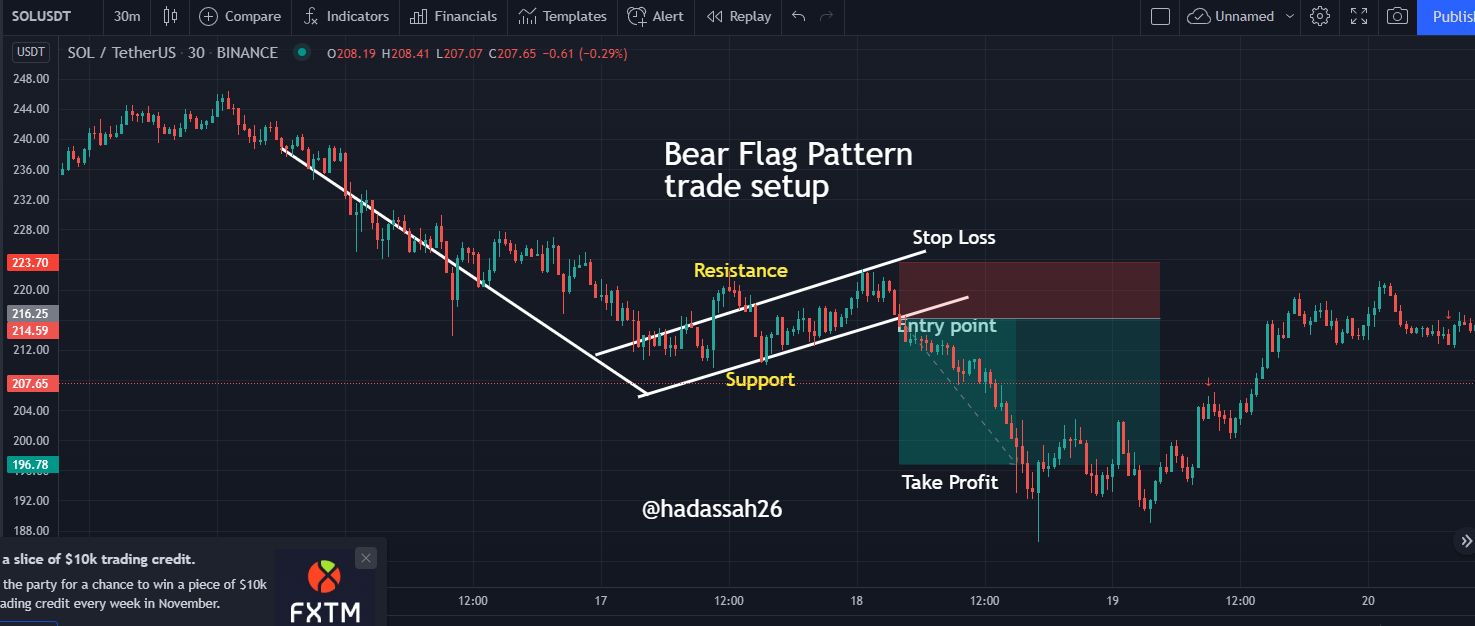
Bear Flag Trading Setup
The bear flag simply means that this is the pattern for the bearish trend continuation. Firstly the flag should form a pole, and from the chart, we can see that the pole is already formed. After the formation of the pole, the price will begin to consolidate which will form a channel and all these can be seen from the chart below.
In that channel, you should wait for the price to break through the support, this is done after you must have drawn your channel properly.
The entry point should be at the point where the breakout occurred, you should enter a sell and place your stop loss at the resistance above, then using your risk to reward ratio of 1:2, properly calculate where your take profit should be.
You can see it from the chart below.
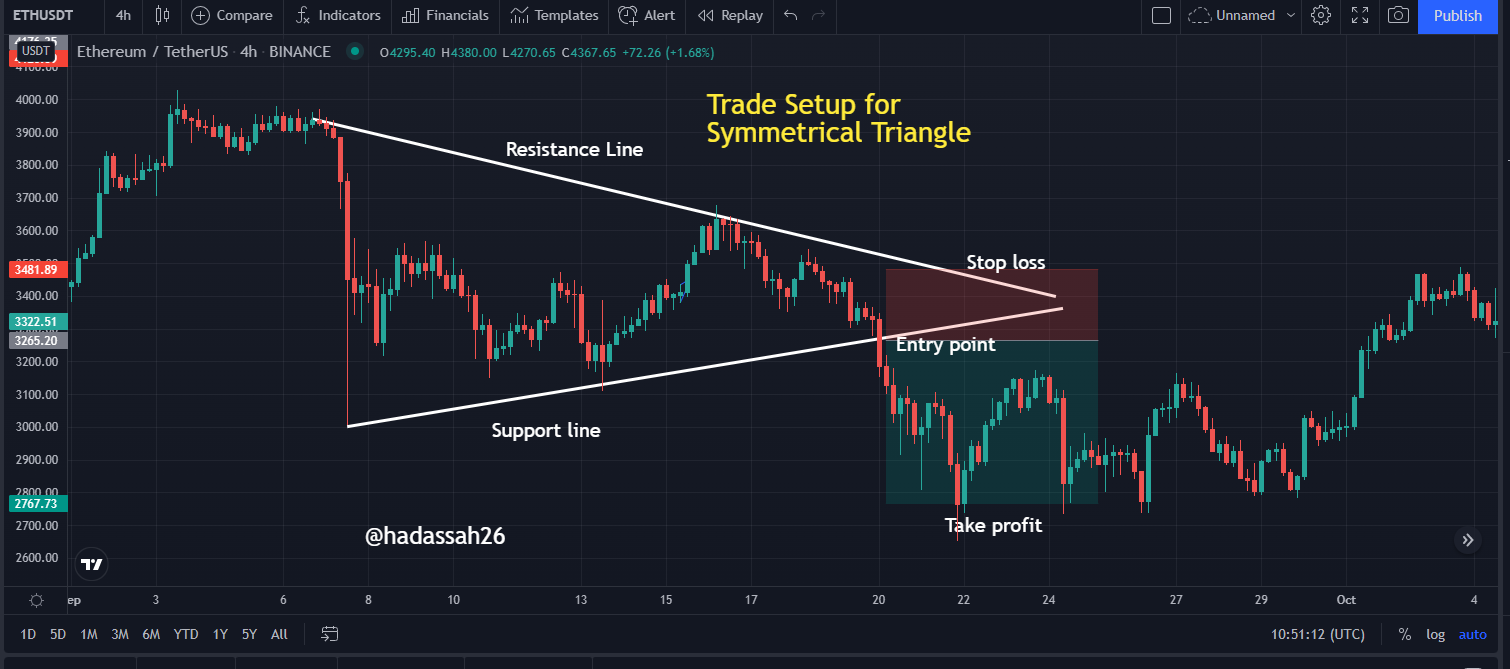
Chart patterns have been used for a long period and they proved to be worth it by providing profit for millions of trading out there. We know that there are many types of chart patterns in the trading market and even up to today more are still coming out. But knowing how to use the triangle trading and the Flag patterns, the triangle pattern consists of Ascending, Descending, and symmetrical patterns while the Flag is made up of the bear flag and bull flag pattern.
Knowing how to use them effectively with the combination of any other technical indicator is a big plus to you. They are used for both the bearish and the bullish markets. They can be used for any time frame provide you can use them properly.
Give them a try if you have used them before so you can be a profitable trader in the market.
Cc:@sachin08