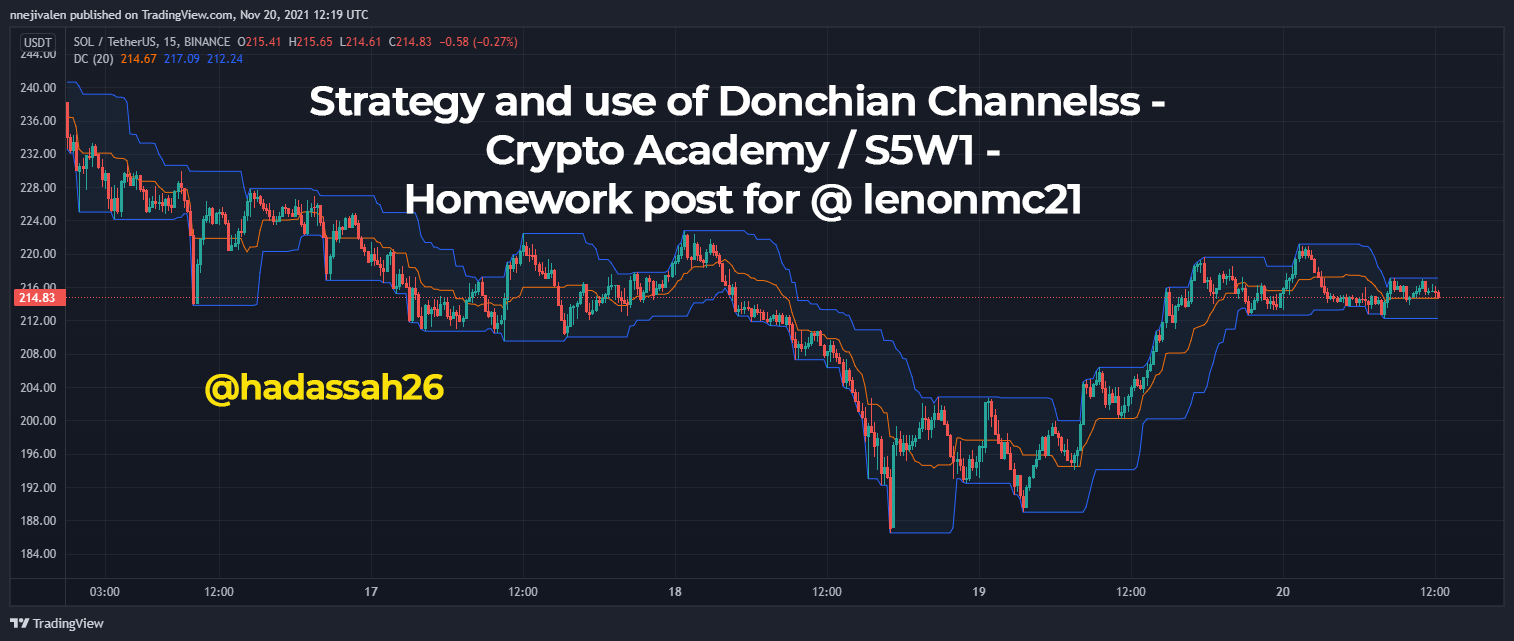
Strategy and use of Donchian Channelss - Crypto Academy / S5W1 - Homework post for @ lenonmc21
i'm glad to be part of the Steemit Crypto Academy

Explain and define in your own words what Donchian Channels are?
The usage of Technical analysis has grown in the market, and this has led to the invention of many technical indicators in the market today. These indicators are numerous and some of them sound new to you. Today we will be looking at one of the most wonderful technical indicators that are being used.
The Donchian Channel was invented by Richard Donchain, the Donchian Channel consists of 3 lines that are being gotten and calculated from the moving average. The 3 lines are the upper, middle, and lower bands of the market at the particular time frame. In the Donchian Channel, the upper band marks the highest price of a market over a particular, and the lower band is used to indicate the lowest price of the market over a particular period. The Donchian Channel is usually seen between the High and the low band.
The Donchian channel looks like the Bollinger bands, it is very easy to locate on the trading platform. Donchian Channel provides signals for long and short orders. In an unstable market, the Donchian is used to properly utilize the trend. Donchian channels normally compare the relationships between the current price and the trading range of a particular period. The upper bands also show the extent of the bullish energy, it shows the highest price that is being reached for a particular time.
In the market, the Donchain can be used to determine the entry point, exit point of the market. It can slow be used to confirm a breakout and also the trend reversal of the price. And finally, the Donchian channel is used to check how stable the market is. It is also used to determine our Volatile the market is.
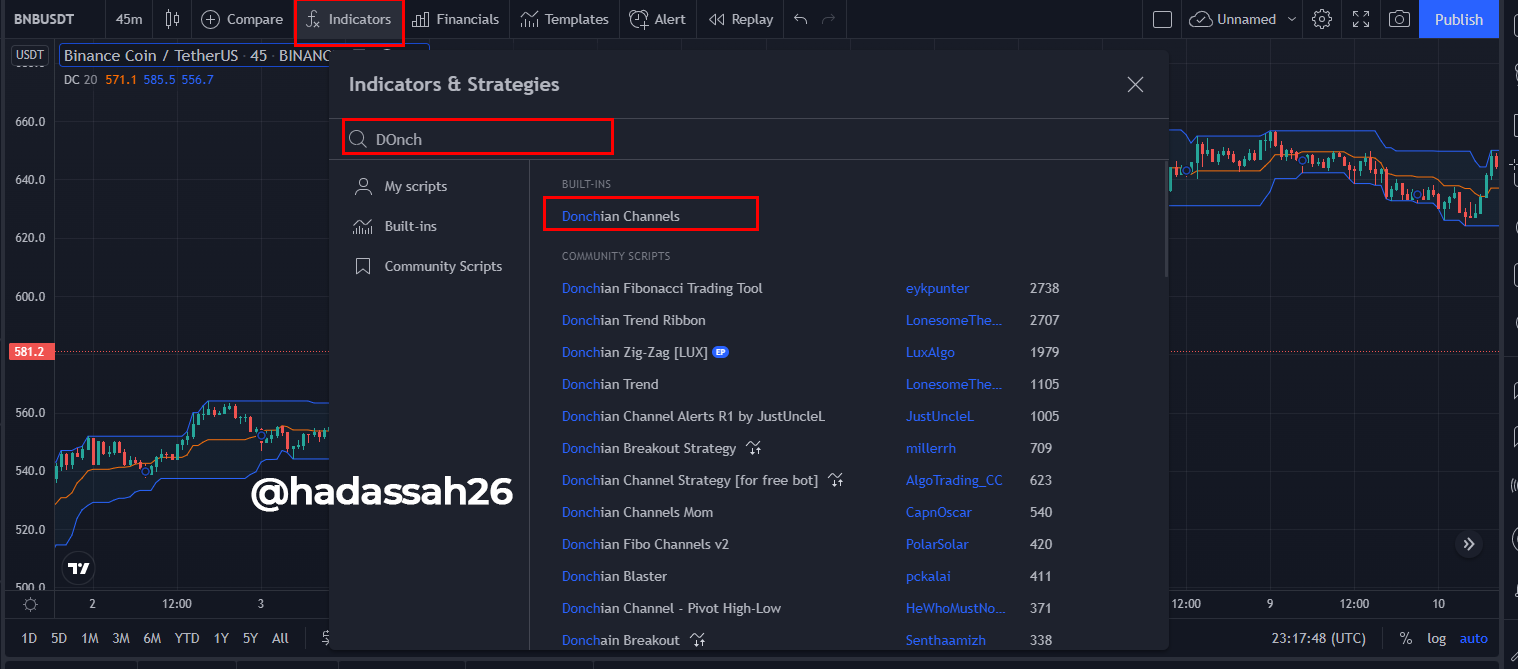
A simple analysis on how you can add the Donchain Channel into the market
Do you explain in detail how Donchian Channels are calculated (without copying and pasting from the internet)?
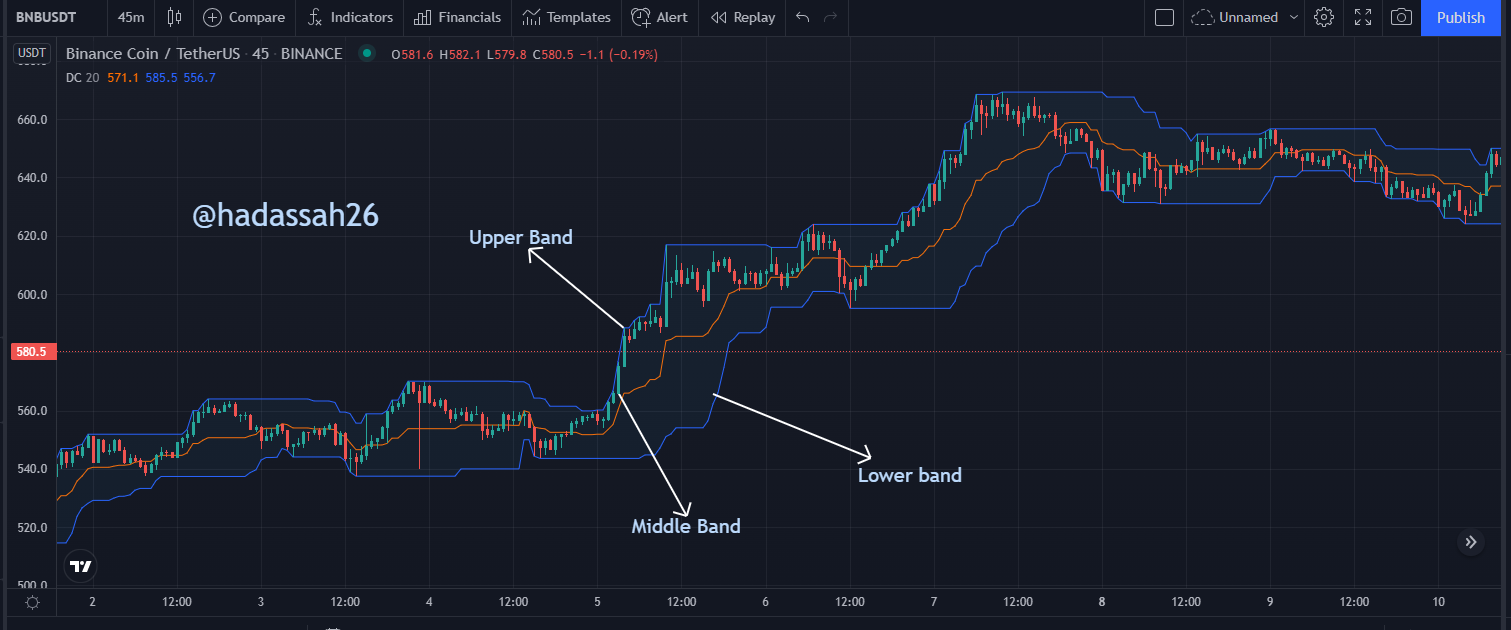
I earlier said consists of 3 lines which are the upper band, lower band, and middle band.
Let represent the bands with the following
Upper Band (UB) = Highest Value in the last N period
**Lower Band (LB) **= Lowest Value in the N period
Middle Band = MB
The middle band is the average of the Upper and the Lower Band, which is
MB = (UB + LB) / 2
N= Time frame (Number of Minutes, hours, days, weeks, etc)
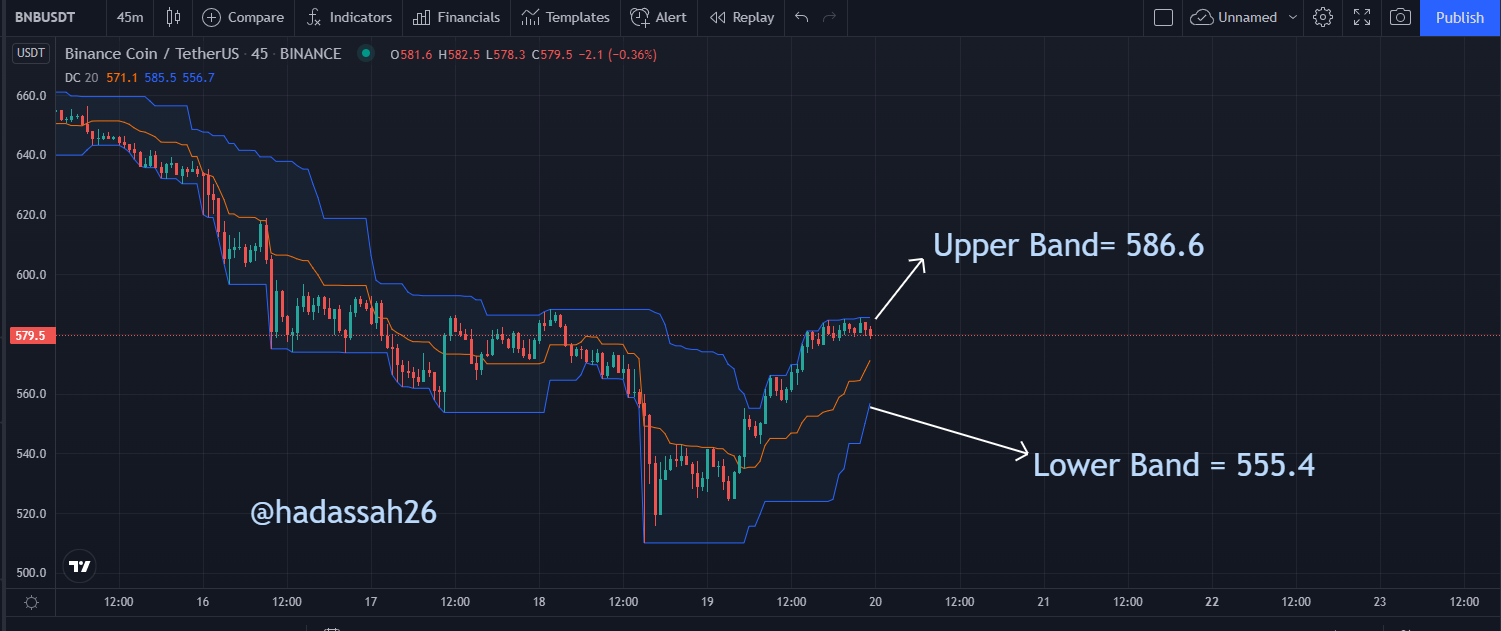
From the chart above, let us calculate this
The Upper band which signifies the highest price of the market for the last 20 candlesticks in a 45 mins timeframe =586.6
The Lower band which signifies the Lowest price of the market for the last 20 candlesticks in a 45 mins timeframe =555.4
Average sum or the middle Band = (586.6 + 555.4) / 2
Donchian Channel =1142 / 2
Donchian Channel = 571
Explain the different types of uses and interpretations of the Donchian Channels (with examples of bullish and bearish trading)?
The types of uses includes the following
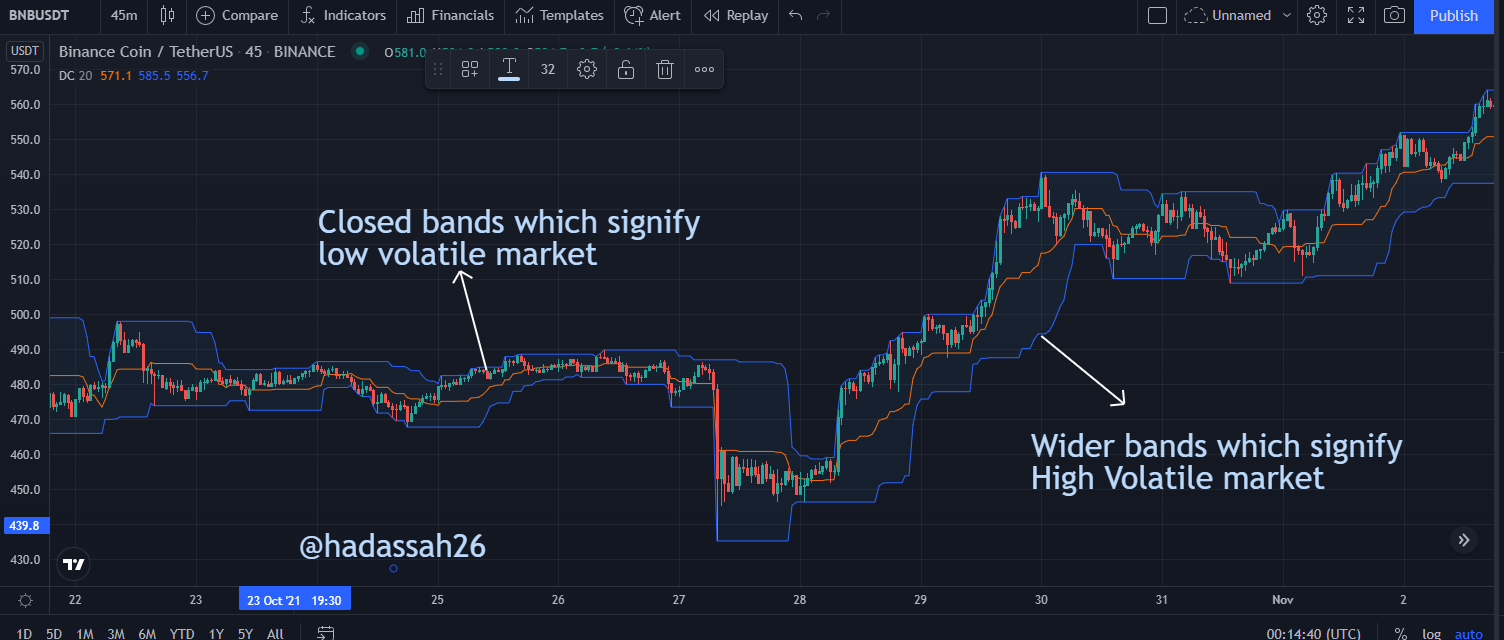
Volatility: this is one of the most common interpretations of the Donchian channel. I said earlier that the Donchain Channel is used to determine how volatile the market is. How does it do that? If the Band becomes wider, it signifies a high volatile market but when the band's space becomes smaller, it signifies a low volatile market. the closed bands also signify a ranging market. An example can be seen below.
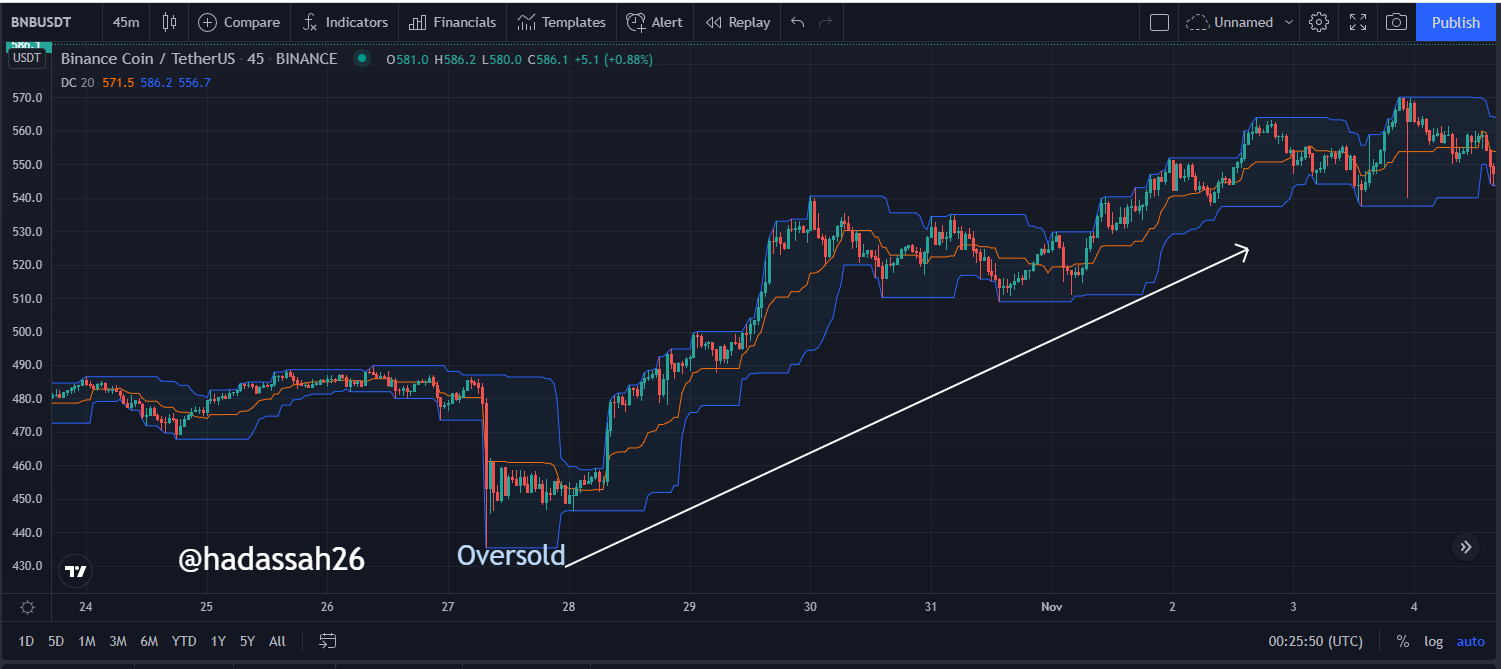
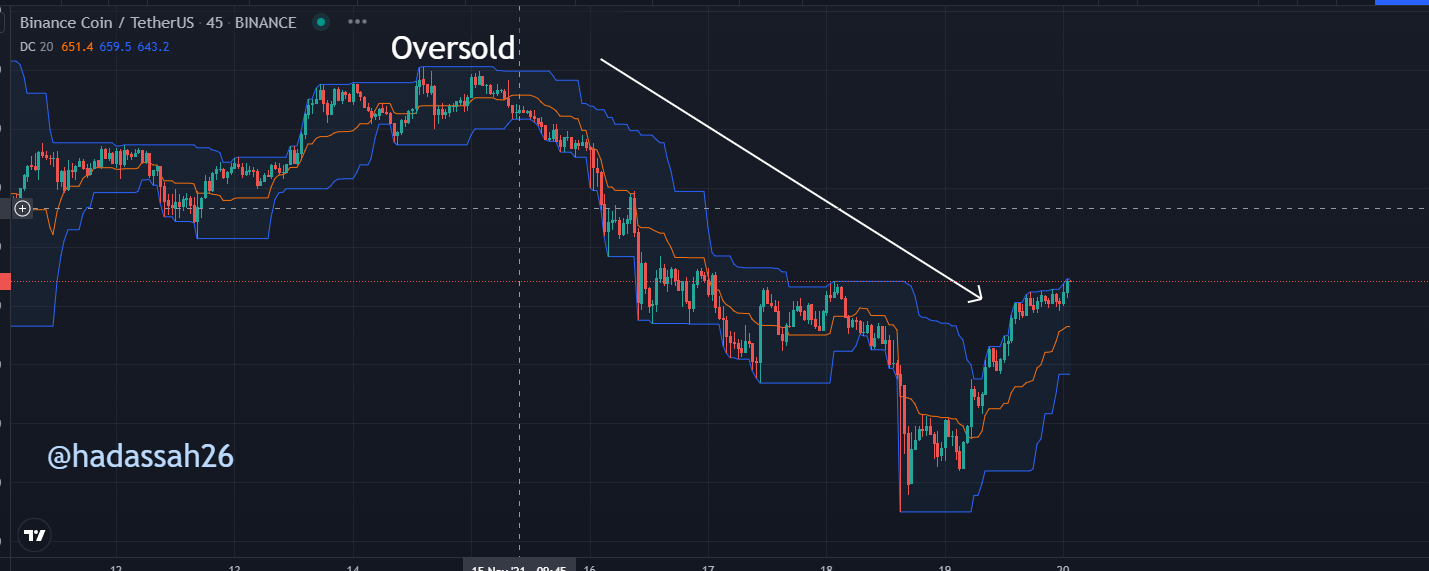
Overbought and Oversold: there is another important interpretation that is done by the Donchian channel. It can be used to know when a price is overbought or the price is being oversold. If the price reaches the upper band of the Donchian channel, this simply means that the price is being over-bought and there is a probability of being a possible reversal. While if the price touches the lower band of the Donchian channel, this signifies the oversold, there is a possibility of a trend reversal.
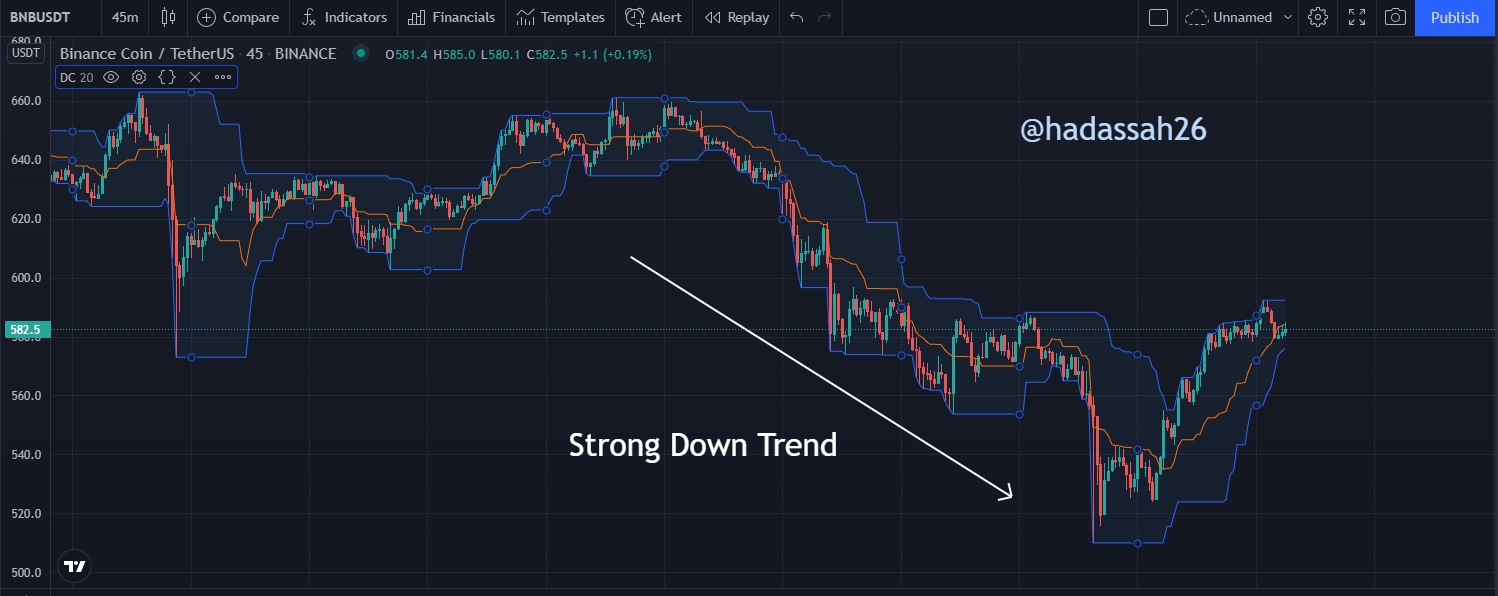
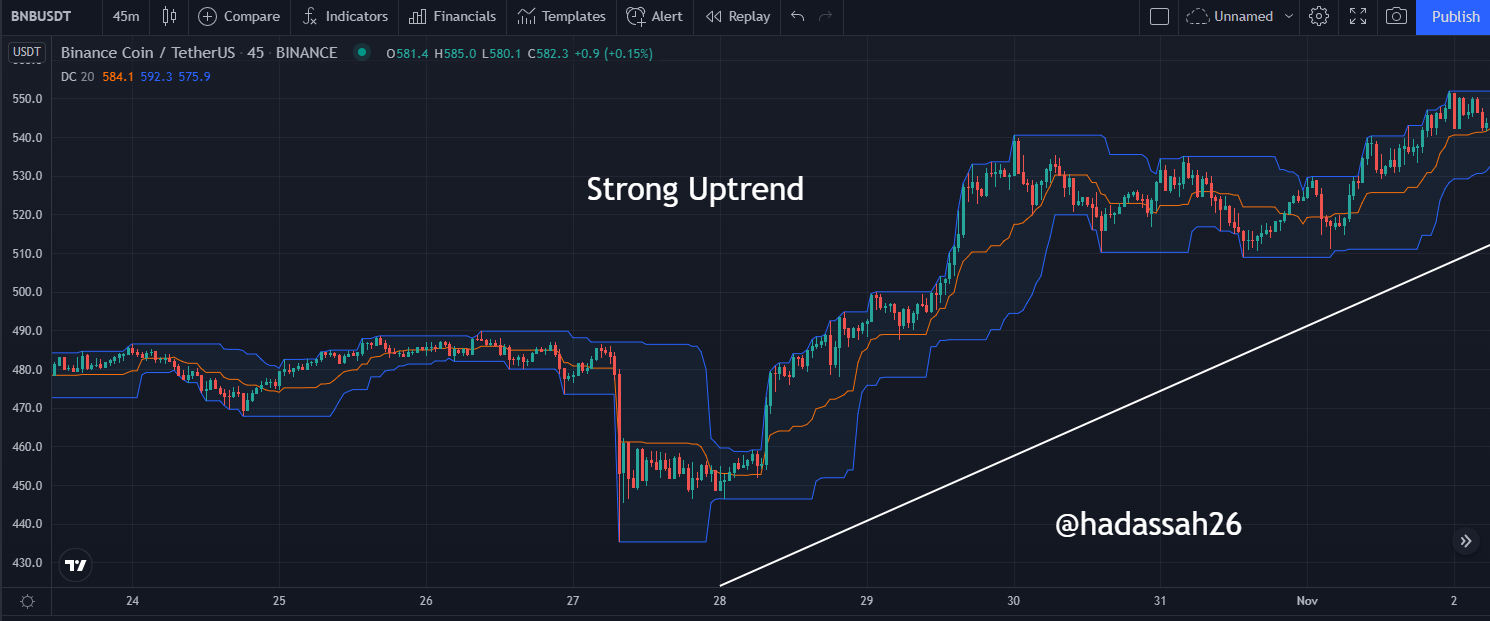
Strong trends and key zone break: the Donchian channel is also used to determine how strong a trend is. When you notice that the price reaches either the upper bands or lower bands and tends to move towards that same direction, pushing the bands to go with it, this signifies that the trend is very strong and it can even break some major point of resistance and support.
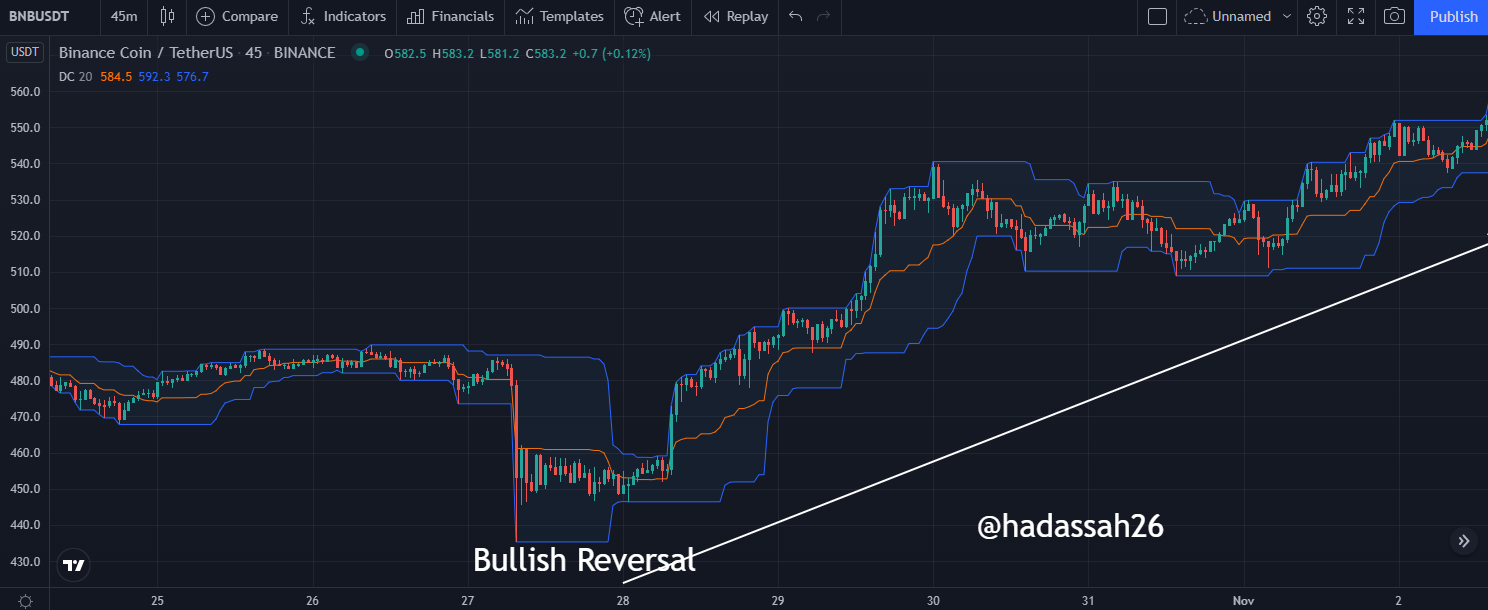
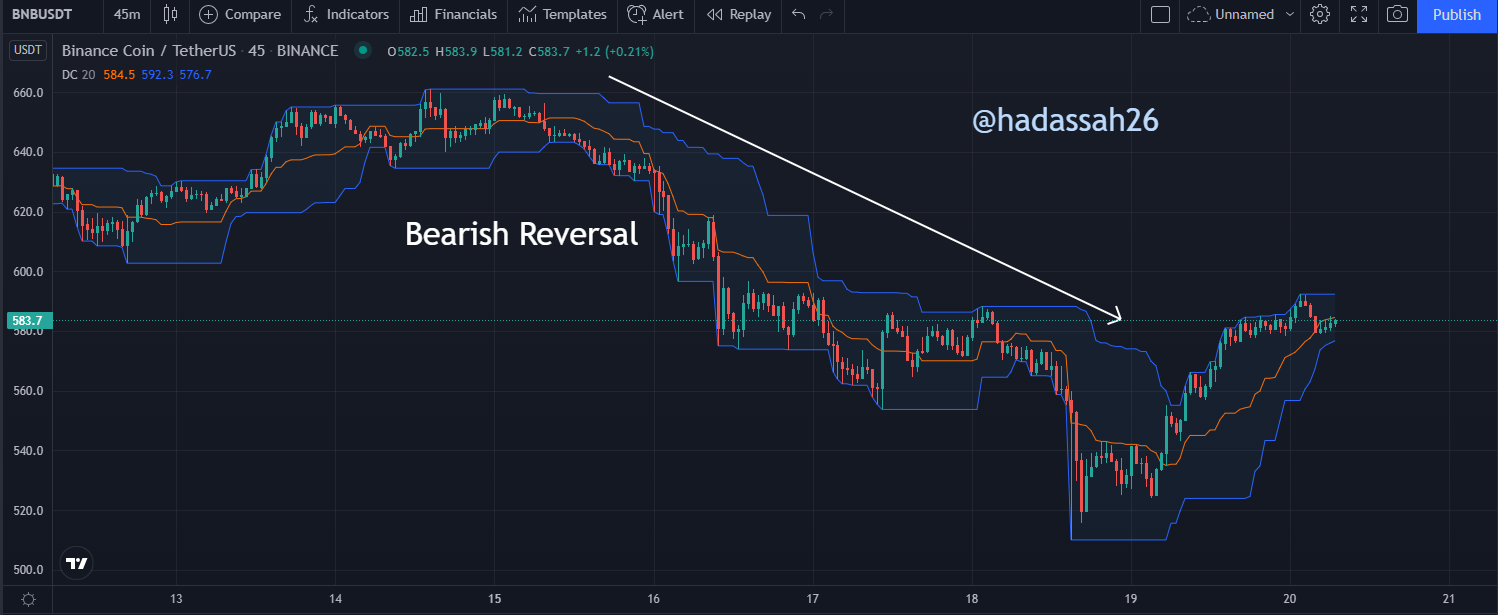
To also determine Trend Reversal: if you notice, when we spoke about the oversold and overbought conditions, you will notice that the price usually reversed after the condition. This signifies that you can still use the donation to determine when a trend is about to reverse. When it reaches the upper band it tends to make a downward reversal while when it reaches the down band it tends to make an upper trend.
1. Make 1 entry using the "Donchian Channel Breakout Strategy" and make 1 entry using the "Reversal and Retreat Strategy". You must explain the step by step of how you analyzed to take your entry and make them in a demo account for me to evaluate how the operation was taken.
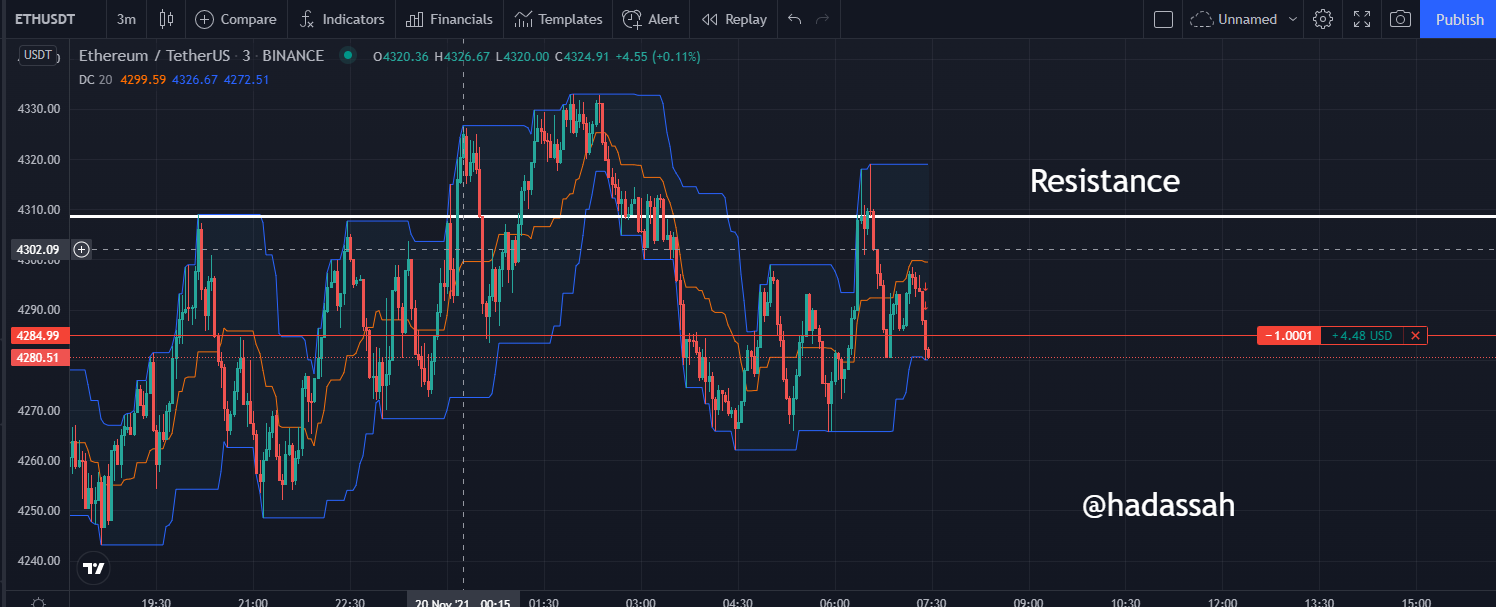
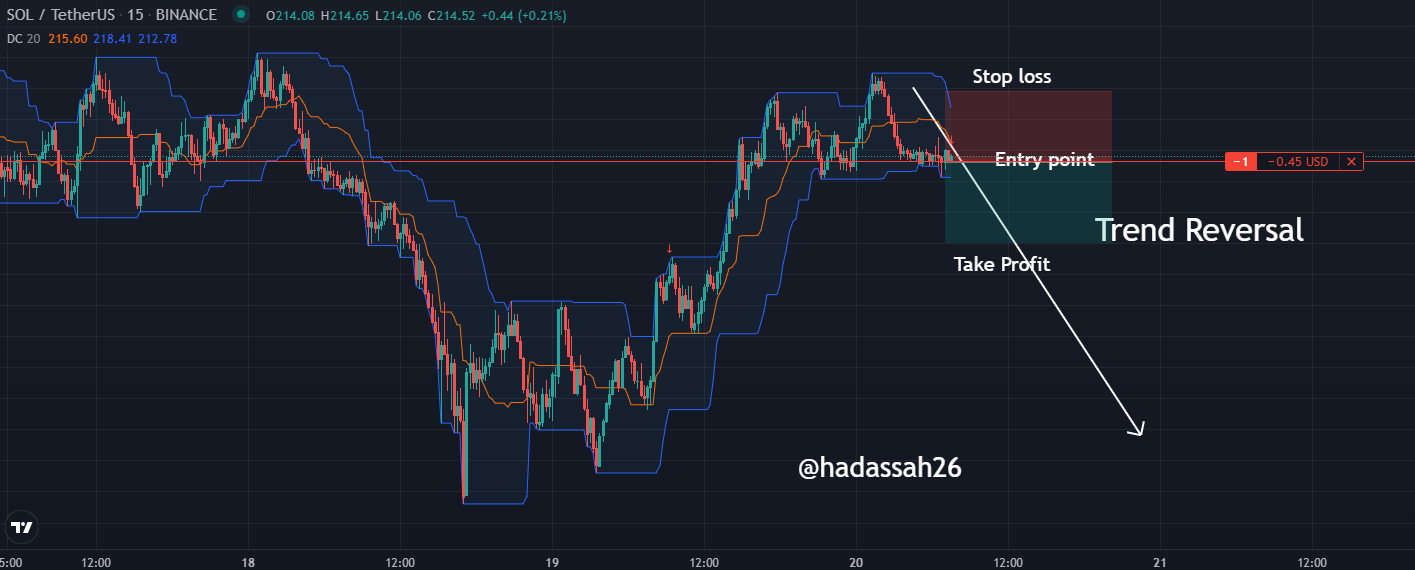
Donchian Channel Breakout Strategy
Looking at this chart below, you can that the resistance level was close and the price just tested the resistance level and it is going down, so due to that I entered a sell order and place stop loss at the upper band. With risks to reward ratio of 1:2, I placed my take profit
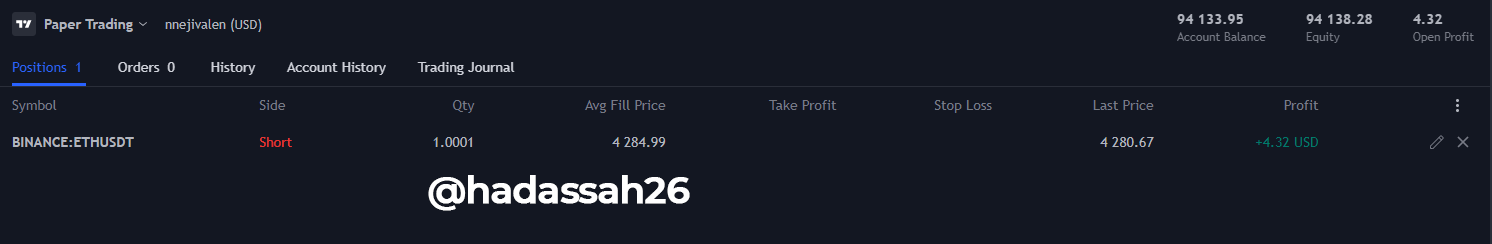
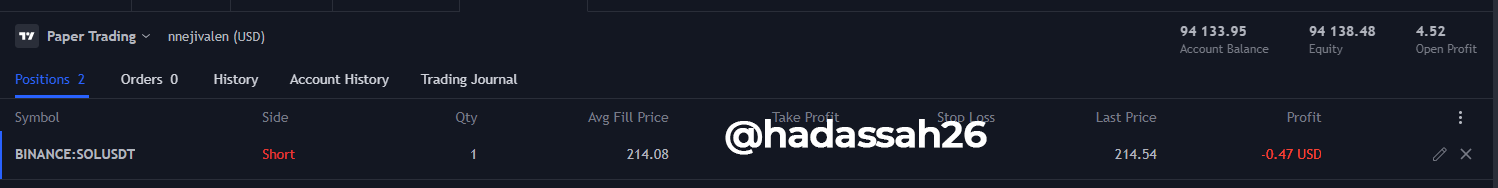
Reversal and retest strategy
we can also see from the chart that the price has reached its overbought level and you see that the bearish reversals started, so I also entered a sell order,dropping my stop loss closer to the upper band and with a risk to reward of 1:2 is placed my take profit
Donchian Channel is a very good technical indicator that is rarely used by traders maybe because most of them are unaware of the importance of this indicator. Donchian can be used to determine if the price is oversold and if the price is overbought, you can also use it to determine how volatile the market is and you can also use it to know the trend of the market and check for trend reversal and other useful features. It is time for us to explore the indicator properly and enjoy the useful profit.
Cc: @ lenonmc21
@steemcurator02