Trading Crypto with On-Balance Volume Indicator - Crypto Academy / S5W4 - Homework Post for @fredquantum.

I have always stressed the importance of using a technical indicator in the crypto market. The technical indicator helps makes our trade easier and help us to provide tangible profit for us and also technical indicators provide us with good entry point, exit point and also tell us when a trend is strong or weak, it can be used to also determine the direction of the trend.
Today, we will be looking at a particular technical indicator, called the On-Balance-Volume (OBV) indicator, the On-Balance-Volume Indicators created by Joseph Granville in the year 1963, which he added the OBV is one of his stock market books. The On-balance Volume Indicator is a momentum indicator used in the crypto, forex, and stock market to determine the fluctuation of the price with respect to the volume. The OBV shows how the price of assets is related to the volume of the assets that are traded. In the market, the OBV is used to know the buying pressure and the selling pressure of a particular commodity or asset. I am sure that we know that the volume of assets determines the direction of the price of the assets.
The OBV indicator uses a cumulative product of several volumes in the market to determine which direction the price we go. So know, we should know that the OBV is a very important indicator if used properly. Knowing how the OBV indicators works, we know that the price moves in only two directions, which is the up and down direction.
If the assets at a particular period have high volume, it will affect the price in the sense of upward direction, which means there will be a high level of buying in the market. It is just like, if a product in the market is highly available, there will be much buying because of the availability of the product at that particular time.
When also the selling volume is high, it will lead to higher selling pressure of the assets, which will, in turn, affect the price, in the sense of price reduction. And in the crypto market, there will be a downtrend.
With the On-Balance-Volume Indicator, you can confidentiality predict the direction of the price of an asset knowing if their direction is either on an upward trend or downward trend.
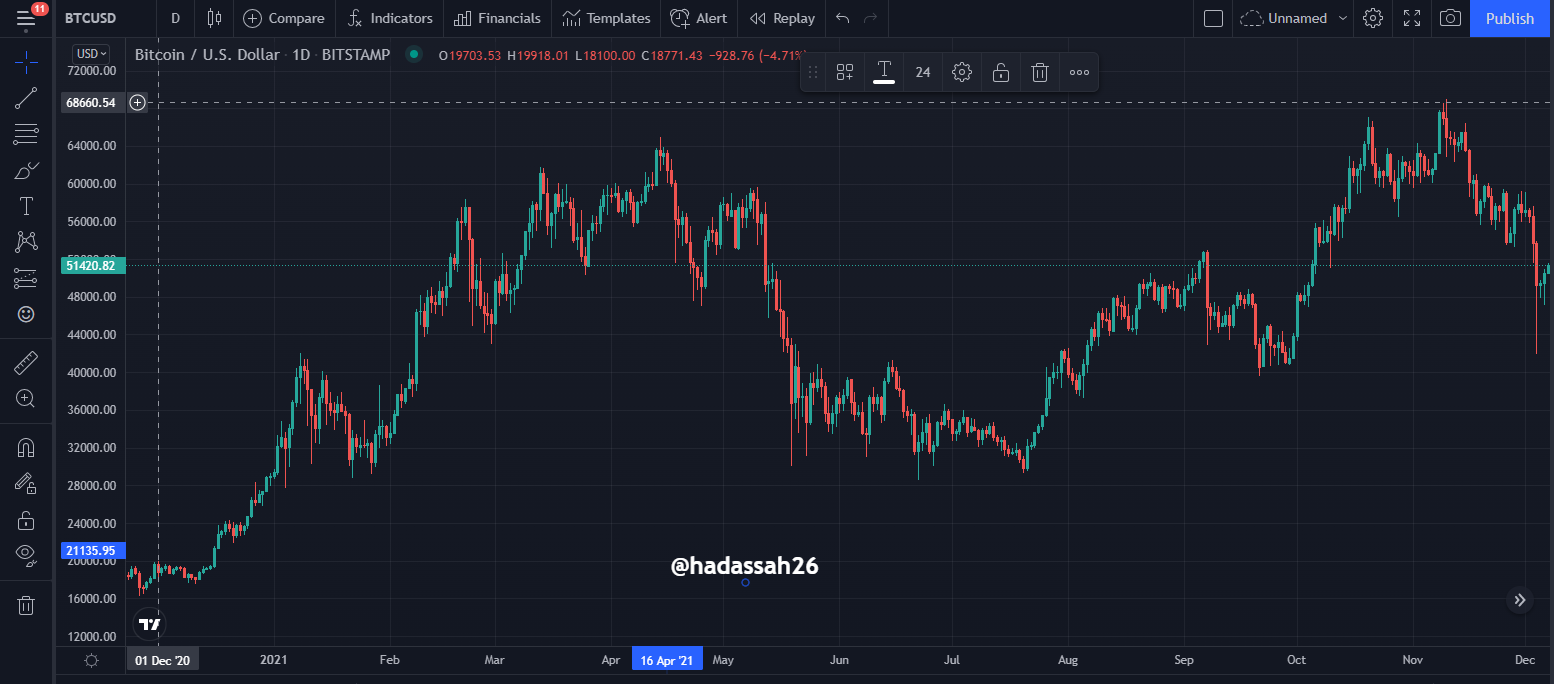
In this question, I will be using the tradingview platform to show you can add the On-Balance-Volume indicator.
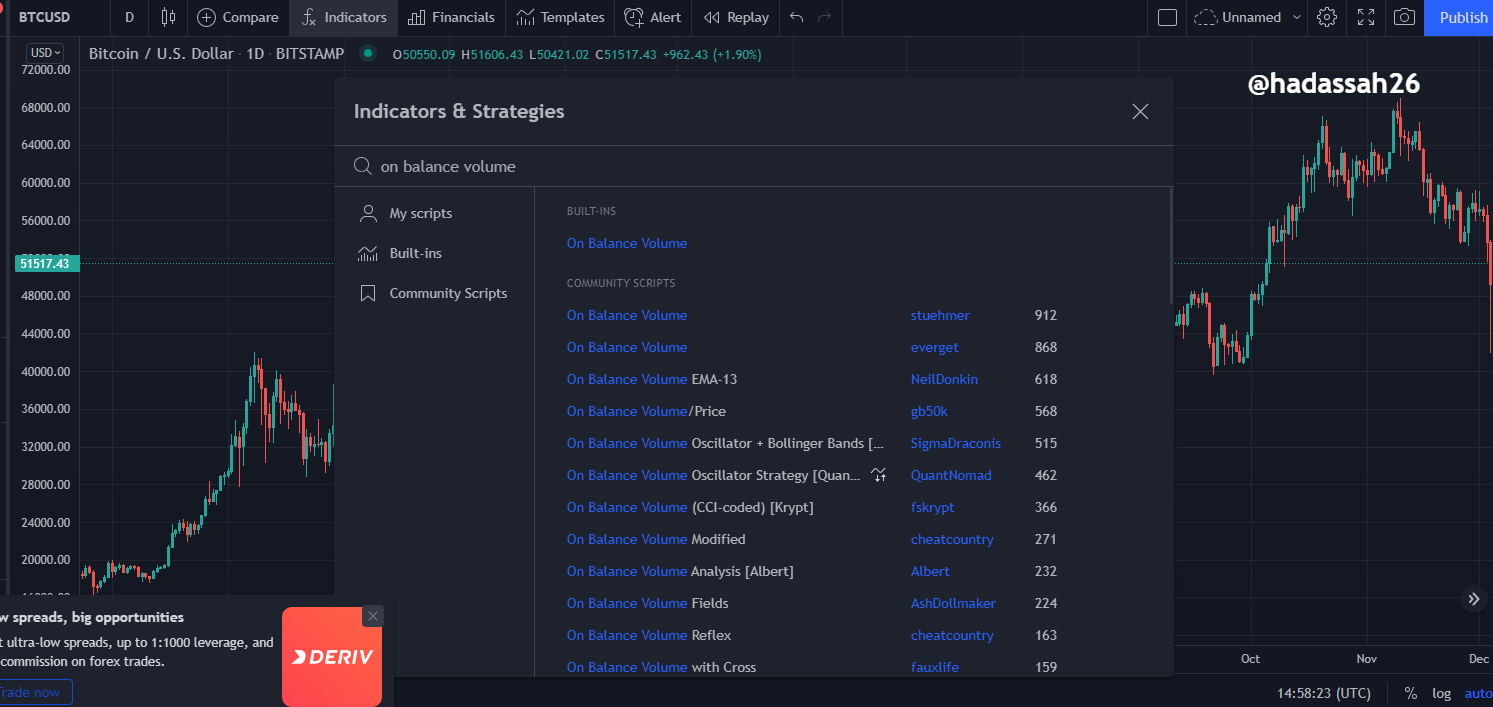
- Then click the indicator, on the search bar, you can type the On-balance volume. And it will pop out, then you can select it
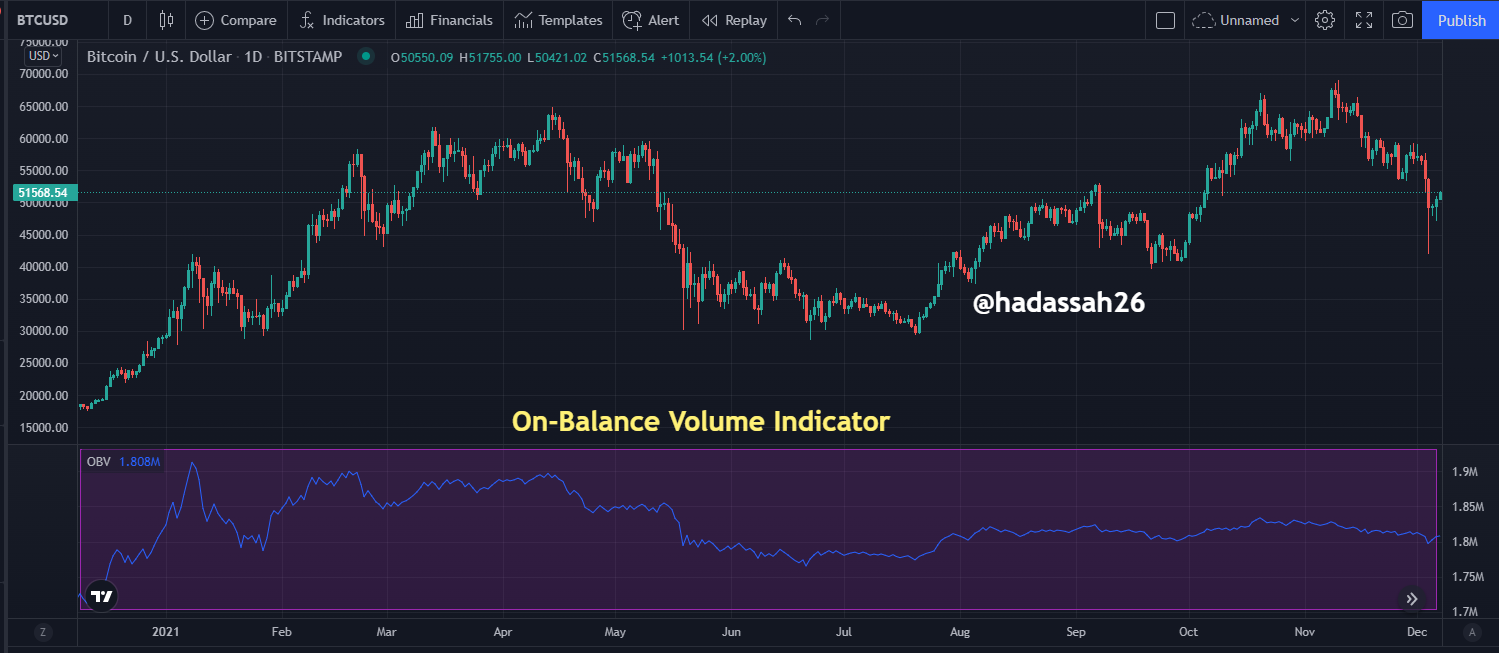
- Then you can see the OBV indicator, with its window on the bottom of the chart.
The On-balance Volume Indicator can be calculated in the following ways.
OBV = OBVprev + Volume …………….(I)
OBV = OBVprev + 0 ……………………..(ii)
OBV = OBVprev - Volume ………………(iii)
The is the rules that guide the calculation of the On-Balance-Volume indicator.
- (i)The first equation will be used if the closing price of the current candlestick is greater than the previous closing price
- (ii)The second equation will be used if the closing price of the current price is equal to the previous closing price
- (iii)The third equation will be used if the closing price of the current price is lesser than the previous closing price.
An illustration of the On-Balance-Volume (OBV) Indicator.
From the table below, we can see the 6 days amount of Closing prices and volume of a particular asset and we will use it to calculate the On-Balance-Volume Indicator
| Closing Price | Volume |
|---|---|
| $40 | 47,980 |
| $45 | 50,000 |
| $43 | 45,000 |
| $50 | 48,000 |
| $50 | 44,000 |
| $42 | 43,000 |
In the calculation, we will be using the Formula below
OBV = OBVprev + Volume …………….(I)
OBV= OBVprev + 0 ……………………..(ii)
OBV = OBVprev - Volume ………………(iii)
The calculation can be seen below
DAY 1: OBV = 0 + 0 ( this is because there is no previous volume or OBV)
OBV = 0
DAY 2: OBV = 0 + 50,000
OBV = 50,000
DAY 3: OBV = 50,000 - 45,000
OBV = 5,000
DAY 4: OBV = 5,000 + 48,000
OBV = 53,000
DAY 5: OBV = 53,000
DAY 6: OBV = 53,000 - 43,000
OBV = 10,000
On the Sixth Day, Our On-Balance-Volume calculation gave us a current OBV of 10,000
You can notice that on Day 2, Day 4 we saw the adding of the previous OBV, this is due to the increment in price. You can also notice that on the third and sixth days, there was a reduction in the volume due to declining in the price and the OBV was the same on the Fourth and the Fifth Day because the both price are the same.
Another Wonderful feature of the OBV indicator are that it is used for Trend confirmation, it is used for Both Uptrend which is bullish, and downtrend which is bearish trend confirmation.
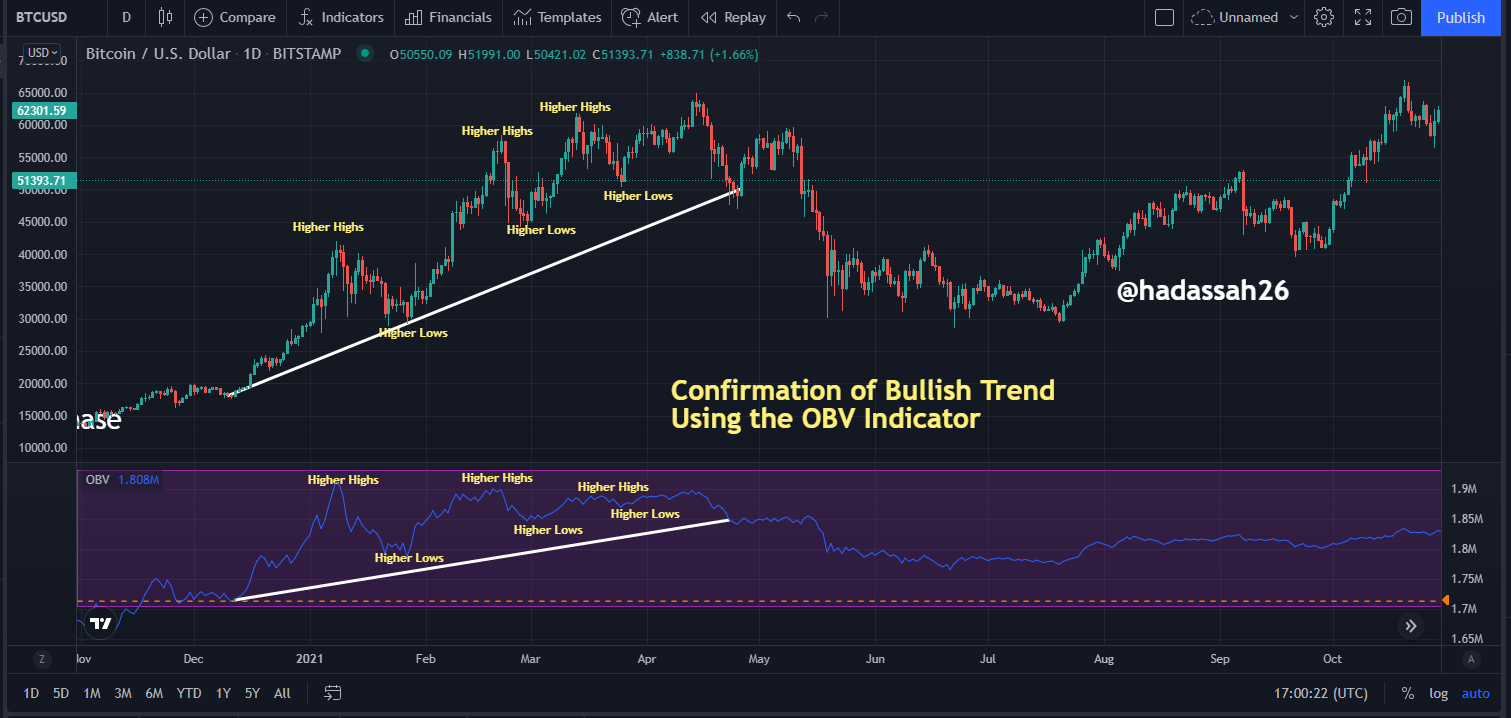
Using the OBV to Confirm the Bullish Trend: The OBV indicator has a unique way of confirming a trend in the market, how does it confirm a Bullish trend. The price makes higher high and higher lows which is a clear indication of the bullish trend, then coming to the OBV indicators, it will also be making the higher high and the higher lows too. That means the Price will be moving in the same direction with the On-Balance-Volume indicator. In this kind of situation, buyers take control of the market.
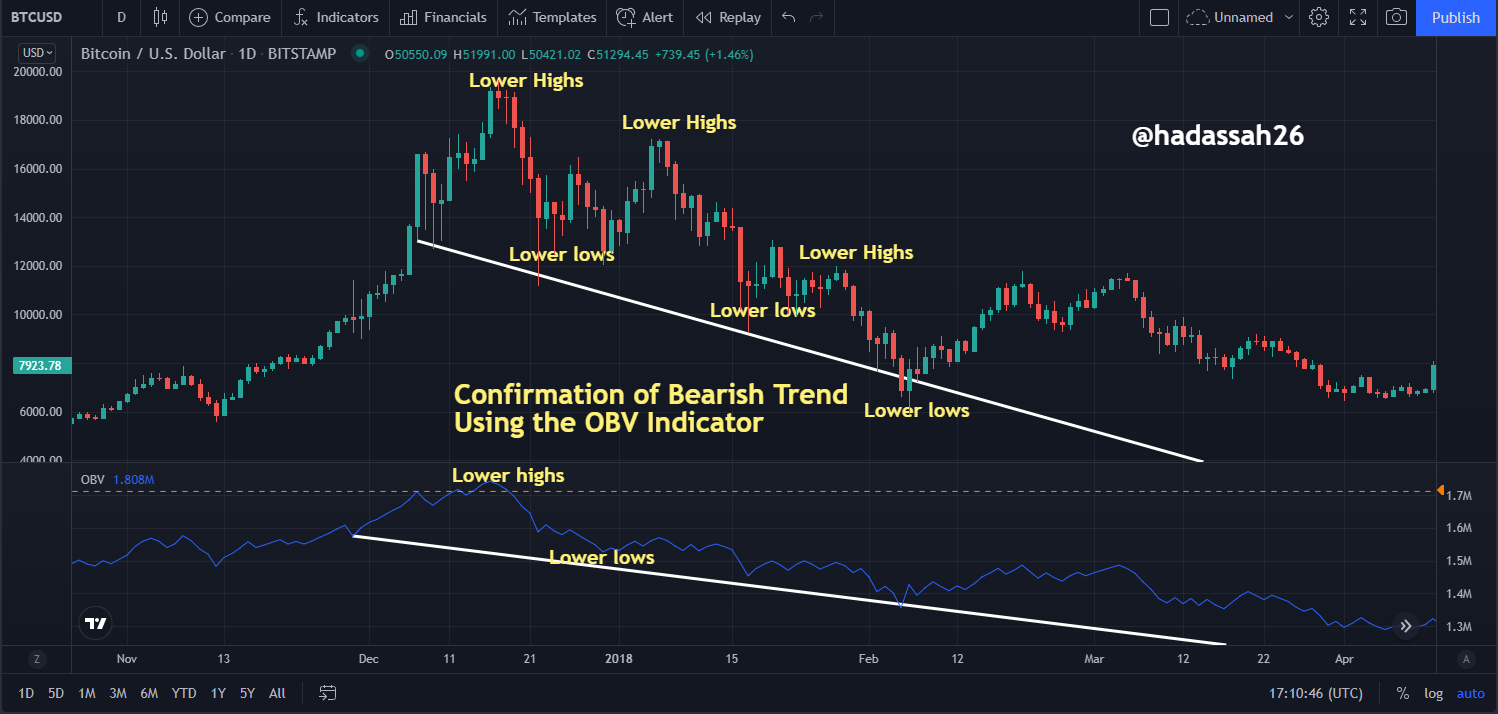
Using the OBV to Confirm the Bearish Trend: The OBV indicator has a unique way of confirming the trend in the market, how does it confirm a Bearish trend. The price makes lower high and lower low which is a clear indication of the bearish trend, then coming to the OBV indicators, it will also be making the lower high and the lower lows too. That means the Price will be moving in the same direction with the On-Balance-Volume indicator. In this kind of situation, sellers take control of the market.
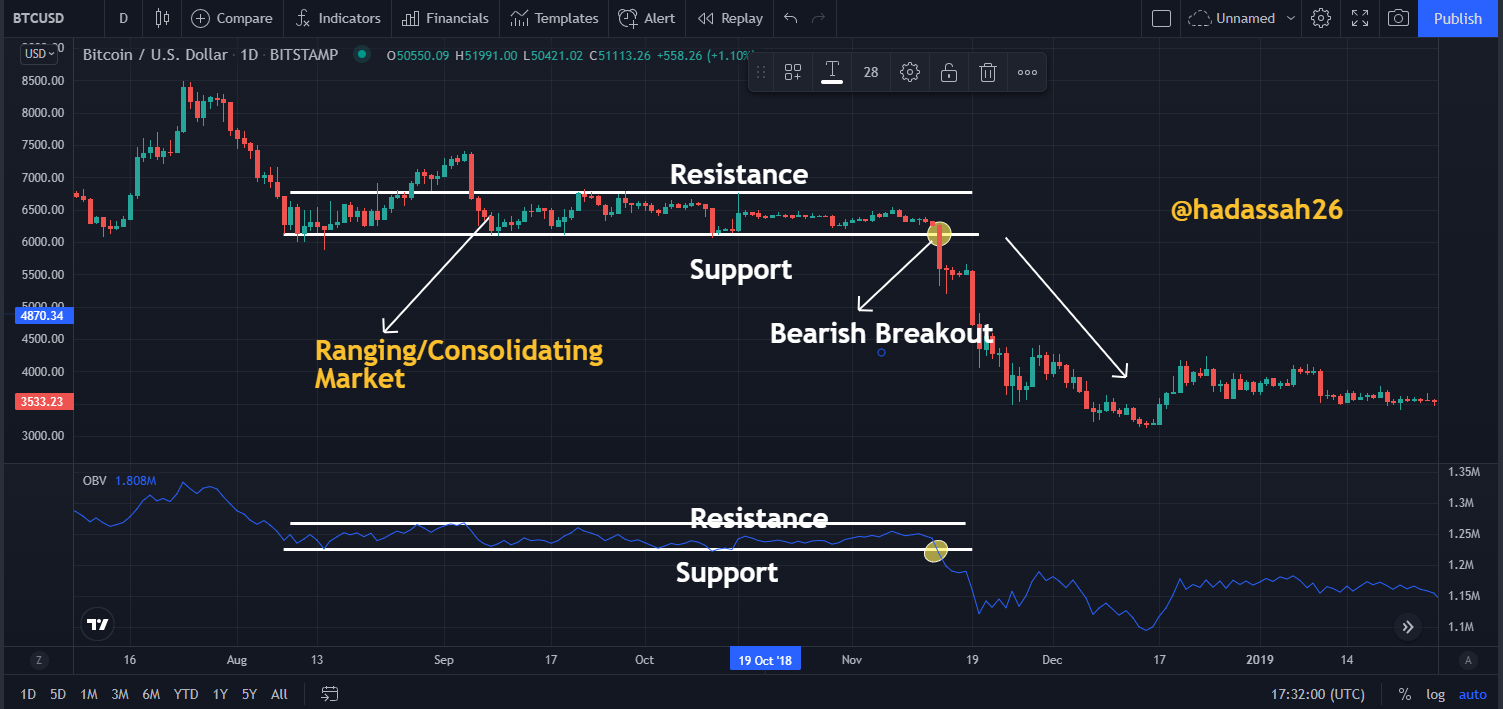
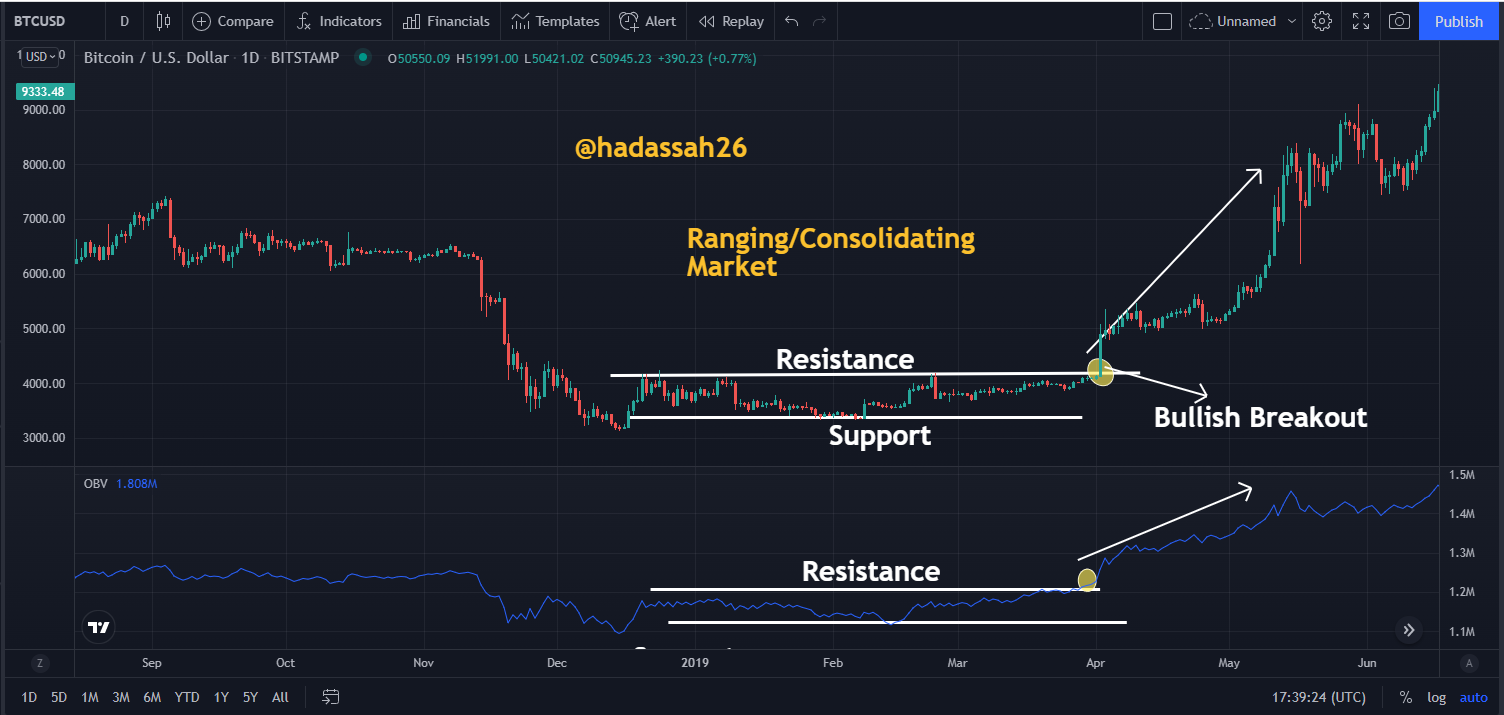
Another wonderful feature of the On-Balance-Volume Indicator is that it can be used to confirm breakout, in a market. How can you use the OBV indicator to confirm Breakout? The First condition is that the market should be consolidating at a particular point. The ranging market is bounded by the support line below and the resistance line above.
This indication can be seen in the market chart and the OBV indicator, If the price breakout of the consolidating market, the OBV indicator will automatically show it. And also the OBV indicators help to traders to prepare to enter the market in a good position.
A bearish Breakout, the occurs immediately after the support line that is below, you can see it from the chart below.
For the Bullish Breakout, the occurs immediately after the above resistance line, you can see it from the chart above.
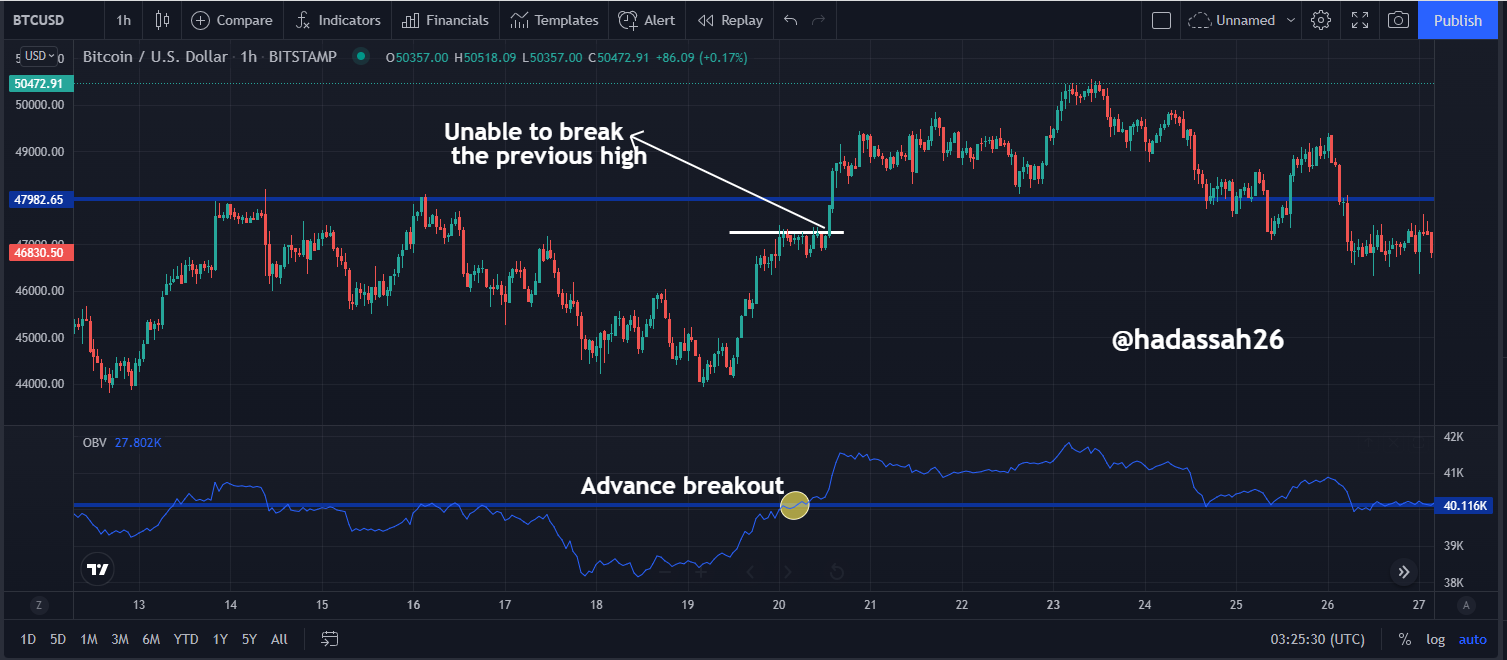
The OBV indicator can further be used to dictate advanced Breakout, this is different from the normal breakout, So How does the OBV indicator show the Advanced Breakout? This type of breakout occurs when the price has not broken through the high or the low of the market chart but in the OBV it has broken through the high or low of the On Balance Volume Indicator.
Most times this means that the volume of price in that direction will take the price beyond the previous high or low. This occurs in both a bullish and a bearish market.
In the bullish market, the advance breakout occurs when the price will be unable to break the previous high but on the On Balance Volume indicator, it has broken through the previous high, this shows that the market will move further in a bullish and most traders takes advantage of this opportunity by executing a buy order. An example of the bullish advance breakout can be seen below.
This is an example of the bullish advance breakout below
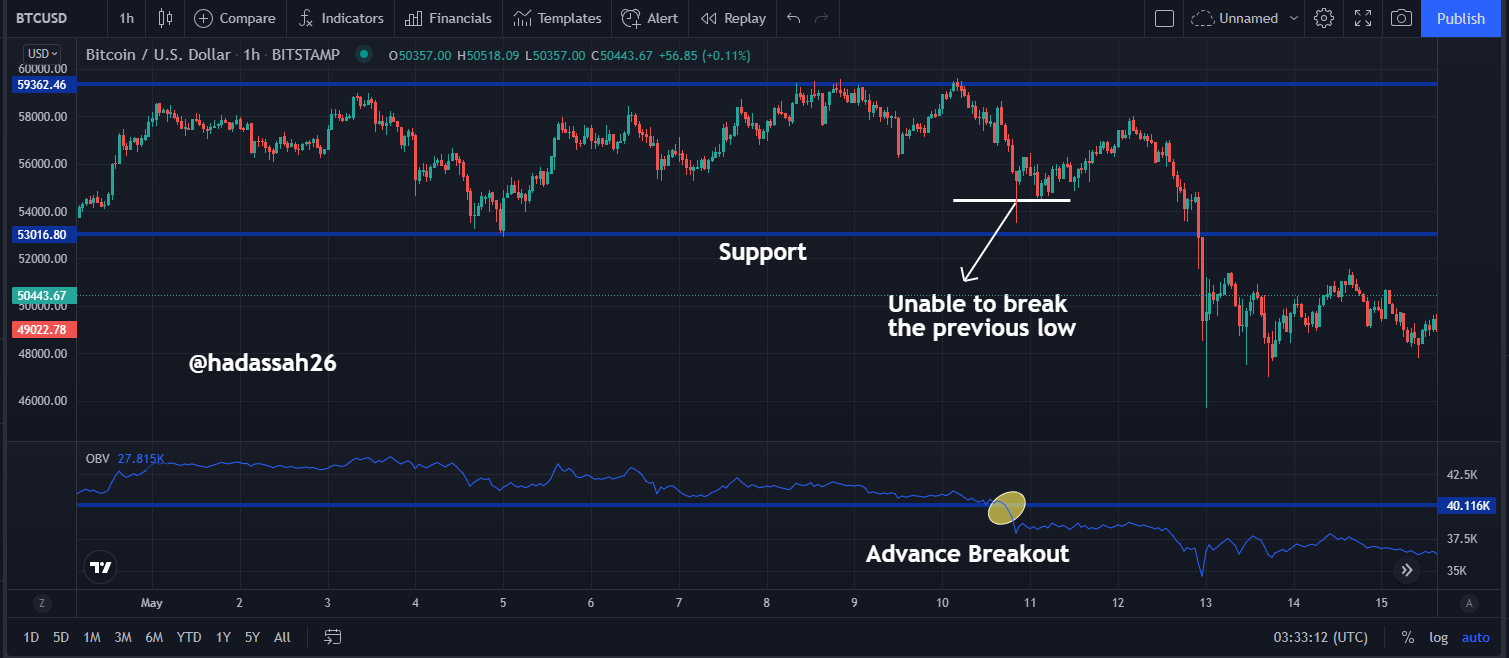
In the bearish market, the advance breakout occurs when the price will be unable to break the previous low but on the On Balance Volume indicator, it has broken through the previous low, this shows that the market will move further in a bearish direction and most traders take advantage of this opportunity by executing a sell order.
This is an example of the advance bearish breakout.
Divergence has been A major trading strategy for a long period of time now, many traders use divergence as a trading strategy. More so, the On Balance Volume Indicator can be used to detect divergence of both the Bullish and the bearish markets. How can the OBV indicator be used to dictate a Divergence?
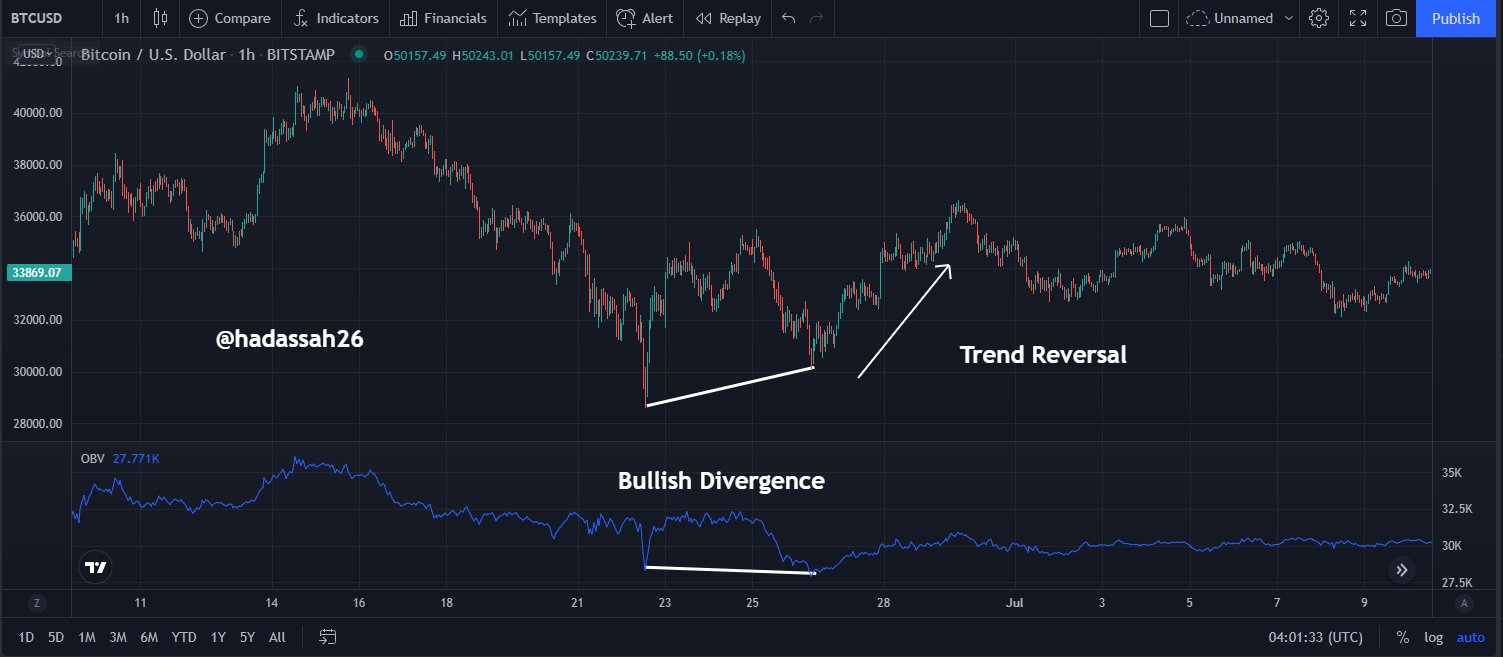
For A Bullish Divergence, it mostly occurs in a Bearish market with the price of the assets making a Lower low but the OBV indicator is not moving in line with the price of the asset, the OBV indicator shows a higher low, this is a clear indication of a bullish divergence. The bullish Divergence shows that there will be a trend reversal ahead and it also makes traders to be prepared to execute a buy order.
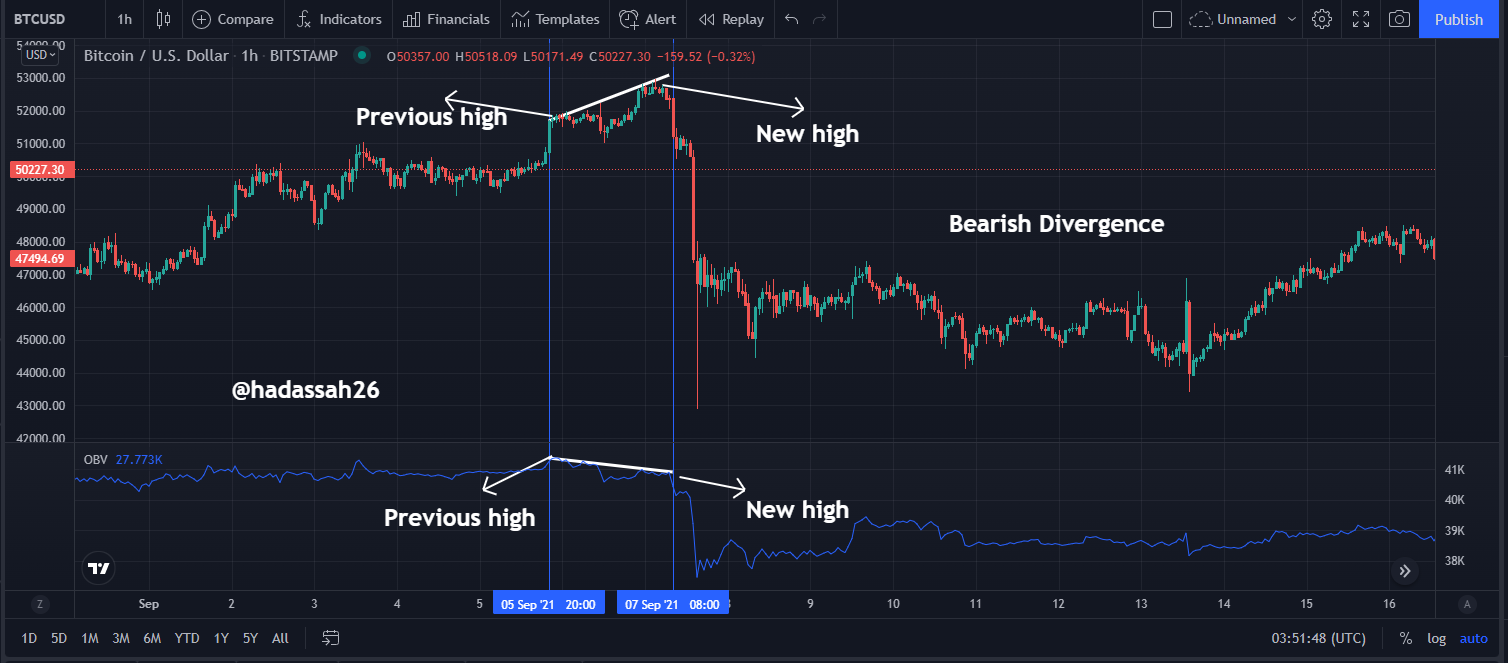
For A Bearish Divergence, it mostly occurs in a Bullish market with the price of the assets making higher highs but the OBV indicator is not moving in line with the price of the asset, the OBV indicator shows a Lower high, this is a clear indication of a bearish divergence. The bearish Divergence shows that there will be a trend reversal ahead and it also makes traders to be prepared to execute a sell order.
In this case, I will be using a confluence of On Balance Volume and the Stochastic Oscillator Indicator for entering a trade.
Buy Trade
I will be using the OBV to confirm the direction of the trend whether it is a bullish or bearish trend.
The stochastic oscillator has two regions which are the overbought (80 -100) and the oversold region (20 -0). If the price is on an uptrend which you can use the OBV indicator to confirm that and watch the Stochastic indicator properly to know the region the price is currently in. If the price is on an oversold region in the stochastic oscillator then that is a good entry point for a buy order.
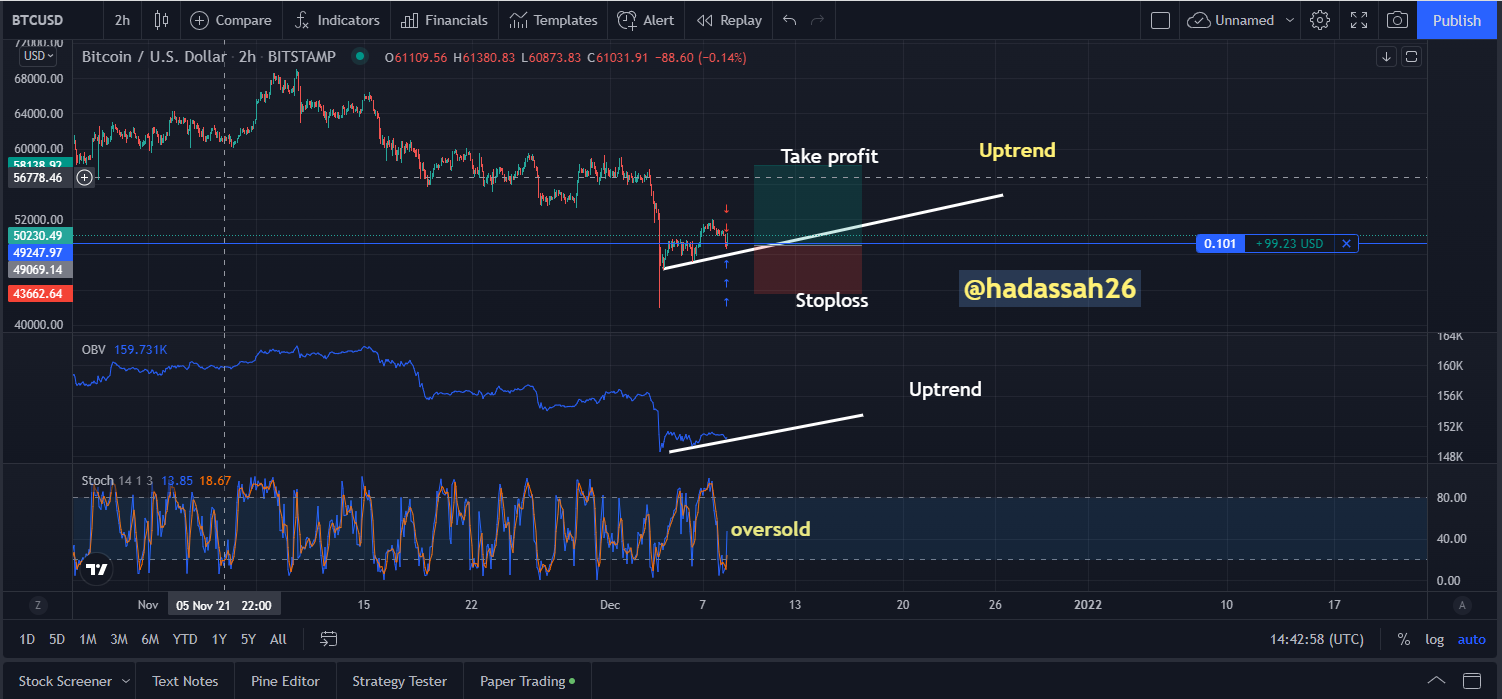
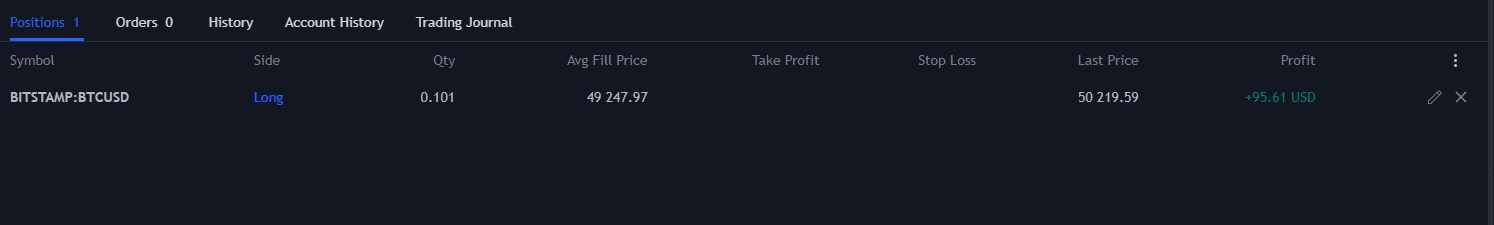
This is the result of the trade I took after I left it for some time.
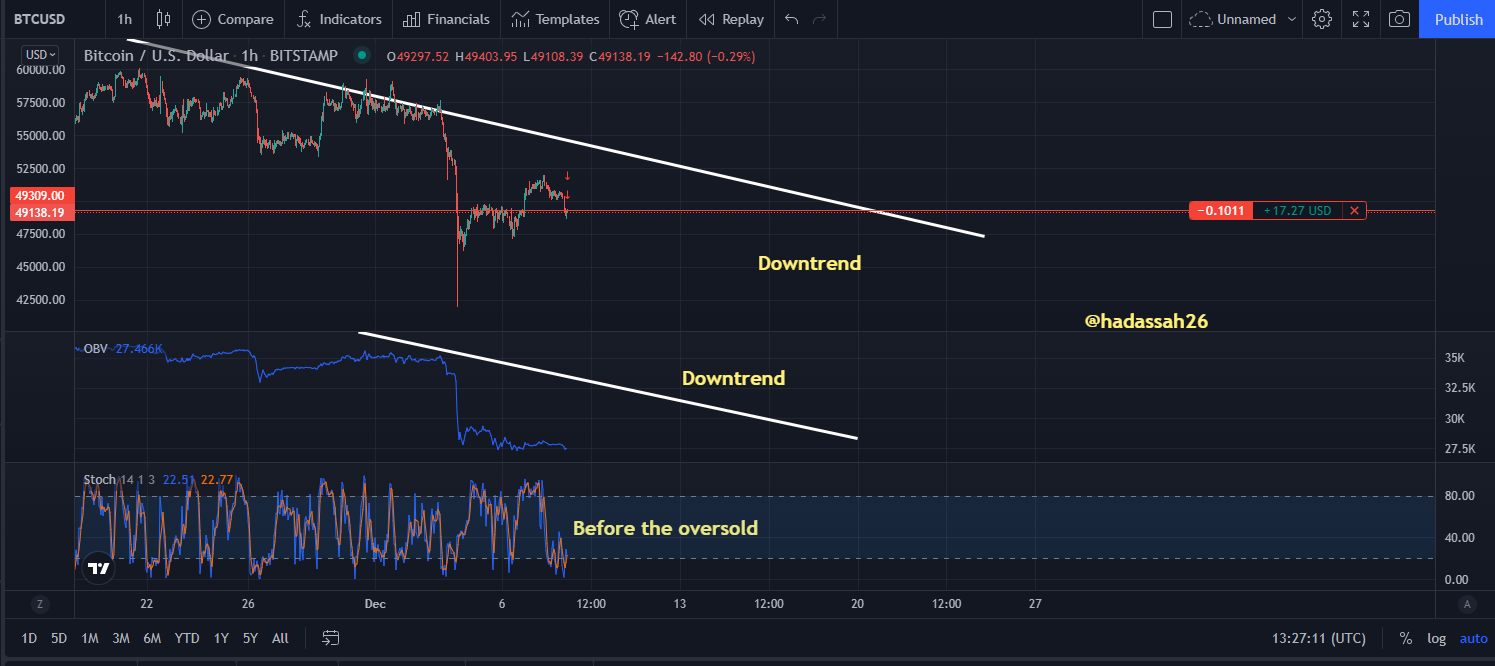
Sell Trade:
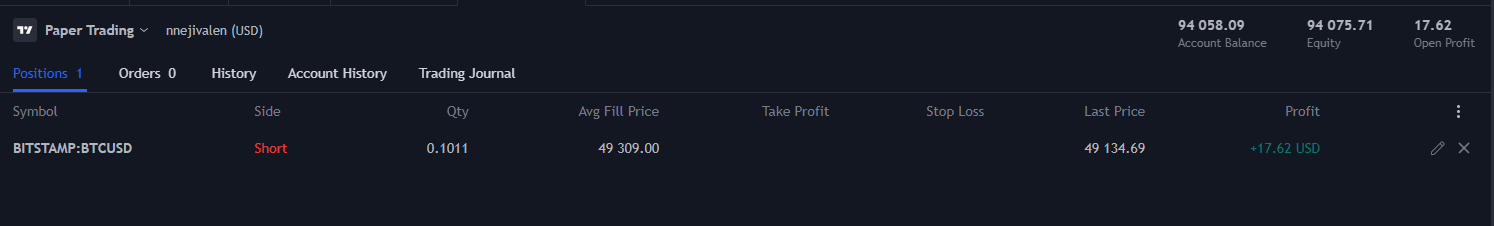
For a sell order, then we will use the OBV to confirm if the market is on a downtrend and if yes, we can also use the Stochastic oscillator to get a good entry point.it the diagram it is heading towards the oversold, it is also a point to sell and I sold using risk to reward ratio of 1:1 and I placed my take profit and my stop loss
om)
Advantages of the OBV
- It can be used to show the relationship between the volume of an asset and the price of the asset
- Traders uses the OBV to predict the price of an asset which is gotten from the volume
- It can be used to identify breakouts in both in an uptrend and the downtrend market
- You can also use the OBV to indicate Both the Bullish and Bearish Divergence
- It can be used to confirm the movement of price with consecutive higher highs in an uptrend and lower lows in a downtrend.
Disadvantages Of OBV indicator.
In conclusion, the On Balance Volume indicator is a momentum indicator that is used for the confirmation of trends in the market. It normally shows the relationship between the volume of assets and the price of an asset. It can be used to know if the trend of the market is either bullish or bearish. The OBV indicator can also be used to confirm breakout and advance breakout. The OBV indicator has another wonderful feature which is the determination of both the bullish and the bearish divergence.
Using the Technical indicator can be of great help to you but if you combine it with another indicator like the stochastic oscillator, you can be more profitable. So my candid advise to you is to study the indicator more, so you will know more about it.
Cc: @fredquantum