Understanding Trends-Crypto Academy / S5W1- Homework Post for @reminiscence01".
I welcome every beginner to the wonderful academy

1)a) What do you understand by a Trending market?
The market is simply where exchanges are carried out, exchanges can be money for goods or services. Man needs the market for him to survive because man can not produce everything that he needs.
But for today, we are not looking at the physical market, but we are looking at the crypto market where financial exchanges such as cryptocurrencies take place. In this market, there are also buyers and sellers, that either buy or sell one token or the other. Demand and supply are also carried out in this market because sellers normally supply some token that is demanded to be bought by the buyers. In the crypto market, there are only two directions of the market, which can be ranging or trending movements.
The ranging market is a market that moves horizontally, it moves towards the hand side of the chart. This can be a result of a struggle between buyers and sellers, who will take control of the market. And after every ranging market, there is usually a trend that follows, it can be an uptrend or downtrend
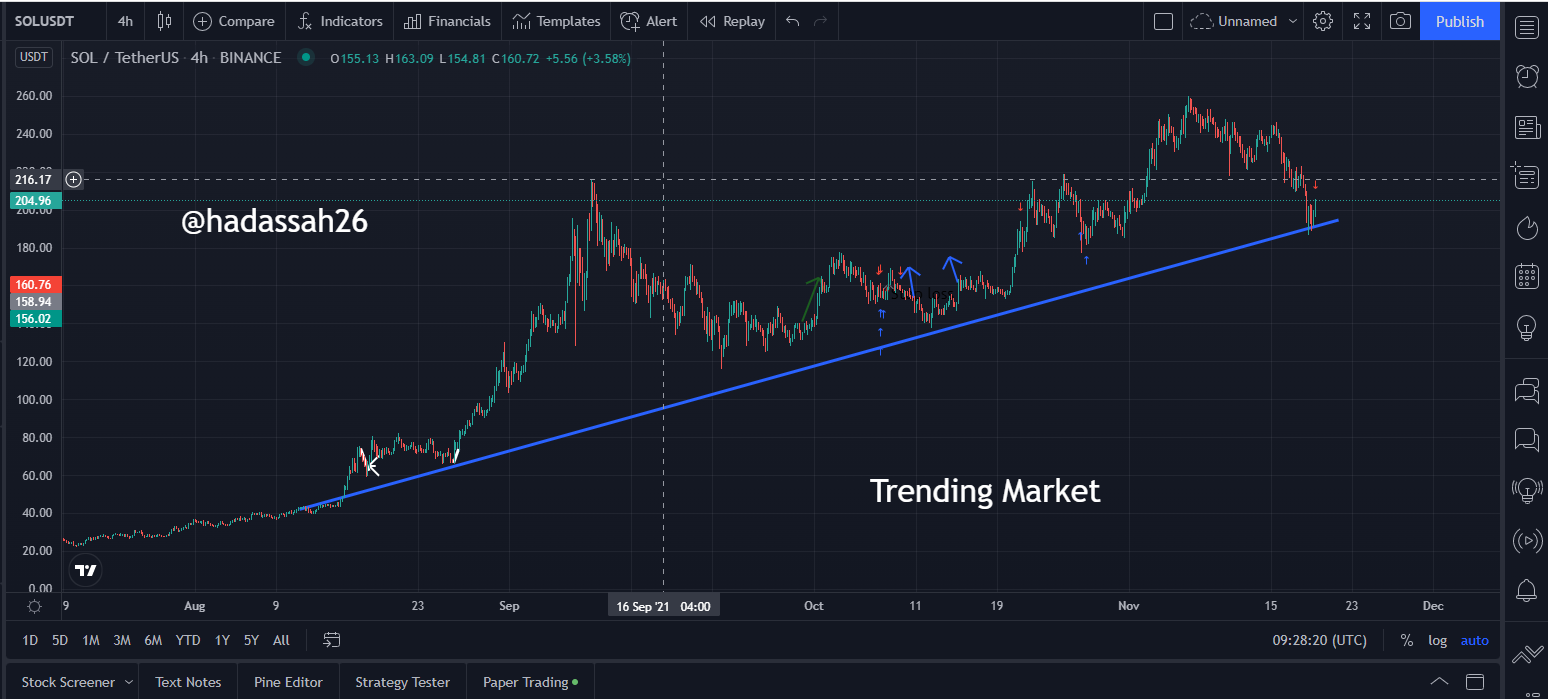
When a market is moving in an upward or downward movement it is called a trending market. A trending market is a market where the price is making higher highs and higher lows or lower lows and lower highs, which moves in either upward or downward direction, due to some important factors such as demand, supply, buyers, sellers volatility, etc.
When the sellers are in control of the market, this could lead to a very high supply, and the direction of the price will change towards the downward direction, and this can be called a bearish trend.
When the buyers are in control of the market, this means that there is a very high demand for that coin or token at that particular time, this will result in an upward direction or uptrend of the price in the market. It can also be called a bullish trend.
We use the trendline to measure the trending market.
b) What is a bullish and a bearish trend? (screenshot required)
I earlier told you about the trending market and their types. So now. Let us carefully look into the bullish and the bearish trend individually.
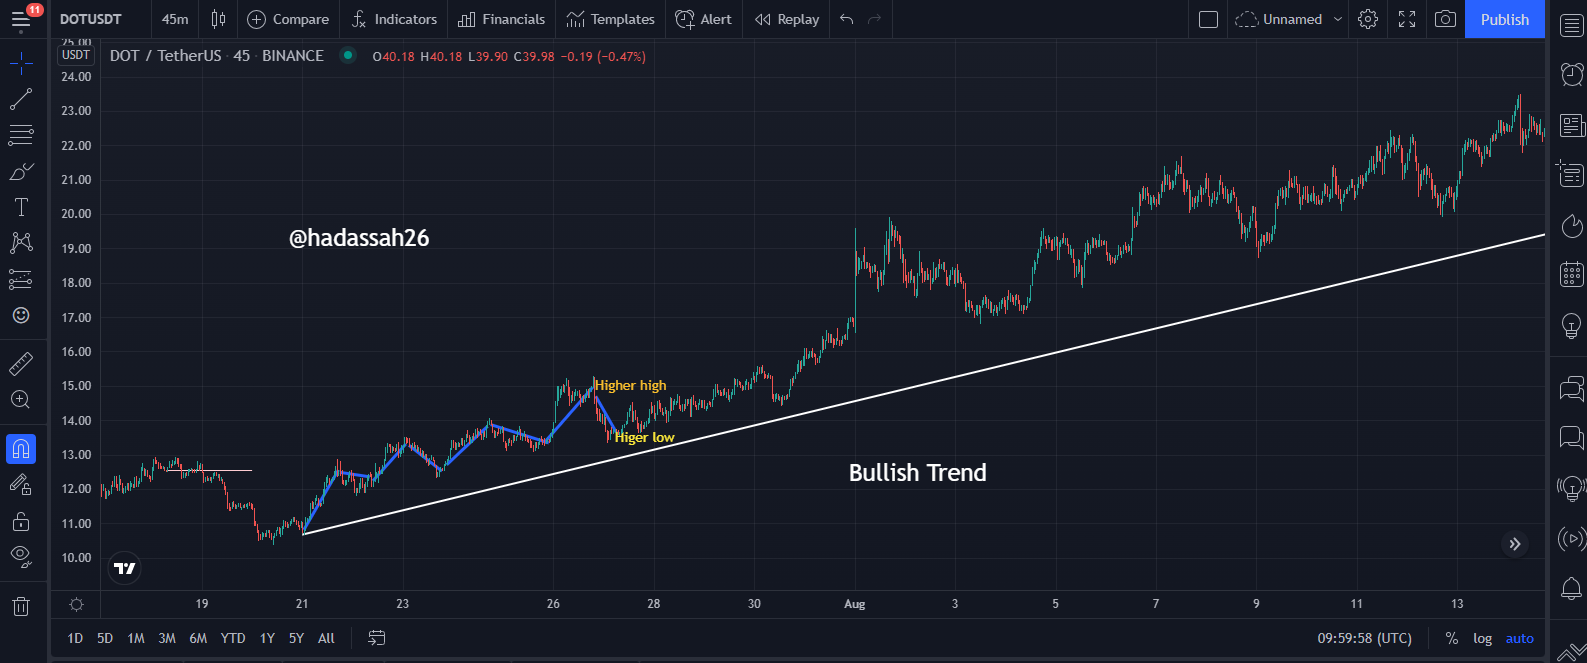
Bullish trend
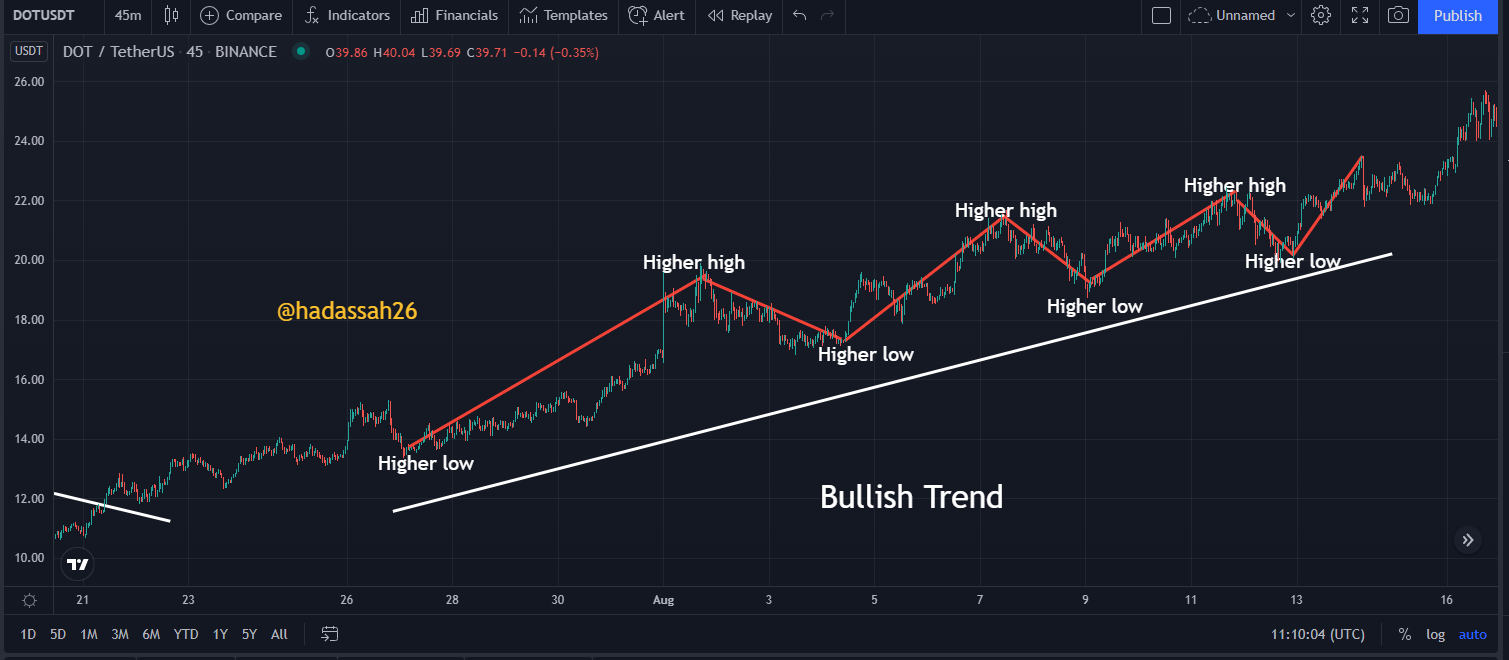
Whenever you see a market forming higher-highs and higher lows, this is the significance of the bullish market. A bullish trend occurs in the bullish market, where there is a very high demand for a particular commodity in the market. In the bullish market, the opening of the next candle is usually higher than the close of the previous candle. The direction of the market is usually in the upwards direction.
The buyers control the bullish trend because the price tends to increase higher and higher.
The bullish trend is made up of the major pull upwards and a minor retracement, it moves in an Undulation way. Traders usually use retracement to enter the market, so that they can make a good profit. An example of the bullish trend can be seen below.
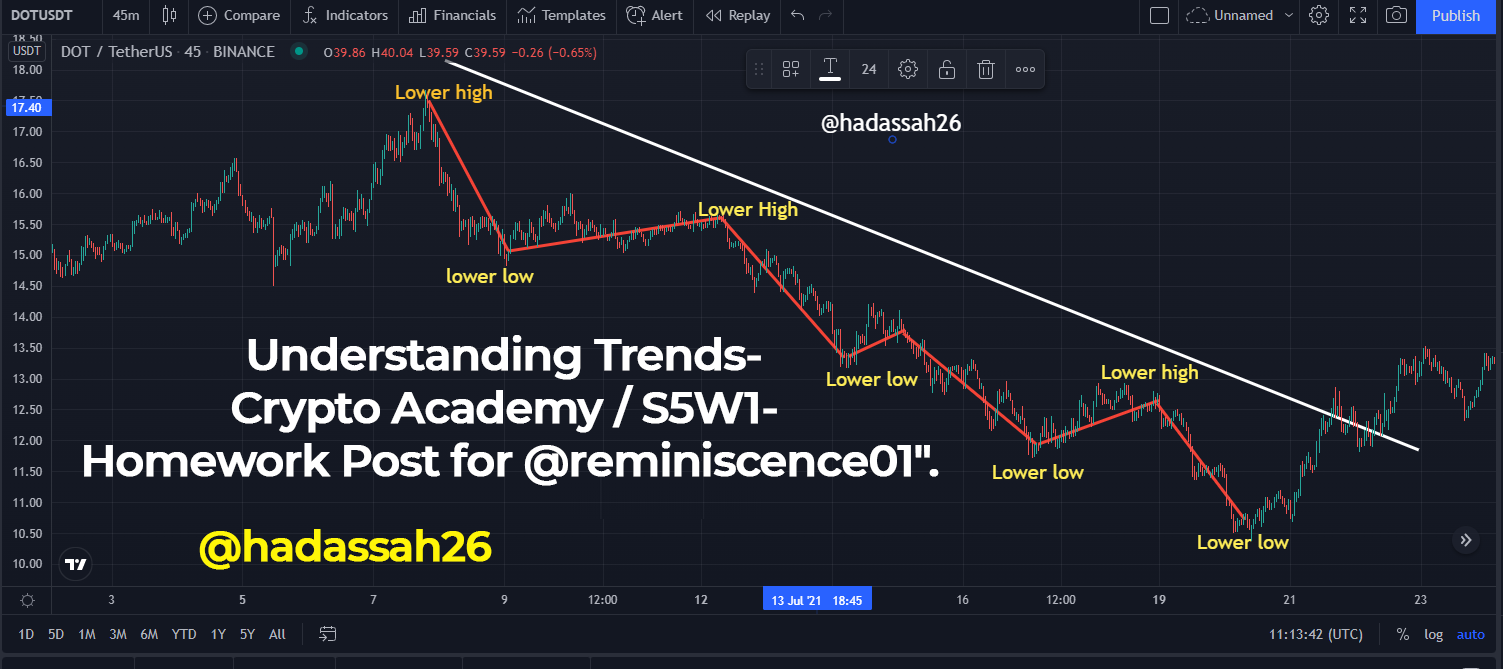
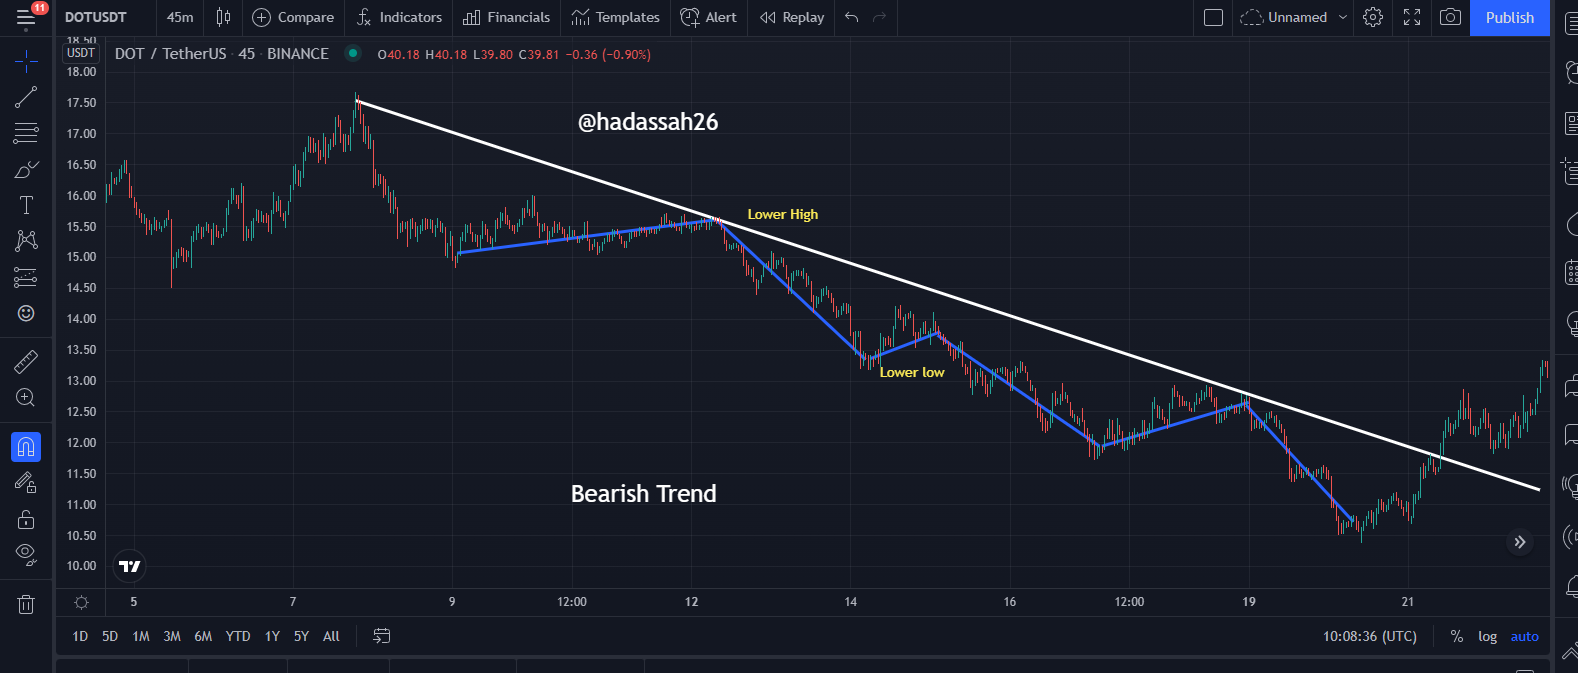
Bearish trend
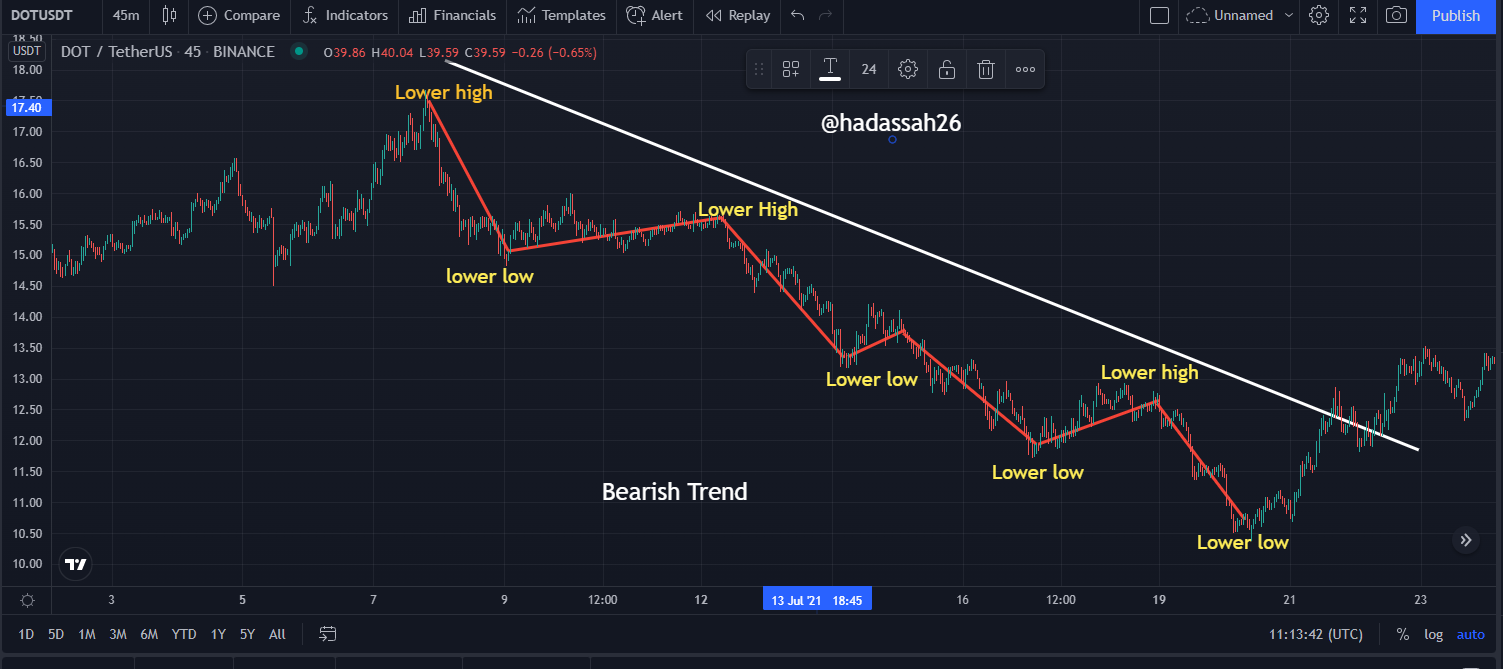
The bearish trend consists of Lower highs and lower low movements of the price of the commodity in a particular market. In the bearish trend, the price of the market which is indicated by the candlestick tends to be falling. This happens as a result of the opening of the next candle will be lower than the close of the previous candle. In the bearish trend, the Sellers tend to take control of the price of the market due to the high supply of the price of the commodity, and this, in turn, will affect the price to be going in a downward direction.
Also during the bearish trend, there are several retracement presents, which enables the sellers to enter the market for a good entry position. We can also use the trendline to measure the bearish trend strength and weakness, the price breaks through the trendline it can mean a reversal of the trend. An example of the Bearish trend can be seen below.
2)Explain the following trend identification and give an example of each of them. (Original screenshot needed from your chart). Do this for a bullish and a bearish trend.
i) Market Structure.
Market structure is simply all the price arrangement of the market that forms a pattern in the market. Market structure is simply gotten from the candlestick that is formed over time in the different time frames. The market structure can be used to identify trends in the market properly and other things. The Market structure can be used to tell us if the market is ranging, uptrend or downtrend.
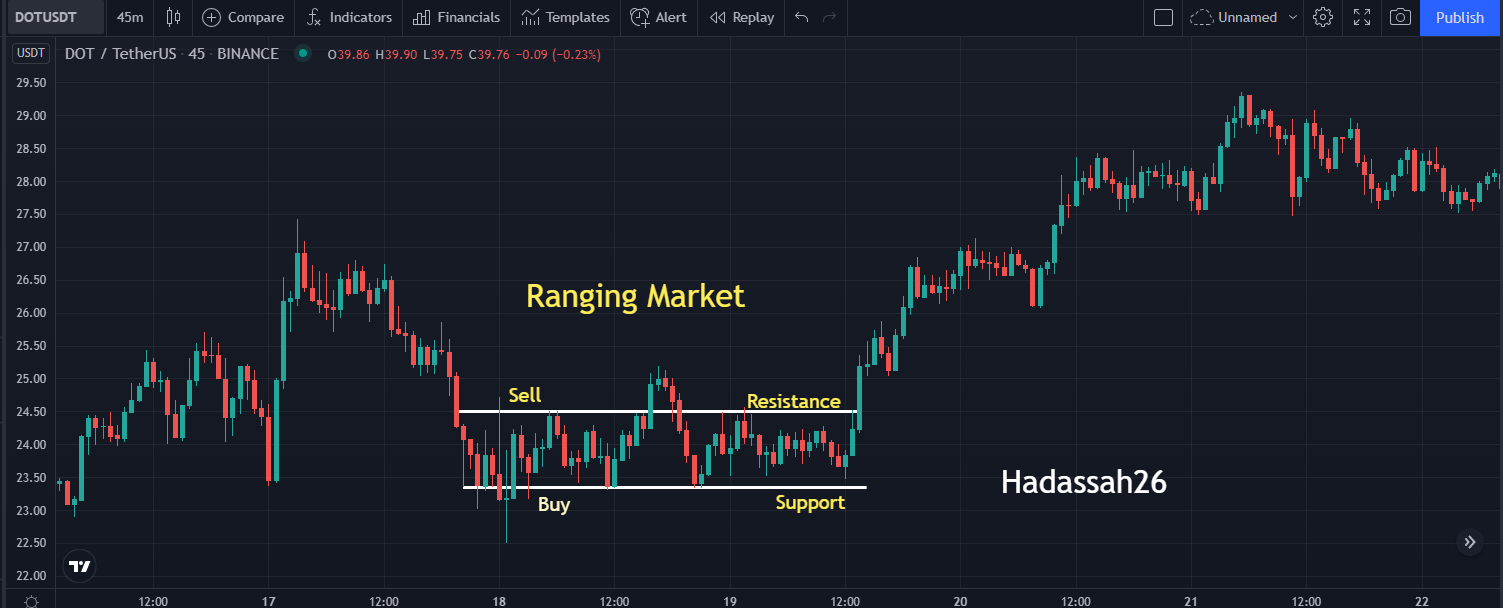
Ranging Market
When a price in a market is moving around a confined area, with the help of the support and the resistance without any form of trend, the market can be said to be a ranging market. The majority of the time after a ranging market comes either an uptrend or a downtrend. Or range market can be used used to accumulate momentum for the next phase that is about to happen.
Once you did your market structure properly by drawing your support and resistance, as a profitable trader, you can buy at your support and sell at your resistance in a range market. Most traders are seriously waiting for a breakout to occur after the ranging for them to follow the trend either upward
or downward trend.
Bearish Trend
With the use of market structure, you can also identify the Bearish trend by using the Lower low and lower high of the price of the market to identify it. Other criteria are to notice that the opening of a new candlestick is usually lower than the close of the previous candlestick, mostly in a larger timeframe. Price can also break the former low-point which indicates a very strong momentum to the downtime. The next lower low is always lower than the previous lower low and the next lower high is always lower than the previous lower high,
Bullish Trend
With the Market structure, you can also use it to properly identify the Bullish Trend of a market at a particular time frame. This can be done properly to identify the Higher highs and the higher lows of the market. Carefully ensure that the higher high of the current price is higher than the previous higher high and the current higher low of the market is also higher than the previous Higher low. You can notice some retracement, which are good entry points for the traders to enter a trade for a huge profit. The bullish take place because of the influx of buyers, there increasing the demand for the coin.
You can an example of the Bullish Trend below.
ii) Trendlines
When discussing technical analysis, it can not be completed, if you didn’t mention trendlines.
What are Trendlines and how can you use them to identify a trend in the market?
The trendline is a line that can be drawn from any angle that helps traders in the market to properly identify whether a trend is an uptrend or downtrend or even where there is no trend in the market. Drawing a trend is easy, it has almost principle withdrawing support or resistance in the market. In a Market, your trendline can be accurate if two or more point is on the trendline. The trendline can also be used to identify a reversal in the market, this is done when price breaks the current trendline.
Bullish Trendline
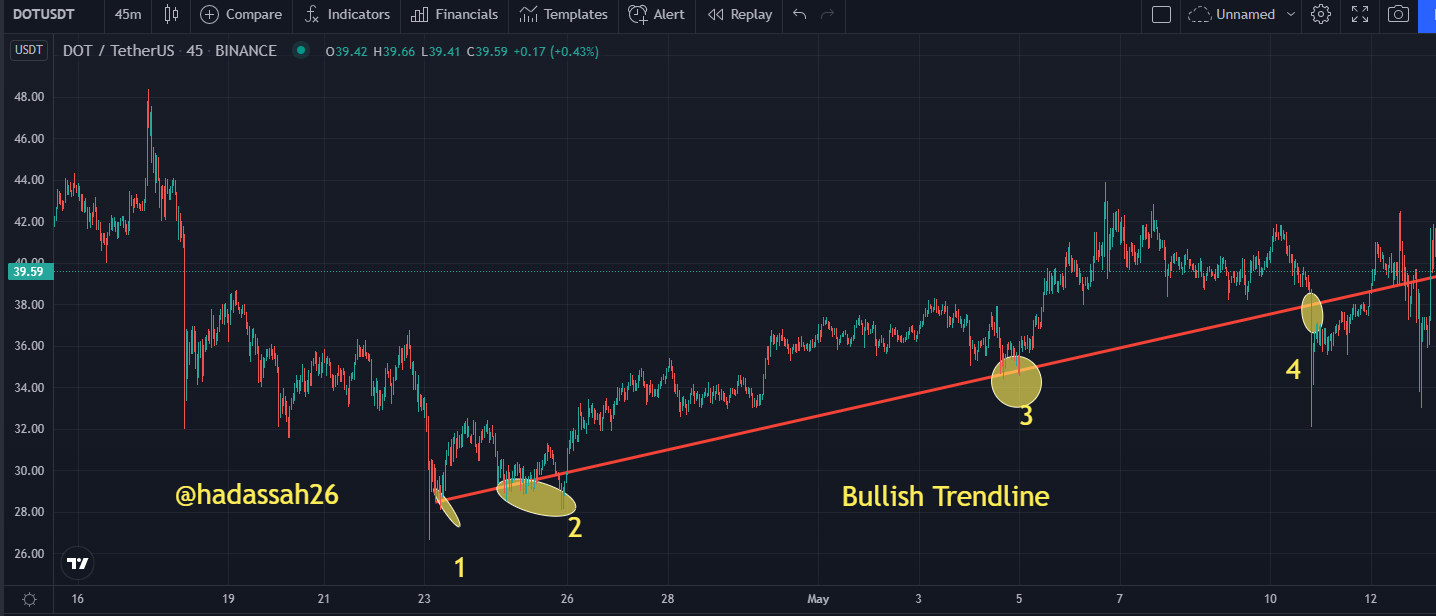
The Bullish trend line is mostly drawn under the price, for the trend to be accurate, the price most have touched the trendline mots than two times. The point where the price touches the trendline can be used as an entry point for the buyers. Buyers mostly make use of the Bullish Trendline.
An example of the bullish trendline can be seen below
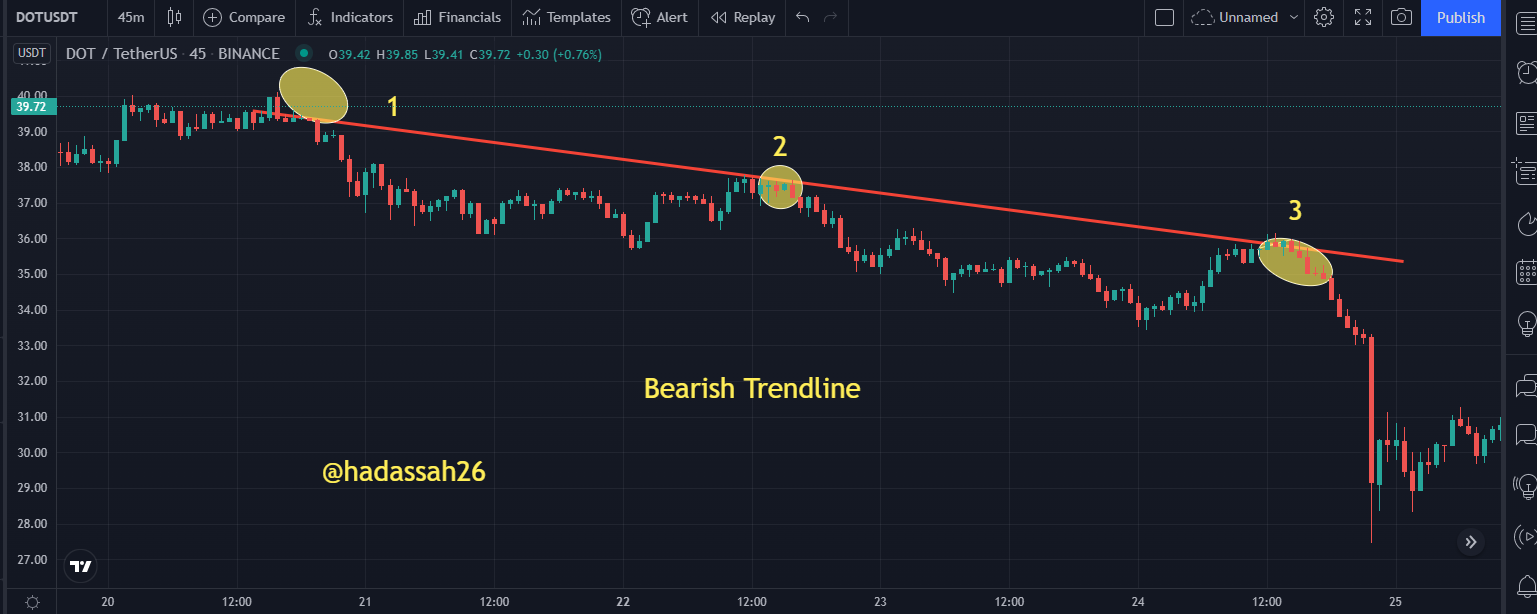
Bearish Trendline
The bearish Trend is normally drawn above the price, it is used to measure the strength of the Bearish Trend. The trendline can be a support or resistance but it is dynamic. In this case, you can call it a dynamic resistance for a downtrend. For you to have a proper Bearish trendline, the price must have touched the trendline at least twice or even more. Sellers in the market normally use the bearish trendline to gain from the market. An example of the Bearish trendline can be seen below.
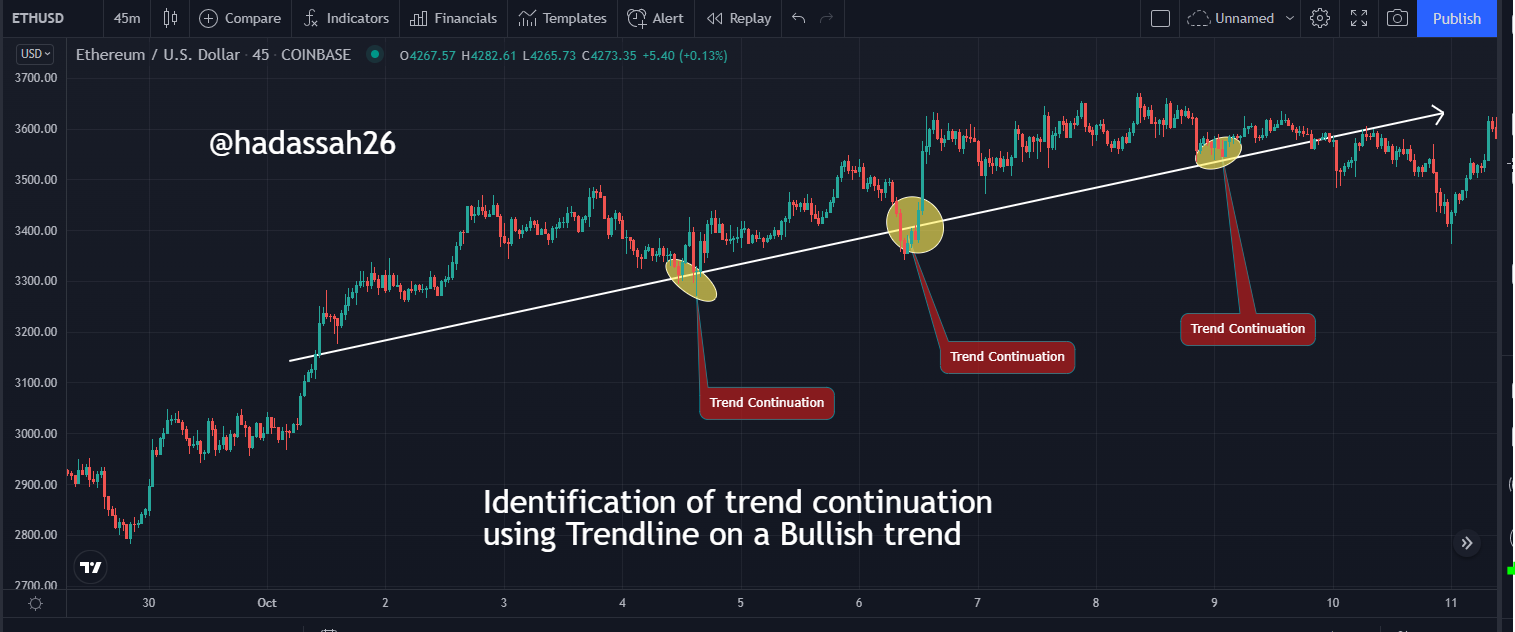
3)Explain trend continuation and how to spot them using market structure and trendlines. (Screenshot needed). Do this for both bullish and bearish trends.
The trend continuation is another important phenomenon in the trading crypto, for traders to properly get to acquire some profits, you need to understand what trend continuation is all about. Trend continuation usually occurs after the price has consolidated for some time or been retraced and continues in that direction, after a breakout. The period where the price consolidates, the price uses it to gain momentum to move in that direction. Or trend continuation occurs to retest either a support or resistance line and continues in that direction.
Knowing where you can find the trend continuation is really important for traders, because, if you spot them earlier, you will gain a huge profit.
Spotting the Trend Continuation using a Market structure
- Bullish Trend
- Bearish Trend
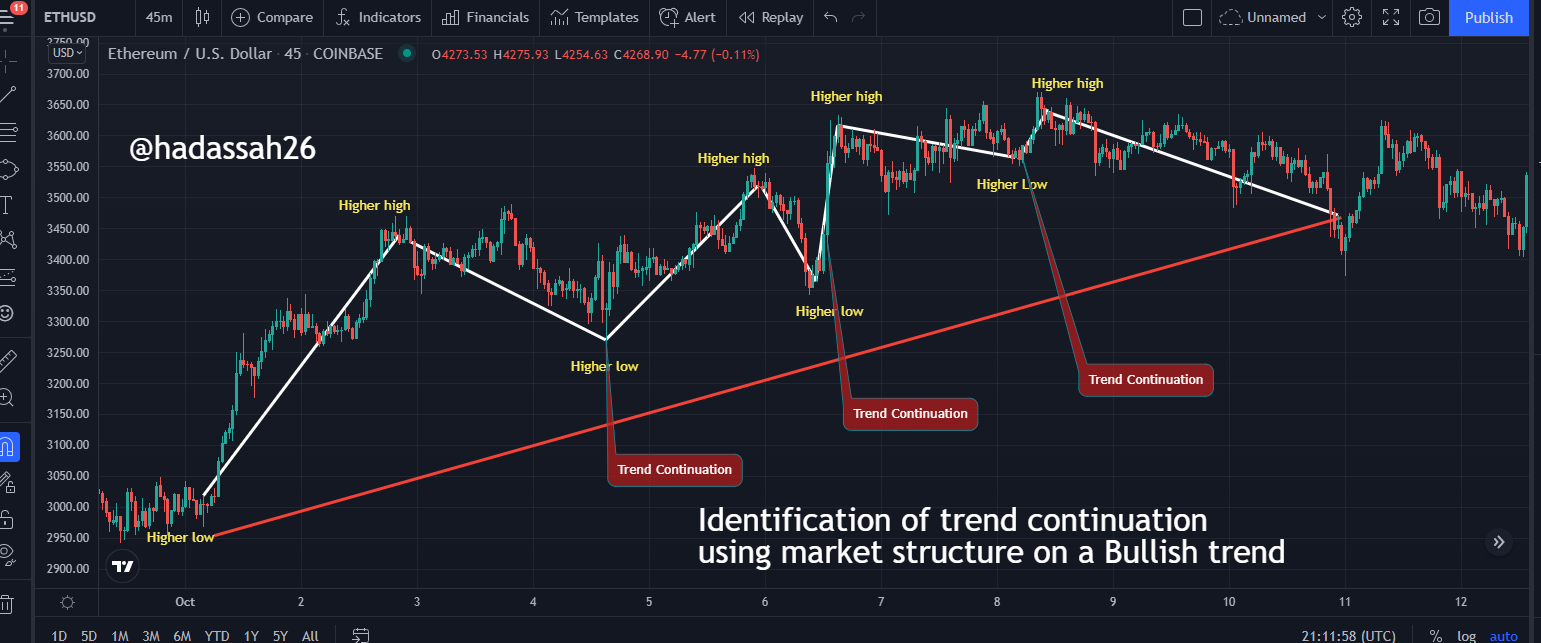
From the chart, the trend continuation can be spotted at the Higher low spot, this is the time where the price retracement either to retest support before going heading upwards.
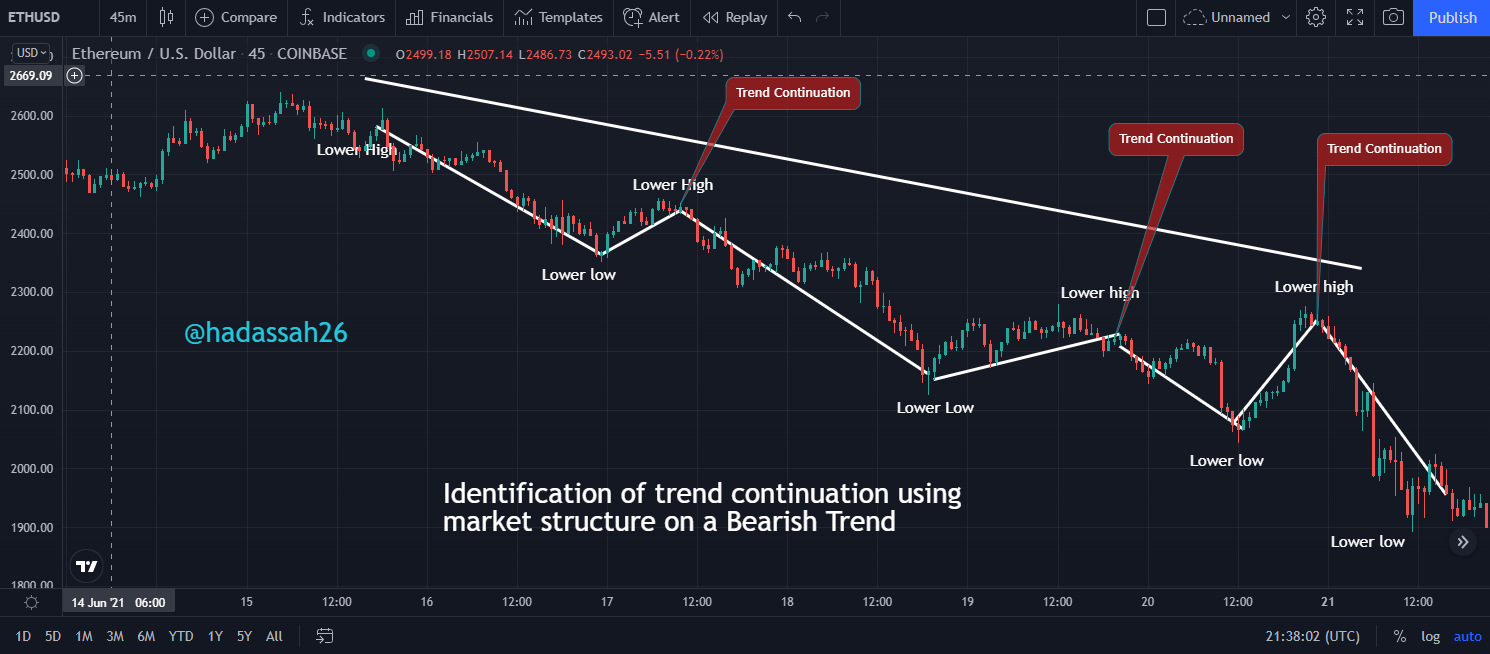
From the chart, which a bearish trend, we can see the price making a lower low and lower highs, the trend continuation can be identified at the point of the lower high, that is point of retracement. And a trader can place a sell order at that point, he will make it massively.
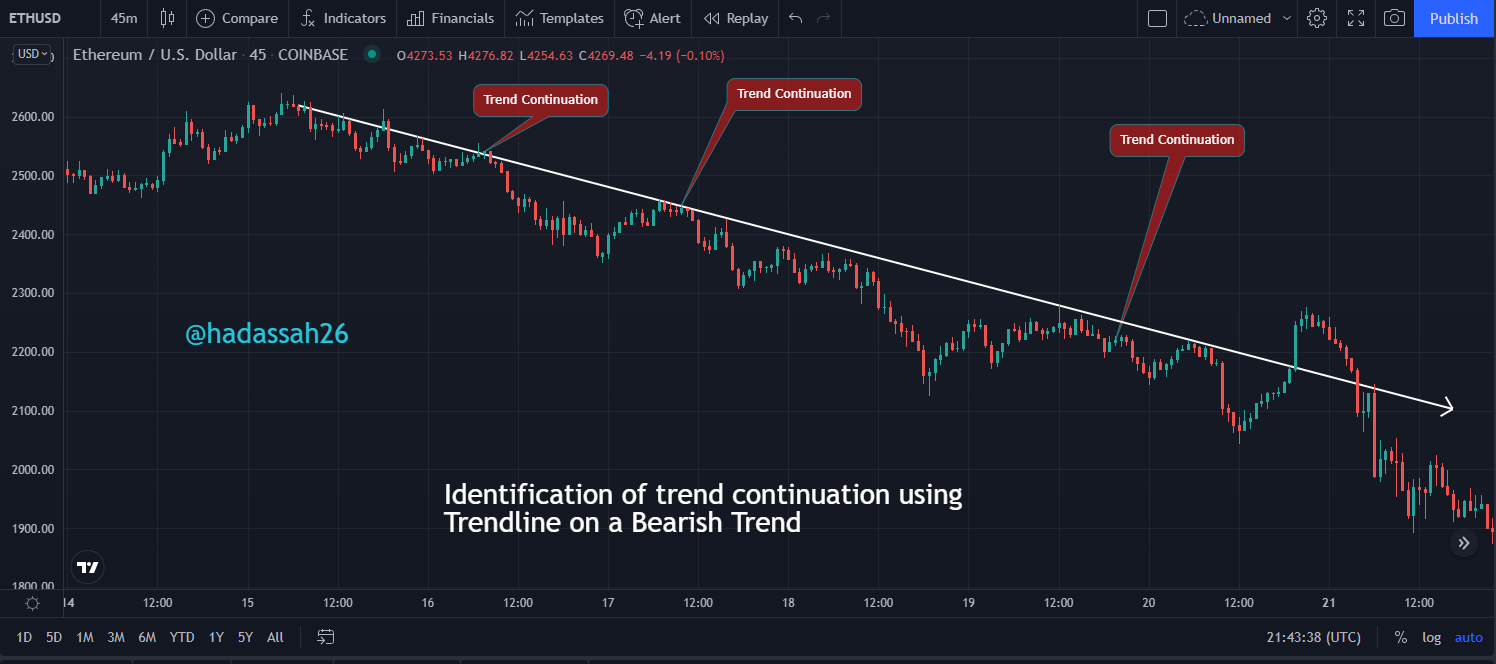
Spotting the Trend Continuation using a Trendline
- Bearish Trend You can spot the trend continuation using the trendline, by allowing the price to touch on the trendline, once the price touches on the trendline that the trend continuation, you can place your sell order from that point.
- Bullish Trend
4)Pick up any crypto-asset chart and answer the following questions -
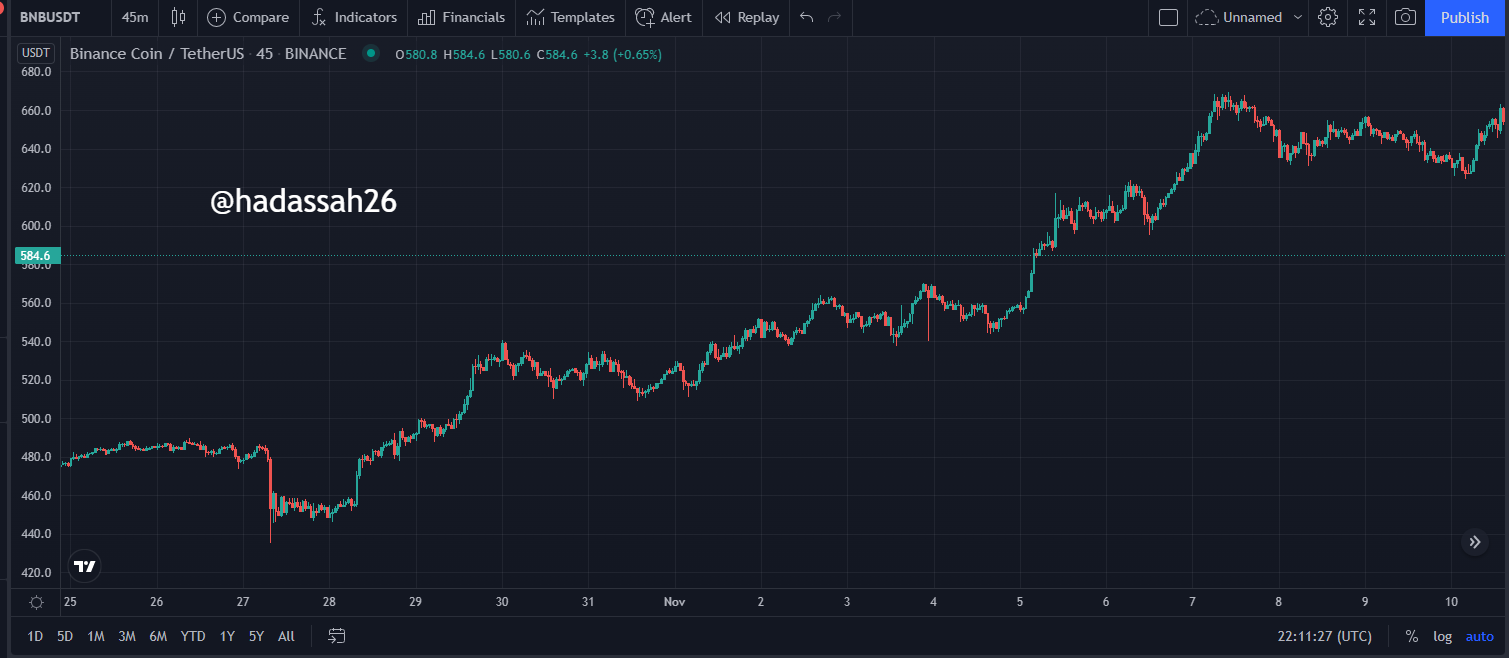
I selected the BNBUSDT on a 45mins time frame.
i)Is the market trending?
The market is market trending,
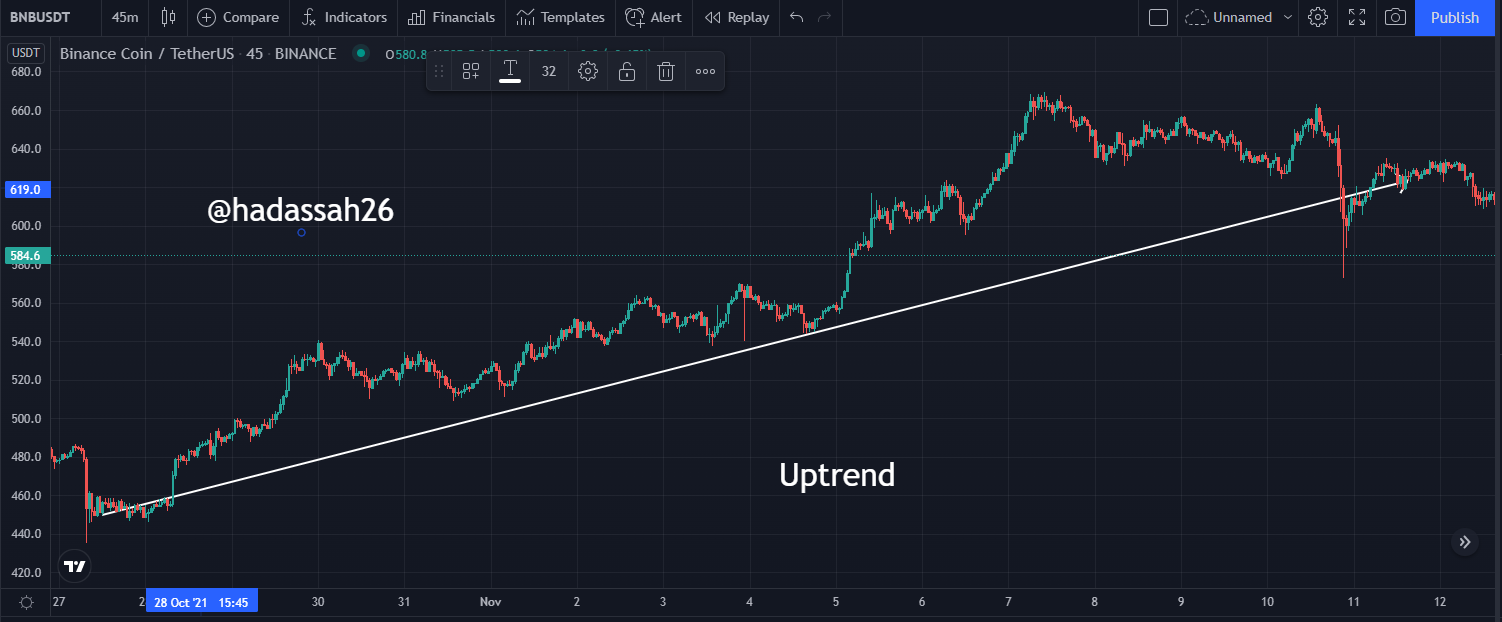
ii) What is the current market trend? (Use the chart to back up your answers).
The current trend of the chart is on an uptrend because it consists of higher highs and higher lows and even the trendline id tends towards the upwards direction.
In conclusion, Trend they say is your friend, understanding the trend properly and you can use them can help your trading journey. Understanding when you have a trending market is key to the trader. Every trader is looking for the trend. With the help of the trendline and the market structure, you can properly get that and even more. You can also use the know who is in control of the market.
Cc: @reminiscence01
Hello @hadassah26 , I’m glad you participated in the 1st week Season 5 of the Beginner’s class at the Steemit Crypto Academy. Your grades in this task are as follows:
Recommendation / Feedback:
Thank you for participating in this homework task.
@steemcurator02