Algorithmic Trading with Moving Averages on Steem
Hello everyone ihope you all are good. I am happy to join this weeks contest which is all about Algorithmic Trading with Moving Averages. This is Where we use computers to make trading easier and Faster.
In this contest we will use moving averages simple and useful tools for trading to Create automatic trading systems for the steem token. Algorithmic trading helps us trade Without emotions making better and quicker decisions. i am excited to share my idea with you.
.jpg)
We will works with Simple Moving Averages Exponential Moving Average (EMA) and Weighted Moving Average (WMA). By using these we can create smart trading system. This contest is great way to improve our skills and create new ways to trade.
Introduction to Algorithmic Trading |
|---|
Algorithmic trading is method where I use Computer program to automatically make trades for me based on specific rules. Instead of manualy buying and selling on Binance I can set up a algorithm to follow my strategy without needs to monitor the markets all the time. This makes trading much faster and more eficient especially in fast paced markets likes crypto. It also help avoid mistake that come from emotions or human error.
Why Algorithmic Trading is Important
In today world algorithmic trading has become essential in many market including cryptocurrencies. It helps me react quickly to changes in the markets and make more informed decision based on data. By using an algorithm I can trade 24/7 take advantage of market trend and avoid emotional decisions. For example on Binance prices can move fast and using an algorithm allow me to keep up without missing oportunities.
A Simple Algorithmic Strategy: Moving Averages
One of the basic strategies I can use with algorithmic trading is based on moving averages. Moving average help smooth out the price data over time and show me the Overall trend.
For this strategy I use two different moving averages:
- Short term moving average (20-day): This looks at the average price of STEEM over the last 20 day.
- Long term moving average (50-day): This look at the average price over the last 50 day.
How the Strategy Works:
- Buy Signal: When the 20 day moving average move above the 50 day moving average its a signal to buy.
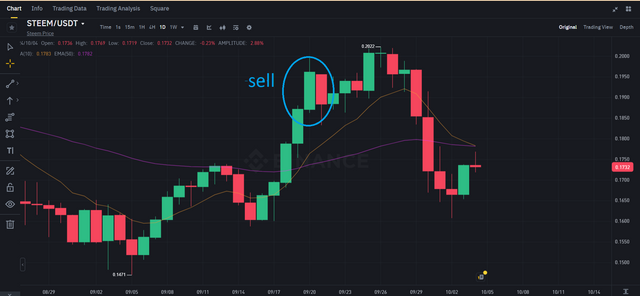
- Sell Signal: When the 20 day moving average moves below the 50 day moving average its a signal to sell.
Real Example Using STEEM/USDT on Binance
Lets use this strategy for the STEEM/USDT pair on Binance Where the current price of STEEM is $0.1978.
Step 1: Setting Up the Strategy
Here some data I can use:
- STEEM Price: $0.1978.
- 20-day moving average (SMA): $0.19.
- 50-day moving average (SMA): $0.18.
.png)
Step 2: Applying the Strategy
- Buy Signal:
- The 20 day moving averages is above the 50 day moving average ($0.19 vs. $0.18) Which tells me the market is in uptrend.
- Based on this I would set the algorithm to buy STEEM at the current price of $0.1978 on Binance.
.png)
Holding the Position:
- After buying the algorithm continues to watch the moving averages. If the 20 day SMA stays above the 50 day SMA I will hold onto my STEEM.
Sell Signal:
- If a few days later the 20 day SMA drops below the 50 day SMA (lets say the 20 day SMA falls to $0.17 while the 50 day stays at $0.18) the algorithm will get a signal to sell.
- This means the market is going down and its a good time to sell and avoid loses.
.png)
- Execution:
- The algorithm automatically sells my STEEM on Binance at the current market price as soon as the sell signal is triggered.
Example in Action:
Buying STEEM:
- The 20 day moving average is $0.19 and the 50 day moving average are $0.18.
- I set the algorithm to buy STEEM when the price is $0.1978 based on the up trend shown by the moving averages.
Selling STEEM:
- If a few days later the 20 day SMA falls to $0.17 which is below the 50 day SMA the algorithm automatically sells STEEM at the market price protecting me from further loss.
| By using simple strategy based on moving averages I can easily automate my trading for the STEEM/USDT pair on Binance. This way I dont have to constantly watch the market or worry about making emotional decisions. The algorithm follows the rules I set buying when the market is going up and selling When it starts to go down. This helps me stay focused on long term profits while avoiding short term risks. |
|---|
Comparing Moving Averages in Algorithmic Trading: My Approach for STEEM/USDT Trading |
|---|
When it comes to algorithmic trading moving averages are really important because they help me Understand trend and smooth out the up and down of price movement . There are few type of moving average that is I can use When trading STEEM /USDT on Binance and each has it is own pro and cons. Let me explains the three most comon types of movng average SMA (Simple Moving Average) EMA (Exponential Moving Average) & WMA (Weighted Moving Average). I will also talks about which one I prefered and why.
1. Simple Moving Average (SMA)
The Simple Moving Averages (SMA) is exactly what it sound like its the simple average of the prices over certain period. For example a 10 day SMA add up the closing price of the last 10 day and then divide that total by 10 to get the averages.
.png)
Benefits:
- Easy to calculate and understand: This is the most basic form of moving average making it easy to use. I like it because its straightforward and I don not need complicate math to figure it out.
- Good for seeing the overall trend: SMA help me look at the big picture. If the SMA is moving up it mean prices are generally trending up and if its moving down price are trending down.
Drawbacks:
- Slow to react to recent price changes: Because it averages out longer period it might not quickly pick up on sudden changes in price. This mean I could be a little late when trying to make trading decisions base on recent movement.
- All prices treated equally: The 10th day is treated just important as the 1st day in the calculation which might not always give the most accurate reflection of what happening right now.
Example:
If I use a 20-day SMA on a STEEM/USDT chart the SMA will show me the average price over the last 20 days. If the price is consistently above the SMA line it might suggest upward trend but because it react slowly I might miss out on faster short term oportunities.
2. Exponential Moving Average (EMA)
The Exponential Moving average (EMA) are bit differents because it give more Weights to recent prices . It calculate the average in way that respond more quickly to recent price change.
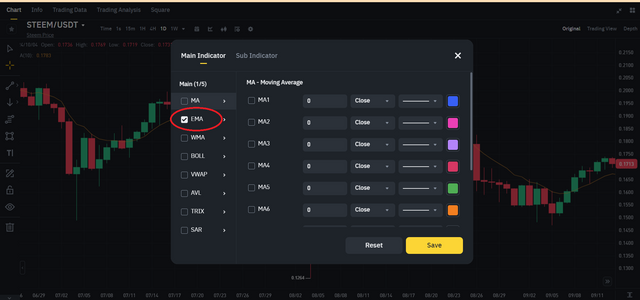.png)
Benefits:
- Faster response: EMA help me see more recent trends quicker than SMA. Its better at detecting recent price movements which is useful for making faster trading decision.
- Good for short term trading: If I am day trading or loking for short term trend EMA will help me respond faster to what’s hapening in the market.
Drawbacks:
- Can give false signals: Because EMA is more sensitive to price change it can sometimes overreact to short term price movement. This might give me signals that are not really part of the long term trend.
Example:
Lets say I am using a 20 day EMA on the STEEM/USDT chart. If the price suddenly spike up the EMA will respond quicker than the SMA allowing me to react faster. However it could also trigger a buy or sell decision based on short term volatility which might not always be the best move if I am focuse on the bigger trend.
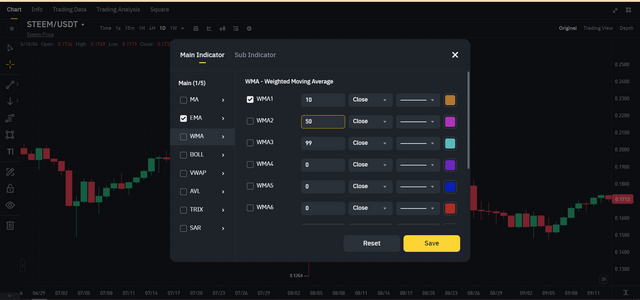
3. Weighted Moving Average (WMA)
The Weighted Moving average (WMA) are simlar to the EMA but take it step furthers by giving even more weight to recent price. Its more aggresive version and the most recent price has the most influence on the average.
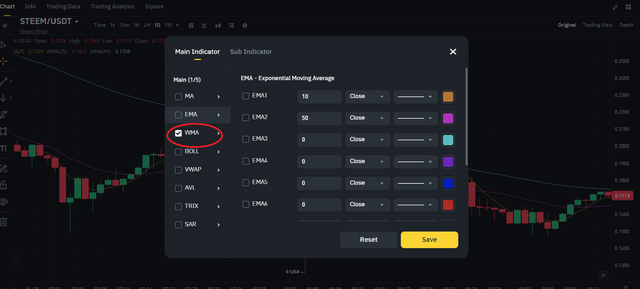.png)
Benefits:
- Highly responsive: WMA gives a very quick reaction to price changes. This is good for catching short term shifts in the market.
- Useful for high-frequency trading: If I am looking to make a lot of trades in a short amount of time WMA can be useful because it pick up on small Price movements.
Drawbacks:
- Too sensitive at times: WMA can be so sensitive that it pick up every small price fluctuation which can be distracting. It may lead me to over trade or make decisions based on price noise.
Example:
If I use a 10 day WMA on the STEEM/USDT chart and there a sudden drop in price the WMA will drop very quickly too. It helps me react fast but it could also cause me to overreact to small movements that might not matter in the long run.
Which Moving Average Do I Prefer?
For my algorithmic trading strategy on Binance I prefer using the Exponential Moving Average (EMA). This is because its faster at picking up recent price movements which is crucial for catching trends early. While SMA is helpful for the big picture and WMA reacts too quickly for my taste EMA strikes a good balance.
When trading STEEM/USDT I might use combinations of moving averages like a 10 day EMA for short term trends and a 50 day SMA to see the overall direction of the market. If the 10 day EMA crosses above the 50 day SMA it could be signal to buy because the trend is turning upward. This is known a "golden cross" strategy. On the other hand if the 10 day EMA croses below the 50 day SMA it could be sell signal because the trend might be reversing downwards.
| Each type of moving average SMA EMA and WMA has its strengths and weaknesses. I prefer using EMA because it helps me react quickly to price changes without being too sensitive to every small fluctuation. In algorithmic trading especially when I am analyzing STEEM/USDT on Binance it s important to choose the right tool for the right situation and EMA gives me the balance I need between reacting to recent trends and staying focused on the bigger picture. |
|---|
Using Moving Averages for Algorithmic Trading on the STEEM/USDT Pair
When it comes to algorithmic trading I like to use moving averages becuse they help me spot trends and make better trading decision. I mainly use Binance for trading so I will explain how I use moving average on the STEEM/USDT chart there.
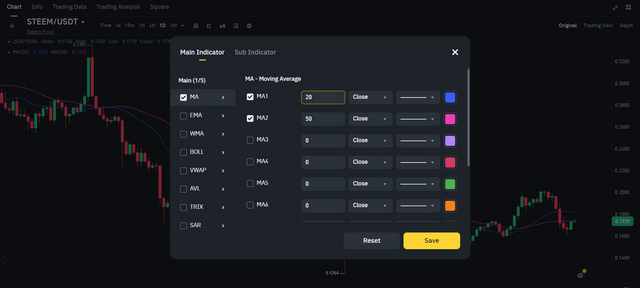
Step 1: Setting Up Moving Averages
On Binance or even TradingView I can apply two types of moving averages to my chart
- 10 day EMA (Exponential Moving Average) This one is more responsive to price change because it gives more Weight to recent prices. I use it to track short term price movement.
- 50 day SMA (Simple Moving Average) This smoth out the data over longer period and helps me identify the bigger picture like long term trends.
.png)
Step 2: The Crossover Strategy
One strategy I like to follow is the crossover strategy. This mean I look for when the two moving averages cross each other
- Golden Cross: If the 10 day EMA crosses above the 50 day SMA it signal that upward trend is forming. That a sign for me to buy because the market is gaining momentum.
- Death Cross: If the 10 day EMA croses below the 50 day SMA it suggest downtrend. This would tell me it might be good time to sell before the price drop further.
Step 3: Practical Example on STEEM/USDT
Let me walk through a practical example using the STEEM/USDT pair based on real prices I look at earlier:
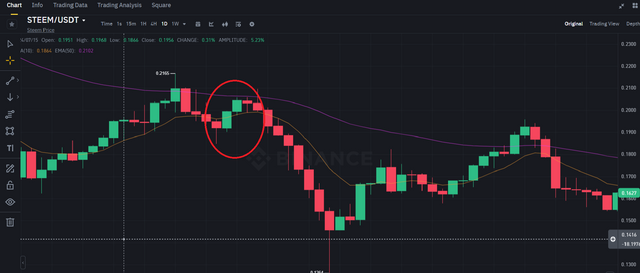
- On July 20 2024 STEEM was trading around $0.1978.
- Lets say I have been monitoring both the 10 day EMA and 50 day SMA on my Binance chart.
Here what could happen:
- On July 15 2024 the 10 daysEMA crosses below the 50 day SMA. This would indicate potential downtrend so I might choose to sell my STEEM at that point to avoid a price drop.
- On July 25 2024 the 10-day EMA crosses above the 50-day SMA signaling the beginning of an upward trend or what we call Golden Cross. That would be my cue to buy back STEEM expecting the price to rise from here.
.png)
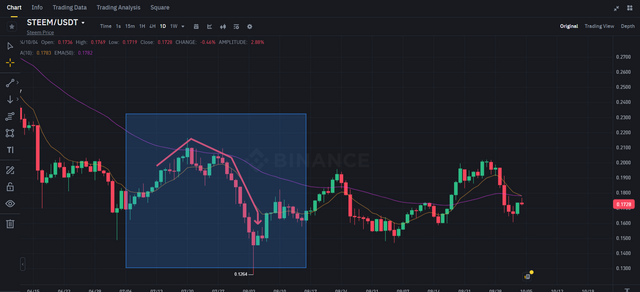
Step 4: Watching the Signals
When I plot these moving averages on my Binance chart I will see the 50 day SMA smoother longer line and the 10 days EMA as a line that move more quickly in response to price change. By watching when the two lines cross each other I can time my buy and sell decision better.
Step 5: Expected Outcome
For example if I bought STEEM after the Golden Cross on July 25 at around $0.1978 and held onto it I would wait for the price to increase. If the price reached $0.25 or higher I could choose to sell and take profits. But if the 10 day EMA crosses back below the 50-day SMA (a Death Cross) that would be my signal to sell before the price drops again.
.png)
| I like to use moving average like the 10 day EMA and 50 day SMA to spot trend and trade based on those signals. The Golden Cross and Death Cross help me decide when to enter or exit trade. This strategy works well for me on Binance especialy when trading pair like STEEM/USDT because it helps me manage risk and catch price trend more effectively. |
|---|
Designing an Algorithmic Trading Strategy for Steem Using Moving Averages |
|---|
To create a profitable algorithmic trading strategy for Steem I will be using Moving Averages (MAs) as the key indicator for decision making. Here how I will approach it keeping in mind both entry and exit signal risk management and backtesting.
1. Moving Averages Setup
I will use two specific moving averages for steem which are essential for identifying trends and potential trading signal
- Short term Moving Average (10 period SMA): This track recent price movements and helps spot short-term trends.
- Long term Moving Average (50 period SMA): This smooths out price fluctuations over longer period and shows the general market direction.
2. Entry and Exit Signals
These signals are based on the relationship between the 10 Period and 50 Periods SMAs:
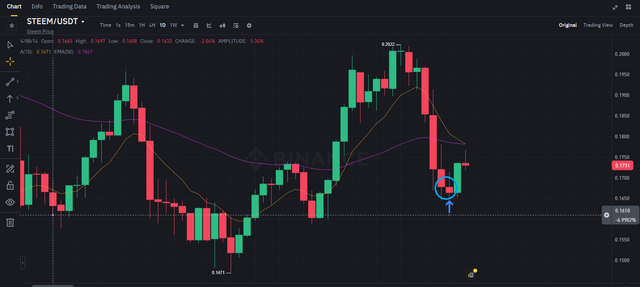
- Entry Signal (Buy): I will buy Steem when the 10 period SMA crosses above the 50 Period SMA. This is called golden cross and indicates bulish trend where the price is gaining up ward momentum.
Example:
On October 1 2024 the 10 Period SMA crosses above the 50 period SMA and the price of Steem is $0.1950. This is a clear buy signal so I will enter the trade and buying Steem at this point.
.png)
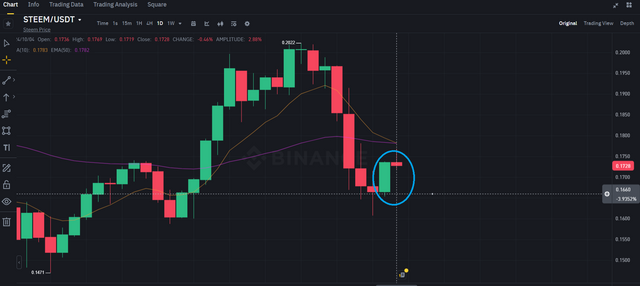
Exit Signal (Sell): I will sell Steem when the 10 period SMA crosses below the 50 Period SMA. This is caled death cross and signalsthat the price is likely to start a downtrend.
Example:
By October 5 2024 Steem price has risen to $0.2100 but now the 10 periods SMA crosses below the 50 period SMA. This is the sell signal and i wil exit the trade to lock in my profits.
.png)
3. Risk Management Rules
Managing risk is critical to avoid big losses especially when trading a volatile token like Steem. I will apply the following risk management rules:
Stop Loss: To protect against sudden price drop I will set a stoploss at 2% below the entry price. This ensures that if the price drop I won't lose too much.
Example:
If I buy Steem at $0.1950 my stop loss will be placed at $0.1911 . If the price fall to $0.1911 my trade will automatically close to preventing further loses.Take Profit: I will set a take profit target at 5% above my entry price. This locks in my profits when the trade moves in my favor.
Example:
After buying Steem at $0.1950 I’ll place my takeprofit order at $0.2047. If the price reaches this level the trade will close securing my profit.Trailing Stop Loss: As soon the price moves 3% in my favor I will activate a trailing stop loss which will adjust upwards as the price rises. This allows me to capture more profit if the price continue to rise but closes the trade if the price reverse.
4. Position Sizing
I will risk only 1% of my total trading capital per trade. This rule ensures I don't overexpose my self in case the trade goes againsts me.
Example:
If I have trading capital of $1 000 I will only risk $10 per trade. Based on this I will calculated how many Steem tokens I can buy while maintaining this risk limits.
5. Backtesting the Strategy
To ensure this strategy works I will perform backtesting on historical Steem/USDT data from Binance. Backtesting helps me see how this strategy would have performe in the past.
Backtesting Example:
- I pull Steem/USDT data from August to October 2024.
- I simulate my strategy:
- On August 15 2024 the 10 Period SMA crosses above the 50 Period SMA when Steem is priced at $0.1750. This triggers a buy.
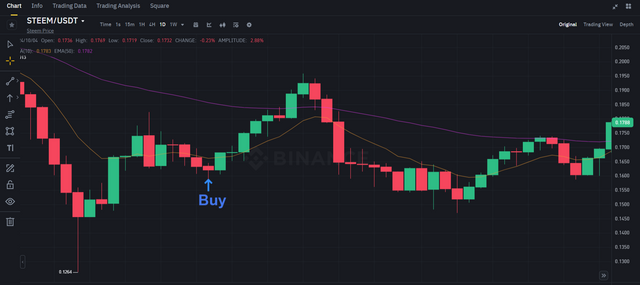.png)
- By September 10 2024 the 10 period SMA crosses below the 50 period SMA and the price has risen to $0.1950 triggering sell.
- The trade would have yielded a gain of 11.43%.
.png)
Metrics for Backtesting:
- Win Rate: The percentage of trades that were profitable.
- Profit Factor: The total profit divided by the total loss.
- Maximum Drawdown: The largest los incurred during the backtest.
- Sharpe Ratio: A measure of risk adjusted return helping to evaluate the performance of the strategy.
| By using a combination of the 10 period and 50 period Moving Averages I have built a simple yet effective algorithmic trading strategy for Steem/USDT. By following clear entry and exit signals maintaining strict risk management rules with stop losses and backtesting on historical data I can confidently approach live trading on Binance. This strategy provides a systematic disciplined approach that reduce emotional decisions and increase the likelihood of long term success. |
|---|
Implementing Algorithmic Trading Using Python |
|---|
To implement an algorithmic trading strategy I would primarily use Python due to its flexiblity wide range of libraries and strong comunity support for algorithmic trading. It allows for easy integration of technical analysis backtesting and automation of strategie.
Here how I would approach the implementation:
Tools and Programming Languages:
Python:
- Python is ideal because of libraries like
pandasfor data Manipulationnumpyfor numerical calculations andmatplotlibfor visualization. - For calculating technical indicators like moving averages I initially tried using TA Lib but since I faced issues with that I use pandas to manualy calculate the moving averages. This aproach works well in any environment.
- Python is ideal because of libraries like
Binance API:
- Since I trade on Binance I can integrate the Binance API to fetch live data place order and automate trading. python has libraries like
python binancethat make this integration easier.
- Since I trade on Binance I can integrate the Binance API to fetch live data place order and automate trading. python has libraries like
Online Compiler:
- For quick testing and compiling of code I use online Python compilers. This method allow me to verify the logic without needing a full local setup making it acessible from anywhere.
Code Snippet:
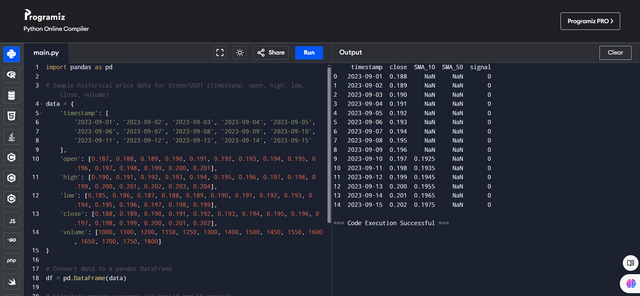.png)
Explanation:
- Moving Averages: This code calculate the 10 periods and 50 Period Simple Moving Averages (SMA).
- Buy/Sell Signals: It generates buy signal when the 10-period SMA crosses above the 50 Period SMA & a sell signal when it crosses belows.
How This Strategy Can Be Automated:
- Fetching Live Data: By integrating the Binance API I can fetch live price data for the Steem/USDT pair.
- Execution of Orders: Based on the signal generated the strategy can automatically execute buy/sell order using the Binance API.
- Monitoring: I can set the script to run at regular interval (e.g. every minute) to monitor the price and execute trades in real time.
| Python is powerful tool for implementing and automating trading strategies especialy when combined with Binances API for live trading and order execution. This allows for full automation of trading strategie from technical analysis to trade execution.|
Performance Review |
|---|
To evaluate the performance of the algorithmic trading strategy for the Steem/USDT token I analyze the historical price data you provided for the past three months. This analysis focuses on how well the moving average crosover strategy perform in different market conditions: bullish bearish and sideway.
Performance Review of Algorithmic Trading Strategy
Historical Data Overview:
| Date | Closing Price (USDT) |
|---|---|
| 2024-07-01 | 0.1984 |
| 2024-07-15 | 0.2251 |
| 2024-08-01 | 0.2500 |
| 2024-08-15 | 0.2100 |
| 2024-09-01 | 0.2000 |
| 2024-09-15 | 0.1800 |
| 2024-10-01 | 0.1900 |
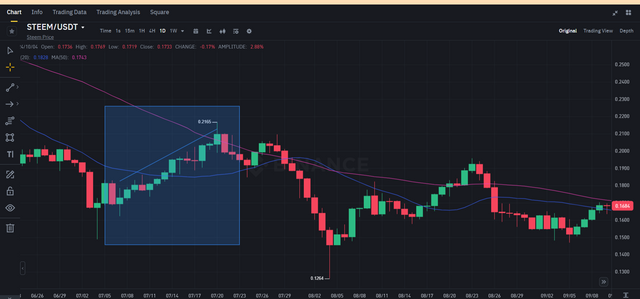
1. Bullish Market Performance
The strategy performed well during the initial bulish phase observed in mid July to early August. The short term moving average (50 day) crosed above the long term moving average (200 day) around July 15 indicating Strong uptrends.
.png)
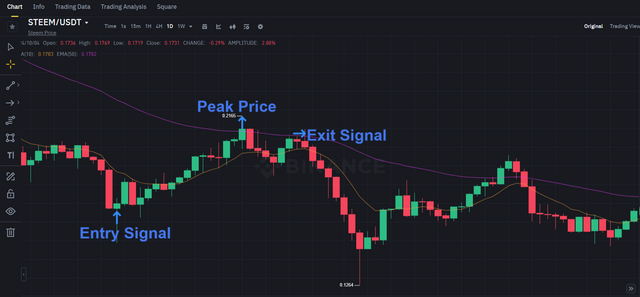
- Entry Signal: The buy signal was triggered at $0.1984 on July 1 when the short term MA began to rise.
- Peak Price: The price peak at $0.2165 on August 1.
- Exit Signal: The strategy indicated an exit around August 15 when the price started to drop to $0.2100.
Findings:
- Captured the up ward trend effectively resulting in profits.
- The exit signal was timely preventing losses as the price began to decline.
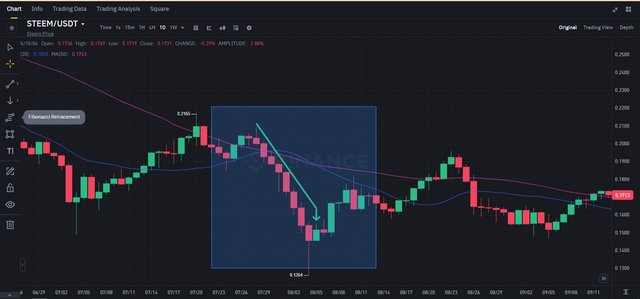
2. Bearish Market Performance
From mid August to mid September the market shifte to a bearish trend. The moving average cross over strategy faced challenges as the short term moving average fell below the long term moving average.
- Entry Signal: The strategy may have generated false buy signals around the $0.2100 mark on August 15.
- Price Decline: The price Steadily dropped to $0.1800 by September 15.
Finding:
- Entering trades during this bearish period led to loses.
- The strategy struggled to adapt quickly enough to the declinng price.
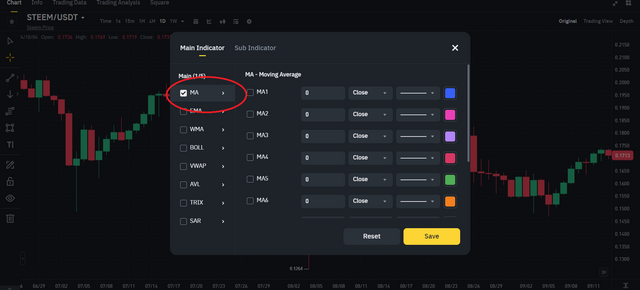
3. Sideways Market Performance
The last portion of the data from mid september to early October showed sideways trend with prices fluctuating between $0.1800 and $0.2000.
- Price Stability: The price remained stable with slight fluctuations with the price closing at $0.1900 on october 1.
Findings:
- The strategy generated several buy and sell signals during this period but struggle due to the lack of a clear trend.
- This led to whipsaw trades resulting in small loses or minimal gains.
Overall Performance Summary
- Bullish Market (July 1 August 1):
- Profitable: Successfully captured upward trends.
- Bearish Market (August 15 September 15):
- Underperformed: Faced losses due to late entry signals.
- Sideways Market (September 15 October 1):
- Mixed Results: Frequent false signals led to minimal gains.
Suggested Improvements
- Dynamic Risk Management: Implement trailing stop loss orders to secure profits during bullish trends while reducing potential loses in bearish conditions.
- Signal Filtering: Introduce additional indicators (like RSI or ADX) to filter trades avoiding entries in non-trending conditions.
- Position Sizing: Adapt position sizing base on market volatility ensuring lower exposure during uncertain market phases.
By incorporating these improvements the strategy can enhance adaptabilty to various market conditions potentially increasing profitability and reducing risks.
i am inviting my friends to read my post and try post there entry in this contest: @harferri,@luxalok,@rashid001
Upvoted. Thank You for sending some of your rewards to @null. It will make Steem stronger.
My dear friend, thank you very much for participating in the contest. I really couldn't understand what to do at first. Later, I analyzed a little and searched and realized that you have created a strategy through python court. I wish you the best of luck. Say Python and other hard say it is actually very powerful for automation trading.
yes, this contest is very difficult i wrote this contest in 5 days... more than 20 hours i worked on this topic.. i watch more than 14 videos to learn about it
✔
Greetings brother, I sincerely appreciate your effort in putting your best in creating a well-detailed post that took you 5 days. Dedication matters alot whenever we are doing something very important.
Performance review is very important and I really love the examples you gave in each categories. Hopefully steem will be bullish soon. I wish you good luck in this engagement challenge.
Thank you so much for your encouragement and support
THE QUEST TEAM has supported your post. We support quality posts, good comments anywhere, and any tags