"[Reading Special Bar Combinations ] - Crypto Academy / S5W8 - Homework Post for @sachin08".
Image edited in canva
1- Explain Price Bars in your own words. How to add these price bars on Chart with proper screenshots?
PRICE BARS
Price bars visually portray the open, high, low, and close prices of a specified cryptocurrency or safety over a specified time duration.
The price bars are of lines, the vertical line, and the horizontal lines. The vertical line on a price bar denotes the high and low prices of a specified cryptocurrency for the time. The left and right horizontal lines on each price bar of crypto stand for the open and closing prices of that very crypto.
Price bars look like a lot of independent flecks. A little practice on the part of a cryptocurrency trader is needed to see these price bars, but inside each fleck of the chart, there is a nation of information that is very crucial in trading.
HOW PRICE BARS ARE ADDED ON CHARTS
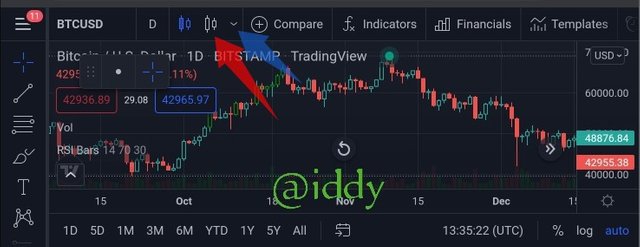
I will be using tradingview.com to describe how to add price bars to charts. The first thing to do is log in to tradingview.com. After logging in I noticed a price structure, but it was made up of candlesticks. The next thing to do is look at the left top corner of the screen, the candlestick that red arrow is pointed at will be seen as indicated in the screenshot below:
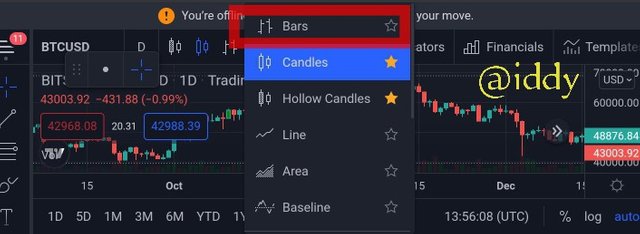
Click on the sign close to the candlestick that the blue arrow is pointed at as indicated above on the screenshot, after that, options like bars, candles, hollow candles, etc will display on the screen, click on the bars option as indicated below:
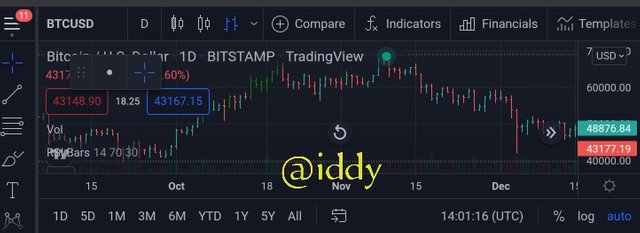
The price structure indicator will change from that of candles to bars as indicated below:
2- How to identify trends using Price Bars. Explain for both trend. (Screenshots required)
IDENTIFYING AN UPTREND USING PRICE BARS
Recognizing an Uptrend of a specified cryptocurrency is done if a sequel of higher highs concurrently with higher lows is seen, therefore this implies that a trend is shaping. We can furthermore comprehend that bulls outnumber bears.
For a crypto trader to identify an uptrend using bars, he must, first of all, pay attention to the highs and lows of the bars, and If he has two higher-highs and two higher lows on the 1st day, and the 2nd day, it is not necessarily that the market of that particular currency is in an uptrend. Mine, Prices don't stride in straight lines. A sequel of two or three higher highs is hesitated by one or two lower highs.
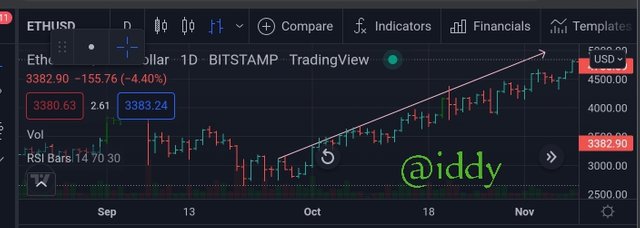
An entire sequel of higher highs every single day can be seen from the screenshot above, it can be seen that every close is higher than the close the day previously. At the same time, the price of ETH/USD is making a new high virtually on several days but not every day. We can see a close higher than the open and low of the day higher than the low of the day before for recognizing an Uptrend.
IDENTIFYING A DOWNTREND USING PRICE BARS
A downtrend is a sequel of down-time bars which implies a close which is lower than that of a previous day defined by lower lows and lower highs in a prevalence of bars.
For instance, when giving close attention to the downtime in the screenshot below, after the first day, in subsequent days, each of these bars has a close lower than the close a day before:
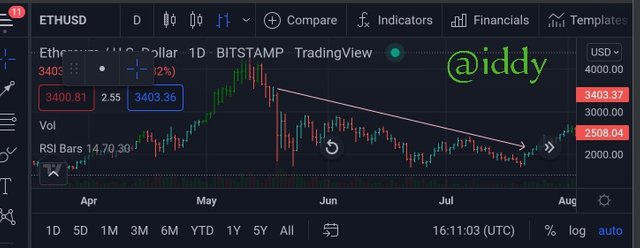
It can moreover be suspended in the highs but there will exist a Lower low every following day which points to the inception of a downtrend.
When recognizing a downtrend, a sequel of lower highs is a reasonable substantiating indication of the sequel of lower lows. When crypto traders glimpse these fresh lower lows every day, therefore they choose to sell their cryptos as Merchants are not ready to clasp a plummeting cryptocurrency, and therefore the selling pressure boosts.
3- Explain the Bar Combinations for Spending the Day inside for both conditions. (Screenshots required)
SPENDING THE DAY INSIDE FOR AN UPTREND
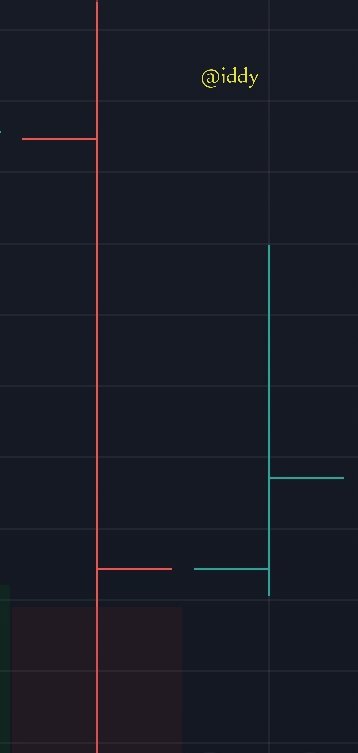
The above screenshot exhibits the inside day. An inside day pertains to a price bar mixture that fulfills these two standards;
(1)The High is lower than the high of the day before.
(2)The Low is higher than the low of the day before.
An inside day bar of a crypto price is a bar "inside" the last day's high-low span. It indicates uncertainty. Buyers were perplexed about the security to purchase more of the specified crypto and Sellers are not extremely motivated to sell their crypto.
The inside day doesn't imply what's going to transpire the following day. But it tells that the market of specified crypto is beginning to reexamine what it thinks about this security.
SPENDING THE DAY INSIDE FOR A DOWNTREND
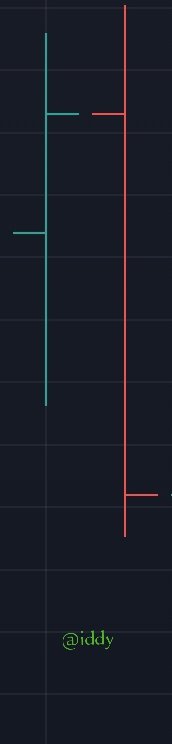
The above screenshot exhibits the inside day. An inside day pertains to a price bar mixture that fulfills these two standards;
(1)The High is higher than the high of the day before.
(2)The Low is lower than the low of the day before.
An inside day bar of a crypto price is a bar "inside" the last day's high and low span. It indicates uncertainty. Sellers were perplexed about the security to sell more of the specified crypto and buyers are not extremely motivated to buy the crypto.
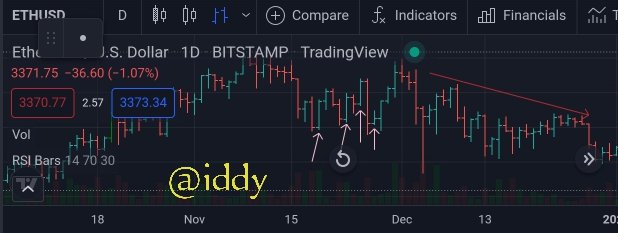
4- Explain the Bar Combinations for Getting outside for the Day for both conditions. (Screenshots required)
THE BAR COMBINATIONS FOR GETTING OUTSIDE FOR THE DAY FOR AN UPTREND
The above screenshot refers to the outside day. On an outside day, the high-low span of the bar is out of the span of the bar before. The open and close can seem anywhere on the outside day bar, but this difference stands out.
- The Open is at the deep(low) and the Close is at the tall(high). This composition implies that something fresh has transpired to prompt bullish buying right up to the time the day ends.
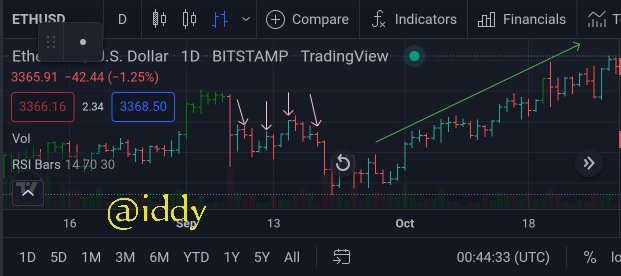
THE BAR COMBINATIONS FOR GETTING OUTSIDE FOR THE DAY FOR A DOWNTREND
From the screenshot above, the Open is at the tall(high) and the Close is at the deep(low). It can be inferred the contrary supply-demand layout here. Belief turns bearish here and sellers have dominated buyers, straight to the stop of the day
Generally, the outside day may imply a reversal in continuation relying on the location of the open and close and which path the security is trending.
The outside day has a higher high by description, together with a higher close which signifies continuation in an uptrend and setback in a downtrend, particularly if the close is at the tall(high).
Likewise, the outside day has a lower low by description, so it substantiates continuation in a downtrend and setback in an uptrend.
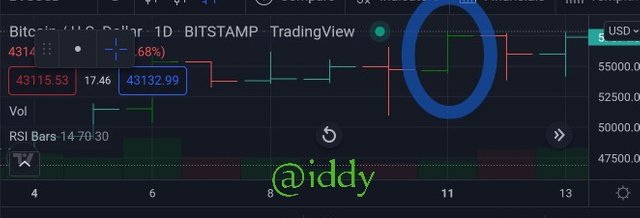
5- Explain the Bar Combinations for Finding the close at the open for both conditions in each trend. (Screenshots required)
From the screenshot above, a series of bars where the close is at the open or near to the open can be seen. A close at or near the open indicates uncertainty in the market of a specified cryptocurrency. What a crypto trader should be wondering is whether this bar combination is implying continuation or setback.
Nonetheless, When the open and close are at (or virtually at) a similar price and they are at the high or low of the day, a trader has a tremendous opportunity of inferring the trend will proceed or offset.
If he sees this price combination in an Uptrend, then he needs to glance at the ticks of open and close. If the open and close are close to the high, then the uptrend will perhaps stimulate (proceed). If the open and close are close to the low, then the uptrend will perhaps offset.
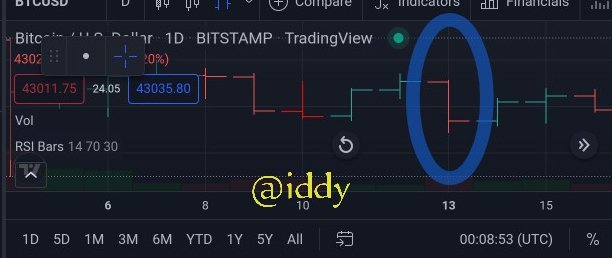
If a trader sees this price combination in a Downtrend, then he needs to glance at the ticks of open and close. If the open and close are close to the low, then the downtrend will perhaps proceed. If the open and close are close to the high, then there will be a feasible offset as shown in the screenshot below:
CONCLUSION
I have learned from this lecture from professor @sachin08 that Price bars visually portray the open, high, low, and close prices of a specified cryptocurrency or safety over a specified time duration.
The price bars are of lines, the vertical line, and the horizontal lines. The vertical line on a price bar denotes the high and low prices of a specified cryptocurrency for the time. The left and right horizontal lines on each price bar of crypto stand for the open and closing prices of that very crypto. I also learned how price bars are added to charts, I practiced it myself. I was able to identify an uptrend and a downtrend using price bars. Spending the day inside for both uptrend and downtrend, and the bar combination for getting outside for the day for both uptrend and downtrend are included in what I learned. Finally, I learned the bar combination for finding the close at the open for an uptrend and a downtrend. Professor @sachin08 sir, thank you so much for imparting knowledge to me, I am happy to learn.
Thank you so much for reading!
Cc:
@sachin08