Steemit Crypto Academy Week 14 - Homework Post for @fendit
The application of the EWT theory
The said Ralph Nelson Elliot who propounded the Elliot waves theory from the book he wrote “The wave theory” in the year 1938 made it applicable as one of the tolls among various others used in technical analysis in use to detect market cycles and update trends which is in another way beneficial in getting basic information before make investment decisions.
The waves are said to be caused by a name called crowd psychology which is what motivates the investors and the general public and allows them rush in risking their investment from extremely positive to extremely negative within a short period of time along with their confidence in the market platform.
The theory could be used in two different major ways:
For the purchase of certain assets: after making basic follow up and investigation about the price trend, we will be able to connote if it is reasonable or businesss wise to buy or not. It could also be said to be a good tool to to use in having a stand or say in the market over the price and what to expect maybe later. And it helps to know when it’s the rightful time to sell assets and take gained profits
Working with a stop loss: when identifying between the two waves which are the impulsive and corrective wave a limit could be fixed to determine easily where to put the stop loss.
What are impulsive and corrective waves
Impulsive waves are said to be waves that flows in accordance to the market trend it indicates from when the asset is at a penny stage and little investors invest in the platform but at a very low market price rate but when some of the investors sell their coin or withdraw their profit it tends to increase the the price because other investors r coming in due to the profit earned by the first set then the price would still drop a bit due to investors withdrawing their profit and also selling their positions then a Little increase in profit might occur due to more investors but won’t be as much as before which is caused by the bullish traders that will reluctant to buy the coins at a very high market price.
Corrective wave is said to be the opposite of impulsive wave because it flows in the opposite direction of the impulsive trend which makes it hard to spot.
But in accordance to the way they develop the waves could be grouped into three charts which they create
Zigzag : if the spotted waves go in a trend of zigzag format which could be explained as when the middle wave tends to be shorter than the two opposite waves
Flat : in this wave they’re all connected and easily spotted because they will have the same length
Triangle: this format is said to be very hard to spot because it means volatility and volume are both decreasing
How to spot easily between the two waves
It could be clearly shown or seen in the charts that the impulsive wave goes higher in accordance to the market trend or lower but the corrective wave goes lower when the impulsive is higher or higher when the impulsive is lower in opposite directions
The impulsive mainly shows the increase rate of return on investment for investors and how they earn more when they withdraw their profits or trade their positions while the corrective wave shows how it investors reduces the more they withdraw their positions or profit merely earned
The EWT theory in summary
The theory could be said to be a base and meaningful mechanism used to figure out when to invest in a market platform and when not to do as to know when it is in its term of profit or loss and helping in makin investors know when it is the right time to display their assets for sale or when it’s due time to withdraw their profit in terms of upcoming loss circumstance
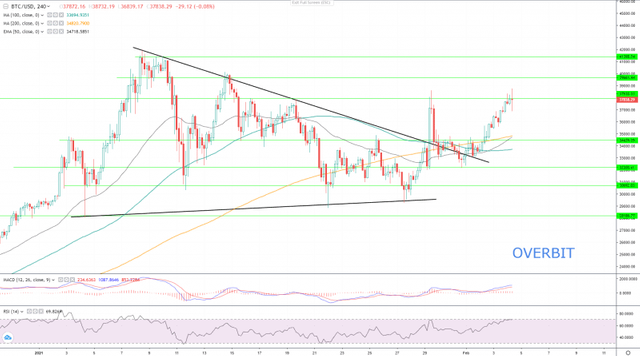
Bitcoin price based on Overbit
The impulse made in February 1st indicates that Bitcoin is currently making up a wave 3 pattern and if it remains below the said resistance, BTC will be most likely to drop at $34450 levels to test the previous resistance of the last impulse as support.
The drop of the Bitcoin is also described with a bat diagram pattern, which is usually formed during the corrective waves that indicates the opposite flow of impulse wave.
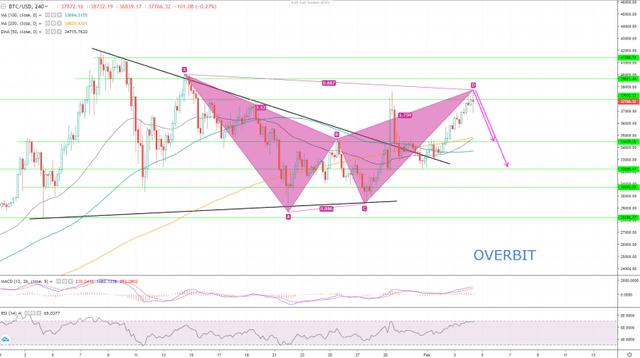
Bitcoin price based on Overbit
As the pattern connotes, the value price of the asset after getting to the D point of the pattern should retrace to the point B to test it as a support, and to the point C if it closes below B.
On the other hand, the logarithmic growth of the number of Bitcoin addresses signals the Bullish continual of Bitcoin. Another signal of the money inflow in crypto-trading and Bitcoin trading is the recent occurrence related to Robinhood and Redditors, the growing interest in investing more on crypto may push back some stock traders to leverage their Bitcoin share in their portfolios.
Thank you for being part of my lecture and completing the task!
My comments:
You just copied what I wrote in the lecture and spun the words.
Disregarded.
Overall score:
1/10