Steemit Crypto Academy Season 5 Beginner Course - : Reading Special Bar Combinations
.png)
Image created by me @kenneth00 in canva
INTRODUCTION
Greetings to every one in steemit reading this post, I am here to submit this week beginners homework of the steemit crypto academy introductory post given by our creative professor @sachin08 and i will be answering the question for the homework on the topic "Reading Special Bar Combinations"
1- Explain Price Bars in your own words and How to add these price bars on Chart with proper screenshots?
2- How to identify trends using Price Bars. Explain for both trend. (Screenshots required)
3- Explain the Bar Combinations for Spending the Day inside for both conditions. (Screenshots required)
4- Explain the Bar Combinations for Getting outside for the Day for both conditions. (Screenshots required)
5- Explain the Bar Combinations for Finding the close at the open for both conditions in each trend. (Screenshots required)
The Questions Has been read and understood and now it's time to answer the question

1). EXPLAIN PRICE BARS IN YOUR OWN WORDS AND HOW TO ADD THESE PRICE BARS ON CHART WITH PROPER SCREENSHOTS
In trading a trader cannot do without technical analysis because he/she will not be able to predict what to do next in the buy / sell section or trend breakout. But by Applying bars, candles and trendlines all this helps a trader to analyze for confirmations before making a buy or sell orderin the financial market.
It is never dumb but very important for traders of any tradable asset to make use of technical analysis tools before determining when to trade the market and the the price bar is one important tool.
The price bar according to professional traders is the building block of technical analysis, it defines alot of things like the trading in a stock security for a given period of time or in a crypto security for a given period of time or forex it depends on what you are trading Analysis of price bars helps to noticing a trend or range in which an underlying crypto trades.
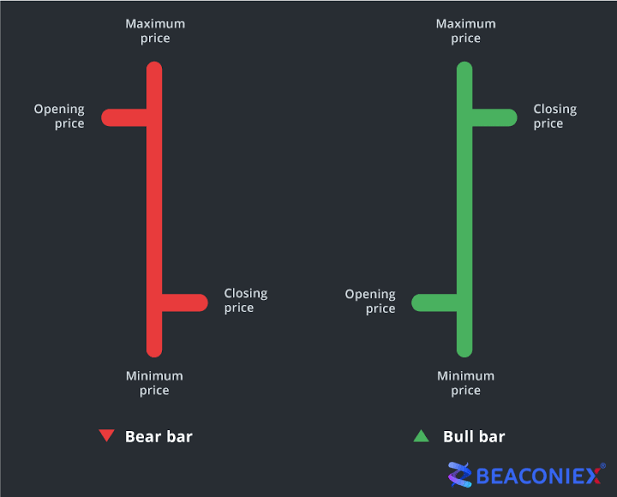
These price bars are simply vertical lines of different colors of green of red, with a point showing when the market opened for the day which normally is green in color or blue in color and another point showing where it closed for the day which is red.
How to know when an asset is experiencing a lot of activities like buying and selling is by looking at the price bar and by noticing the length of the bars and the colors if the length is long and is green that meanings alot of money is entering the market and when it is red it means alot of money is living the market but when the length of the price bars are small that means alot of money is not leaving or entering the market.
The price bar has different structural components and characteristics. Price bars are characterized by:
- HIGH
- LOW
- THE OPEN
- THE CLOSE
This is the highest point of any price formation for a given day and it is shown as the highest point of the price bar
This is the ground level of any price formation which is when the price bar reaches it's lowest level.
The Open is essentially the starting price point of that day, and it is shown on the bars by a horizontal line which originate from the left side of the price bars. It is that initial point where price started to move from.
This just explains where the point of any price of any asset close, and this is formed at the right side of a price bar of any price bar both the bearish price bar or the bullish bar.
Price bar is a good indicator or tool because it shows a trader many information that could help the trader in knowing very important information that can make him or her predict which direction the price of an asset is going next.
Ok i will be showing you how to add price bar to your trading chart and i will will be showing you this with my trading view on my phone so let's go
- Firstly locate your trading view app on your phone or browser
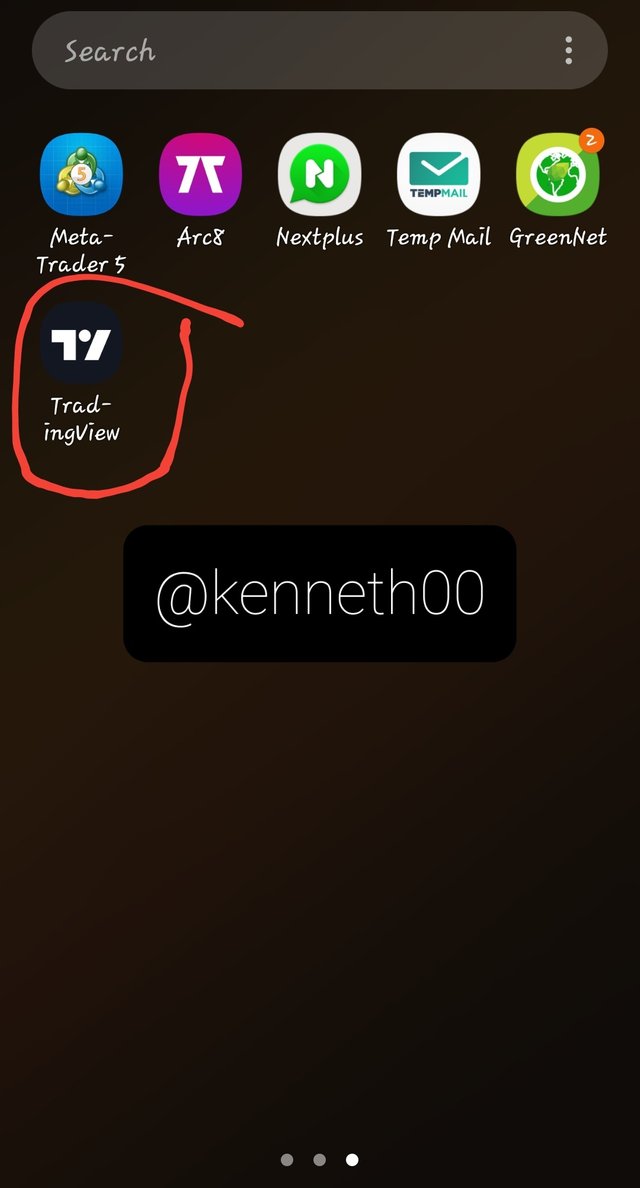
Screenshot from my phone
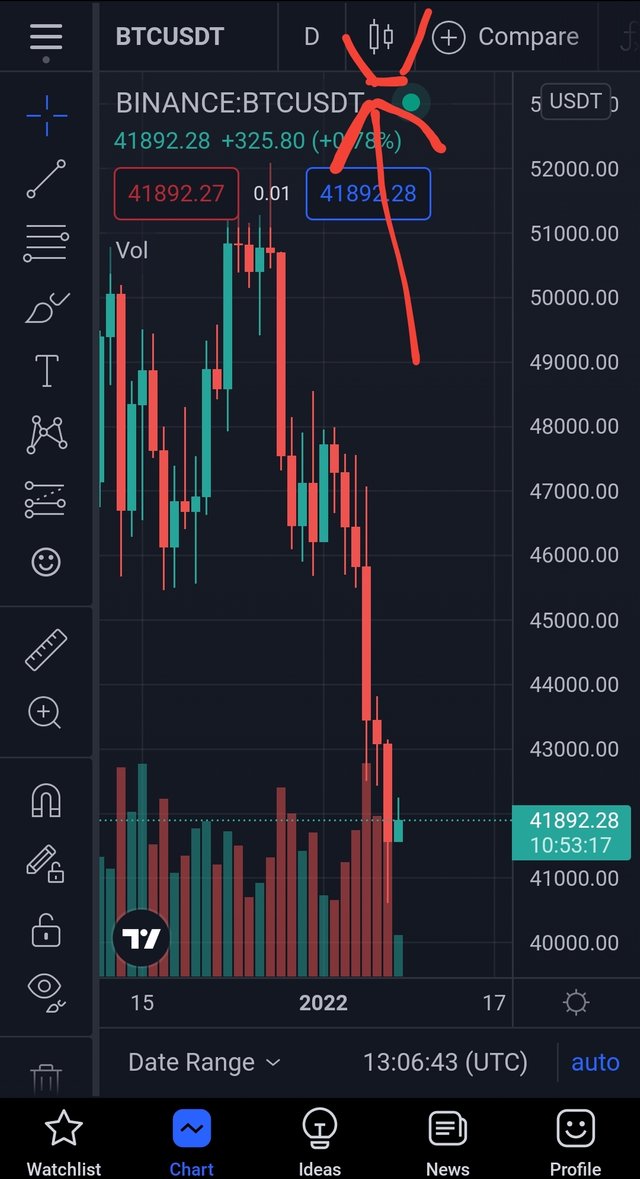
- secondly click the app then just locate the asset you want to trade and click it then it shows you the chart then at the top you will see a chart icon just click it.
- Thirdly Select the bars option and then your cardle stick chart will change to bar chart
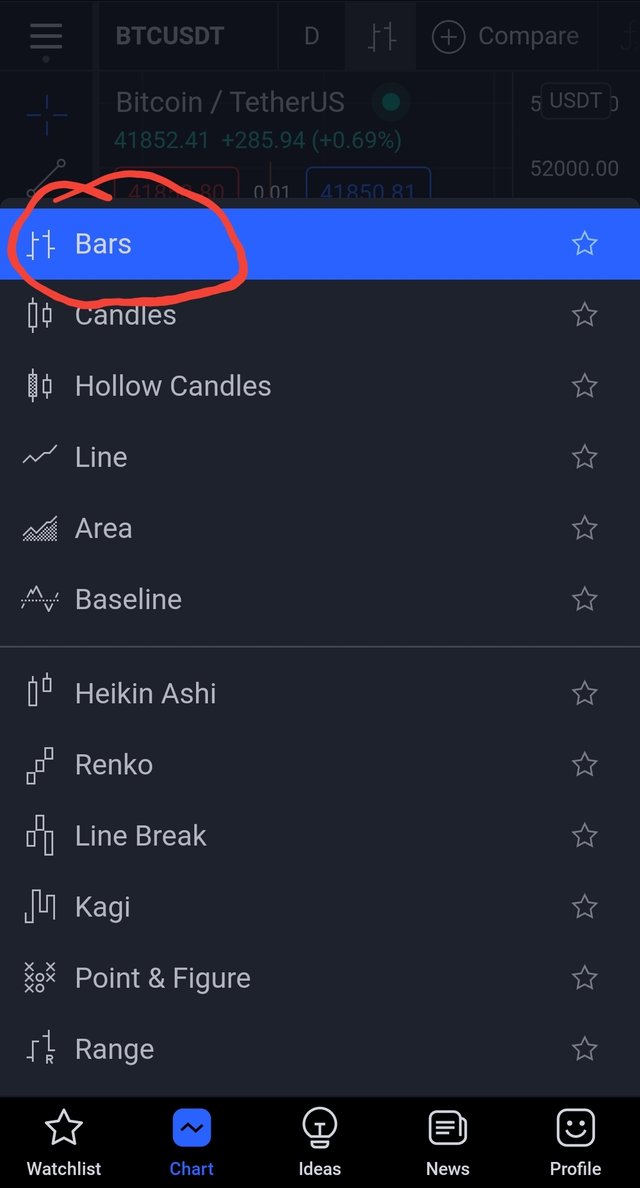
Screenshots from my phone
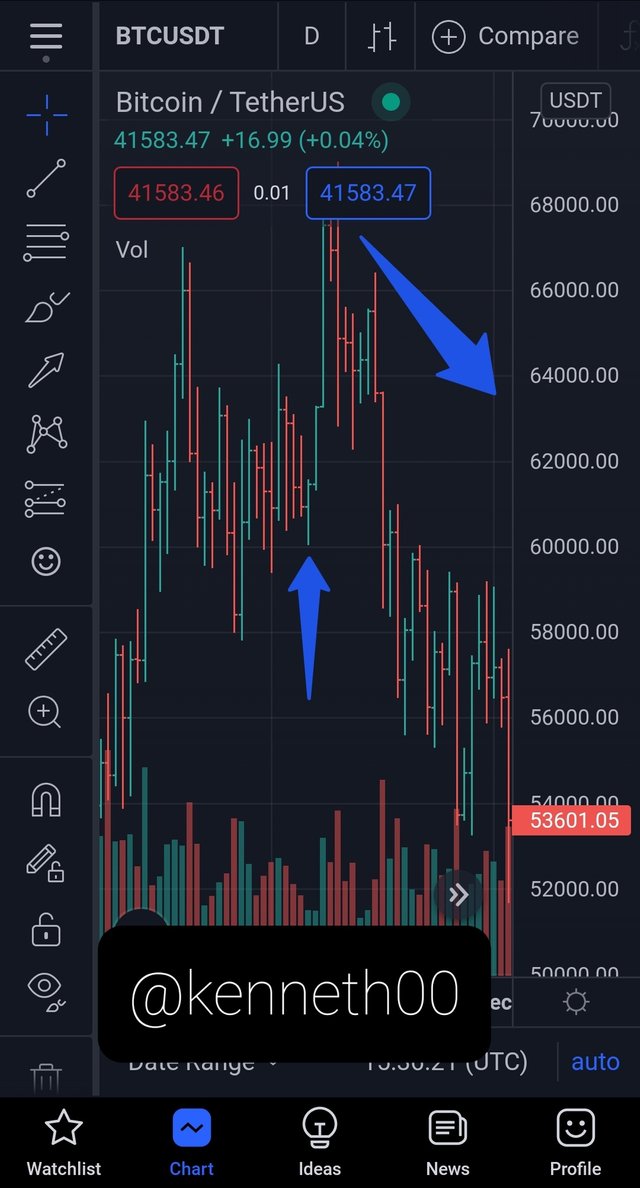
2). HOW TO IDENTIFY TRENDS USING PRICE BARS . Explain both trends. (screenshots required)
The trend of an asset price depends on the buying or selling happening at that particular time it also depends on the supply and demand of the asset or security, all this decides the trend of the asset price so if an asset price is going up then there is demand and buying of that asset happening but when the the trend is going down then there is no demand of that asset but there is supply and selling happening.
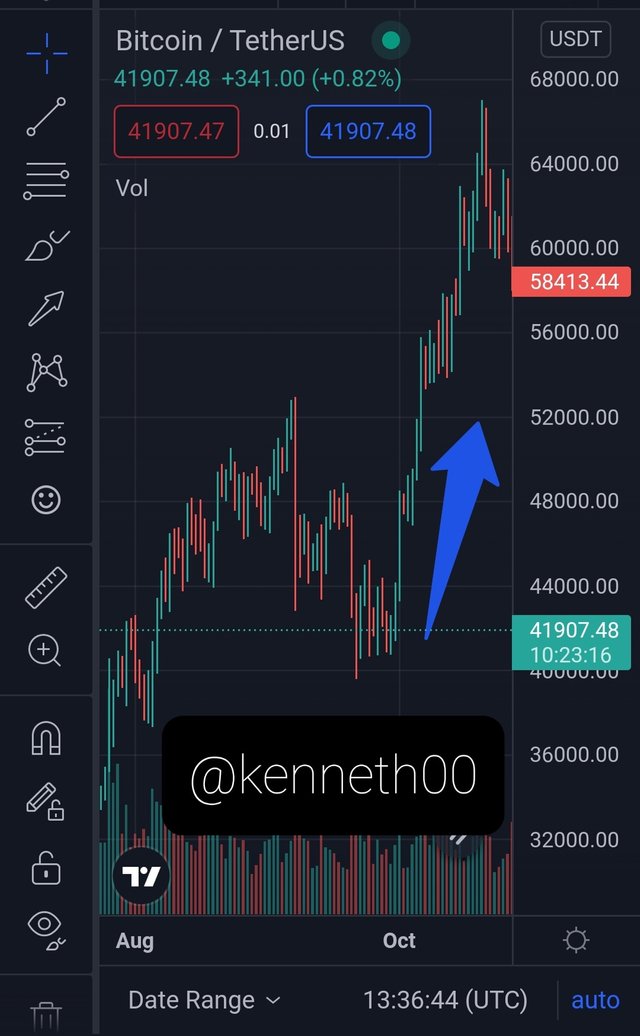
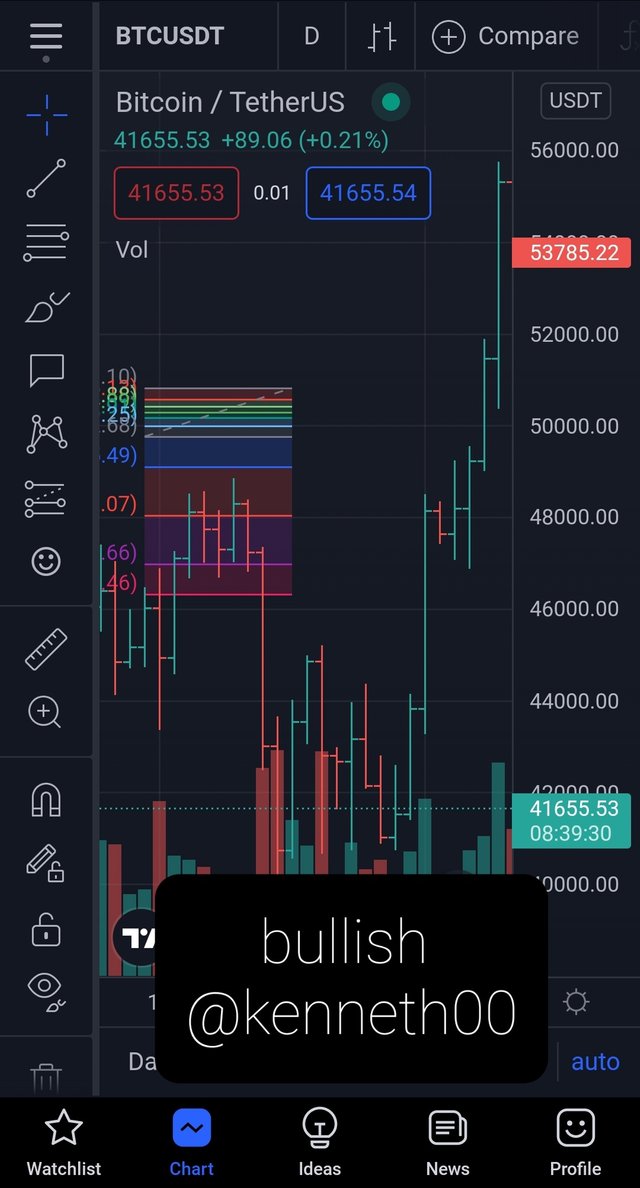
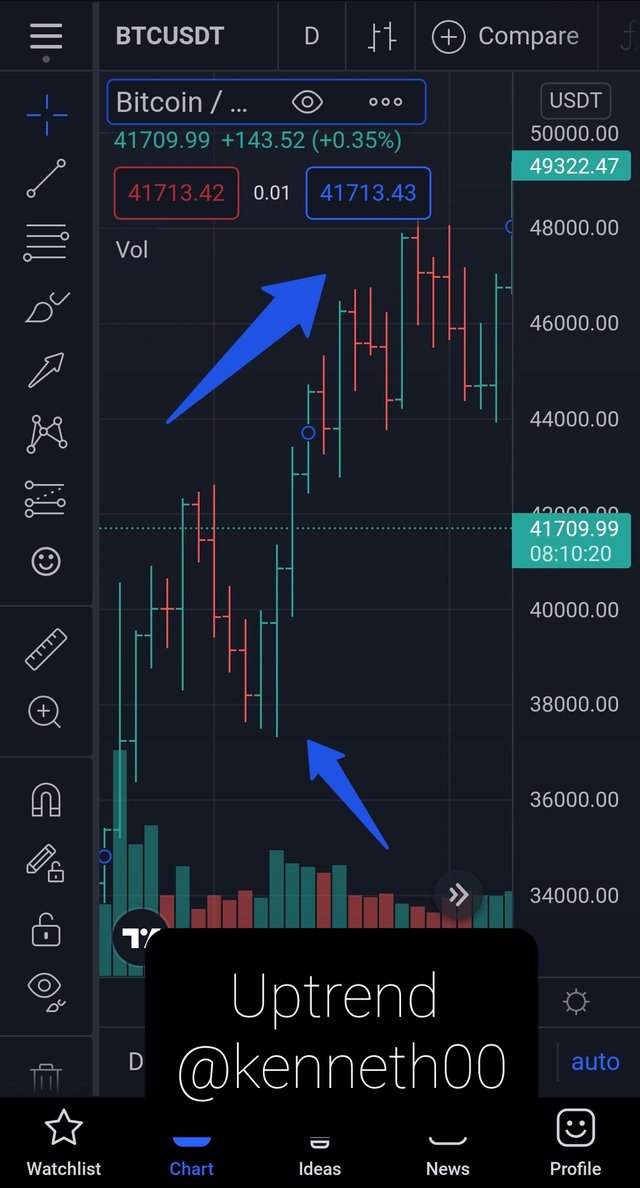
IDENTIFYING AN UPTREND IN PRICE WITH PRICE BAR
Firstly an uptrend is always a bullish and this is noticed when you can see a higher highs in the chart and higher lows because that shows there is demand and buying happening in that asset.
To know if an asset is in an uptrend with price bars then you have to find the price of the asset start from a lower point and it closed at a higher point as well as the low of the previous day being lower than the next one(Higher low). We can observe this in the picture below
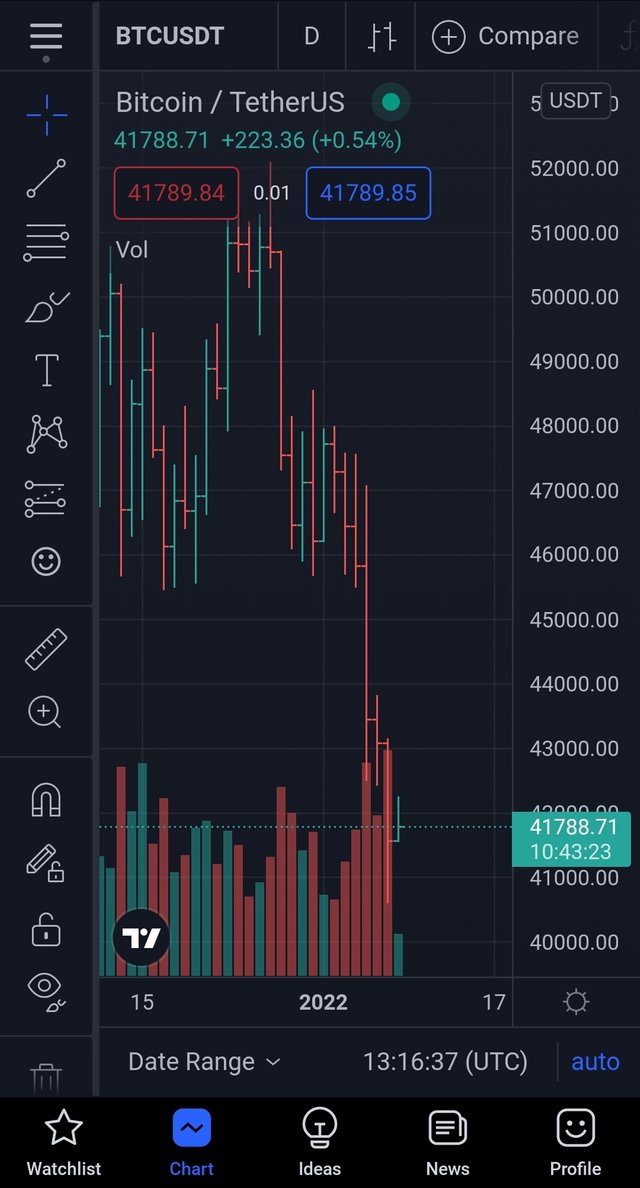
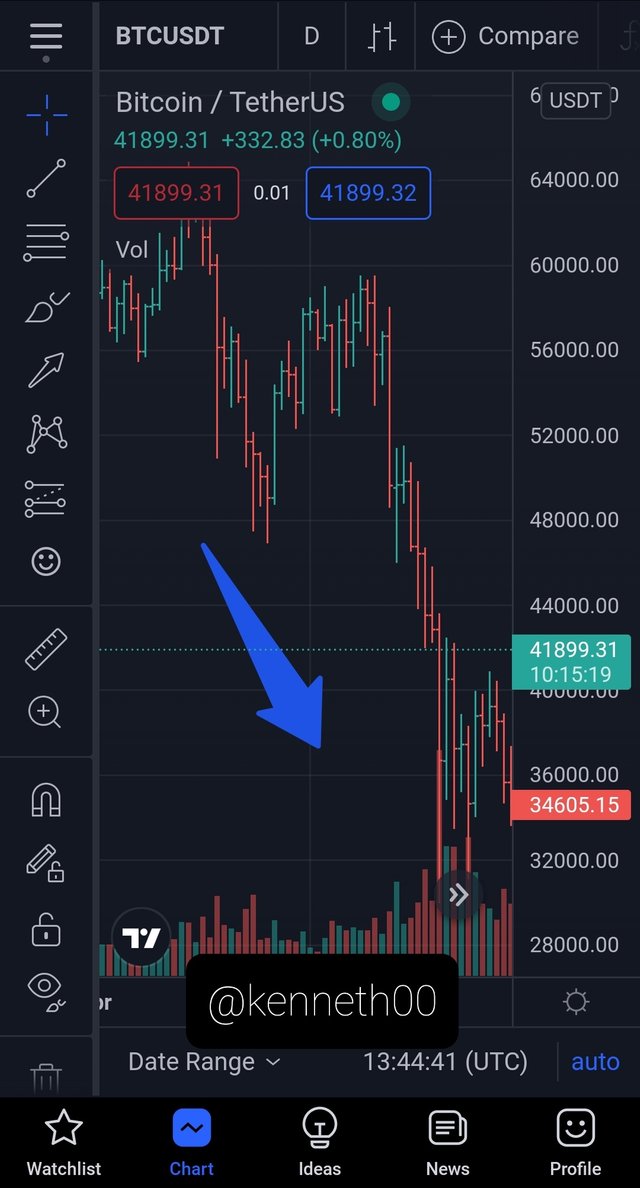
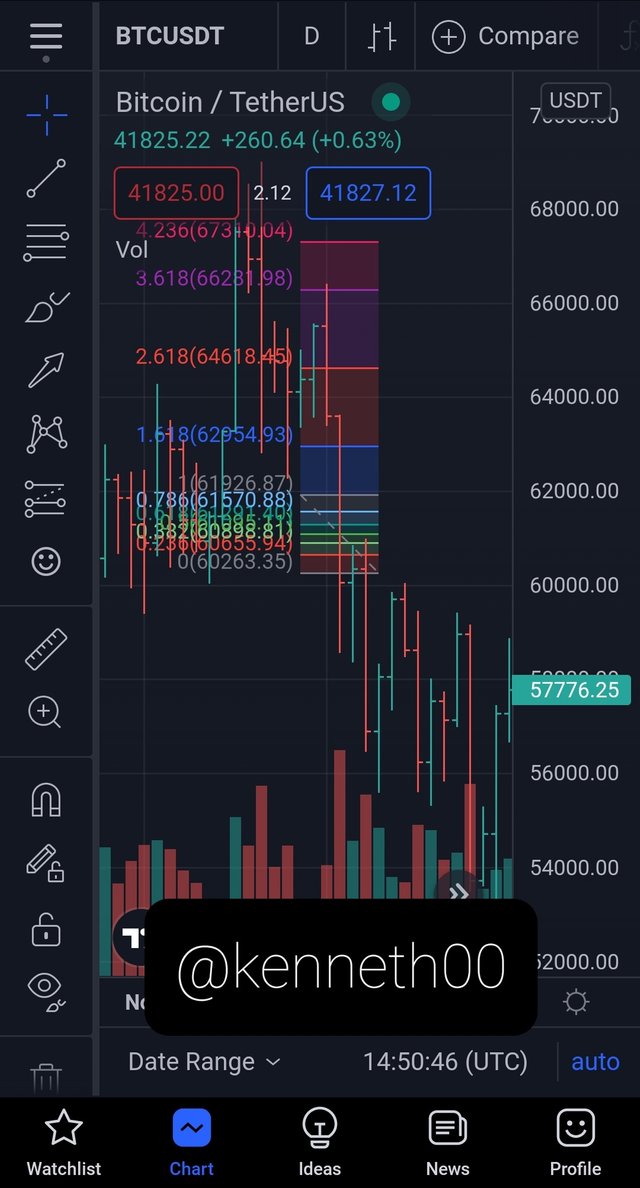
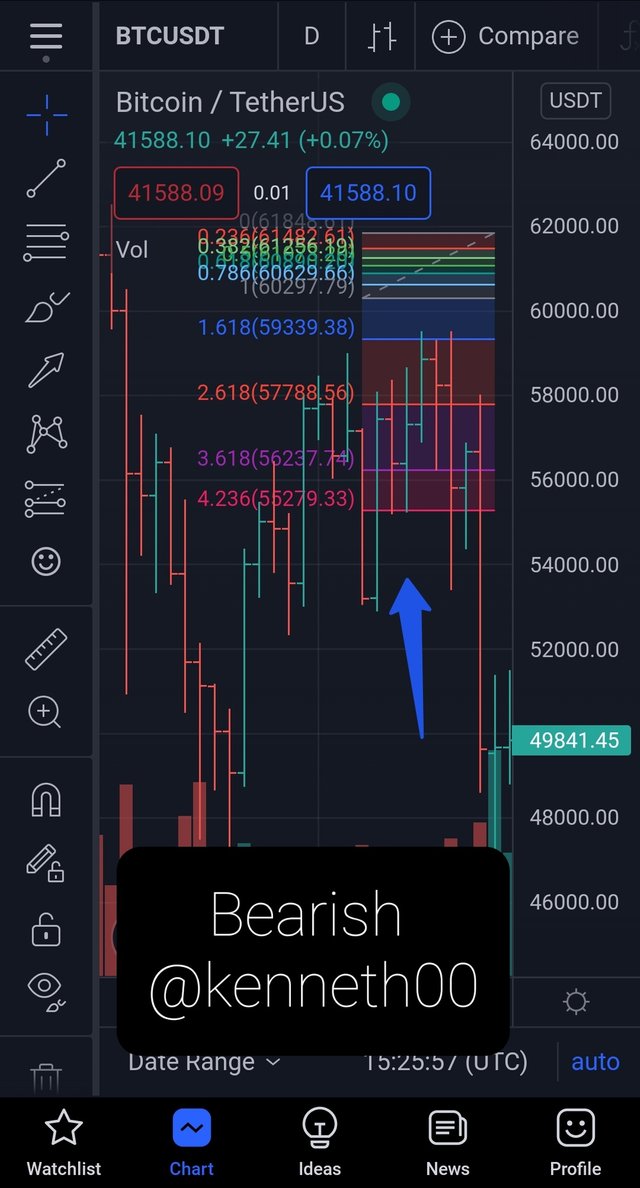
IDENTIFYING AN DOWNTREND IN PRICE WITH PRICE BAR
Firstly a downtrend is always a bearish and this is noticed when you can see a Lower high in the chart and Lower lows because that shows there is supply and selling happening in that asset.
To know if an asset is in an downtrend with price bars then you have to find the price of the asset start from a high point and it closed at a lower point as well as the low of the previous day being higher than the next one(lower low). We can observe this in the picture below
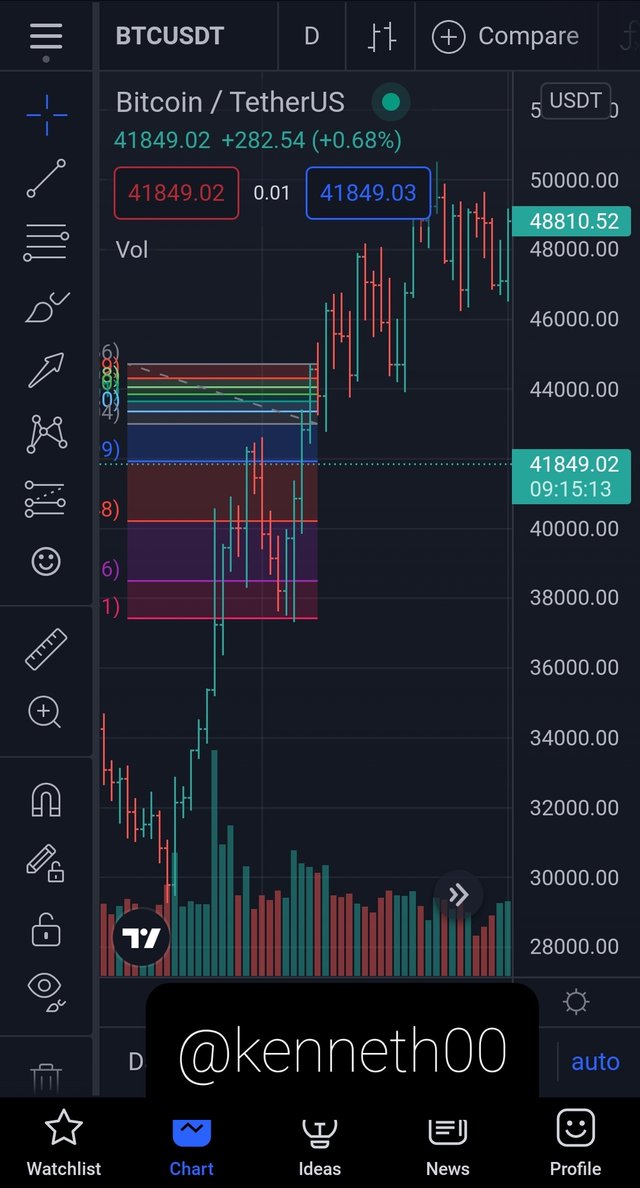
3) EXPLAIN THE BAR COMBINATIONS FOR SPENDING THE DAY INSIDE FOR BOTH CONDITIONS. (Screenshots required)
The Price bar can be used by any one to know the direction of the market, it have patterns in which they use to convey signals to the trader on the price chart.
The meaning SPENDING THE DAY INSIDE simply means uncertainty in the market and you can notice this when the previous day chart is lower than the present day chart. The present day bar is smaller and has been covered by the previous day bar and signals that there is a complete uncertainty in the market which means that people that own that asset don't want to sell or even the buyers doesn't want to buy.
This is not tradable consequence o because it literally shows uncertainty which doesn't forsee a price uptrend or downtrend, And it can also occur either in a bullish or bearish market trend.
For Spending the Day inside to form on a price bar there are conditions and descriptions that must be met.
- you will notice that the previous high is higher than the present day high
- the next thing you will have to notice is that the previous day low was lower than the current day low
I am going to describe the Spending day inside combination using the bullish and bearish market trend with the screenshots.
When traders who analyze charts talks about a bullish day inside they observe that the open and close of the previous bearish price bars are engulfed by a bullish price bar. This combination signals indicates that it is in an uptrend.
When traders who analyze charts talks about a bearish day inside they observe that the open and close of the new bearish price bars engulfed the previous bullish price bar. This combination signals indicates that it is in an downtrend.
4). EXPLAIN THE BAR COMBINATIONS FOR GETTING OUTSIDE FOR THE DAY FOR BOTH CONDITIONS . (Screenshots required)
This is the opposite of getting inside the bar which is getting outside the bar and this signals to the trader to observe and notice that both the highs and lows are formed outside the day of the next candle.
When it comes to the bullish trend, a trader is to observe and notice that the open of the bar is at a lower point than the closing point. Here the previous high price bar is usually Lower than the one after it.
When it comes to the bearish trend, a trader is to observe and notice that the open of the bar is at a higher point than the closing point. Here the previous high price bar is usually higher than the one after it.
5). EXPLAIN THE BAR COMBINATIONS FOR FINDING THE CLOSE AT THE OPEN FOR BOTH CONDITIONS IN EACH TREND . (Screenshots necessary)
Downtrend is said to be a closing of the price is seen at the open of the new price bar and it is near the high point, this famously signals a trend reversal
Whereas in a situation of a uptrend is said to be the opening of the price which is seen at the open of the previous price bar while closing is seen facing the high and the signal is then seen to go on an uptrend.
Conclusion
I am going to conclude this post by saying that i have been educated how important a price bar is when it comes to price chart technical analysis same with the candle stick and other tools, the price bar helps a trader to know if a price willl reverse or continue trending in a particular direction so i can safely say that a trader cannot do without price bar so thank you @sachin08 for a well detailed lecture about price bar and it's combinations.