Steemit Crypto Academy Season 5 Beginner Course - : Trading Strategy with "Price Action and the Engulfing Candle Pattern
.png)
Image created by me @kenneth00 in canva
INTRODUCTION
Greetings to every one in steemit reading this post, I am here to submit this week beginners homework of the steemit crypto academy introductory post given by our creative professor @lenonmc21 and i will be answering the question for the homework on the topic "Trading Strategy with "Price Action and the Engulfing Candle Pattern"
1). Say in your own words that you understand about the Trading Strategy with “Price Action and the Engulfing Candle Pattern, also describe each step to be able to execute it (Place at least 2 examples in clear cryptographic assets and with your own charts mandatory) ?
2). Explain in your own words the interpretation that should be given to a large strong movement in the market. What does the price tell us when it happens?
3). Explain the trading entry and exit criteria for the buy and sell positions of the trading strategy with Price Action and Engulfing Candlestick Pattern in any cryptocurrency of your choice (Share your own screenshots taking into account a good ratio of risk and benefit)?

1). Explain what you understand about the trading strategy “Price Action and the Engulfing Candle Pattern,
The idea of this strategy is the price action, since the idea to carry out this strategy is to look for price movments the very clear ones, this allow investors to make very important investment decisions when a strong price movement is orchestrated by the whales or institution.
This means that in the sence, clean trend is observed and a very good movement is formed in the opposite direction, we can interpret this movement as a sign or warning that the trend is about to go in a different direction and this will be our opportunity to get prepared for a smart market entry. In the new direction of the trend, the next thing is to wait for the price to stop moving for a while, looking for more liquidity to continue its way towards the new trend, this is where the so-called "Engulfing Candle Pattern" comes into play, it will give us a valuable signing, to be able to carry out our operation accordingly.
In the image above it shows the trend changed direction from a downward direction to an upward direction, this happens when the whales of institutions decides to move the market by pumping the price or dumping the price.
Steps to follow for the correct execution of the strategy:
Step 1
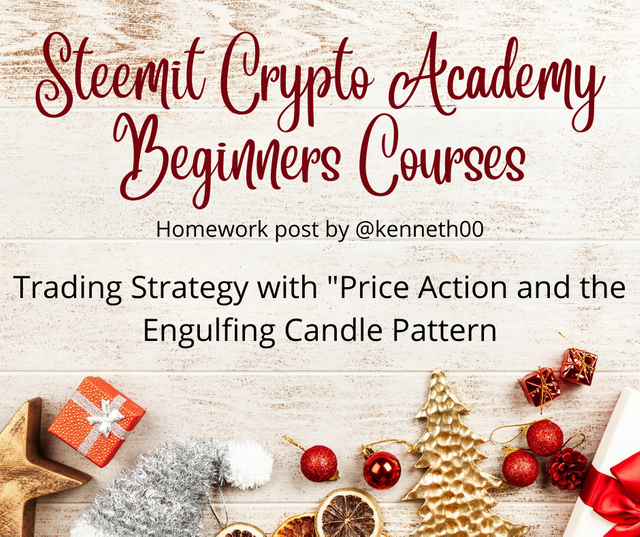
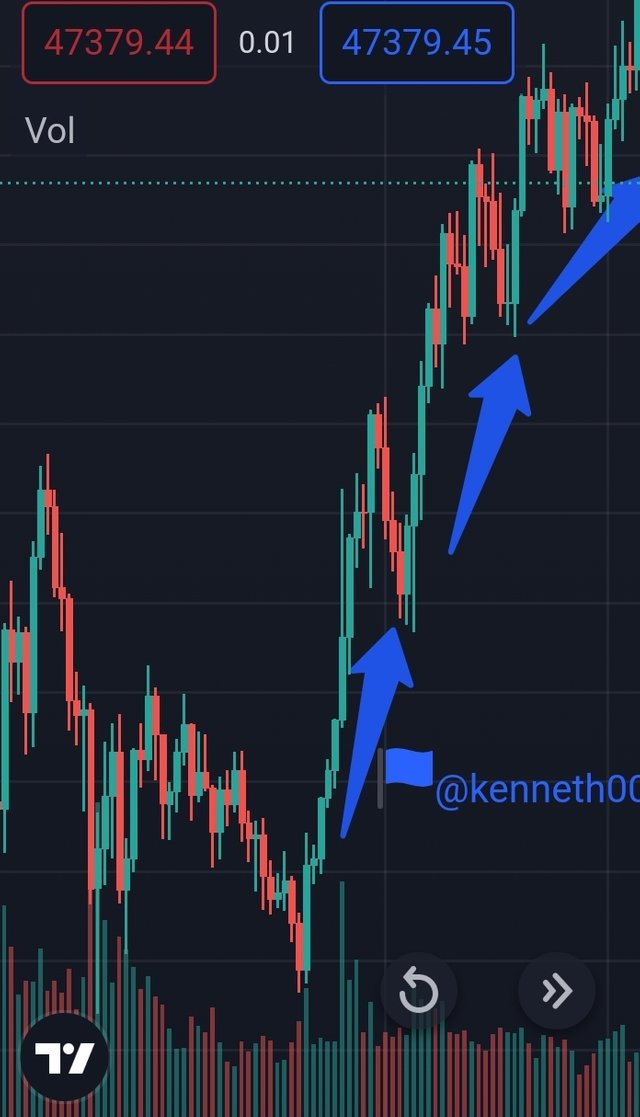
The first look for an asset chart that the movement looks harmonic, meaning you must first identify a graph with clear and visible harmony movements where there is smoothness in both their impulses and their setbacks. The strategy will not work in a chart that does not have a clear trend defined.
Bullish Trend example
Captura de Pantalla de Tradingview
Bearish Trend Example
Step2
The step 2 factor for this strategy to work is to look for a strong movement in the chart that is towards and opposite direction meaning if the price action has been up then a strong longer red candle comes in and change the direction of the direction, this means that investors are putting a large amount of money in this new direction, In step 1, we saw that the trend is “Bullish”, so this strong move formed by whales will be “Bearish”. The idea is that you have candles of great strength and at least we can observe 3 to 4 candles in a row.
Bearish trend example
Following the previous Candle stick the shows the previous this one represents like 3 0r 4 down trend candle stick, this is our move in the opposite direction we have been look for.
Bullish trend example
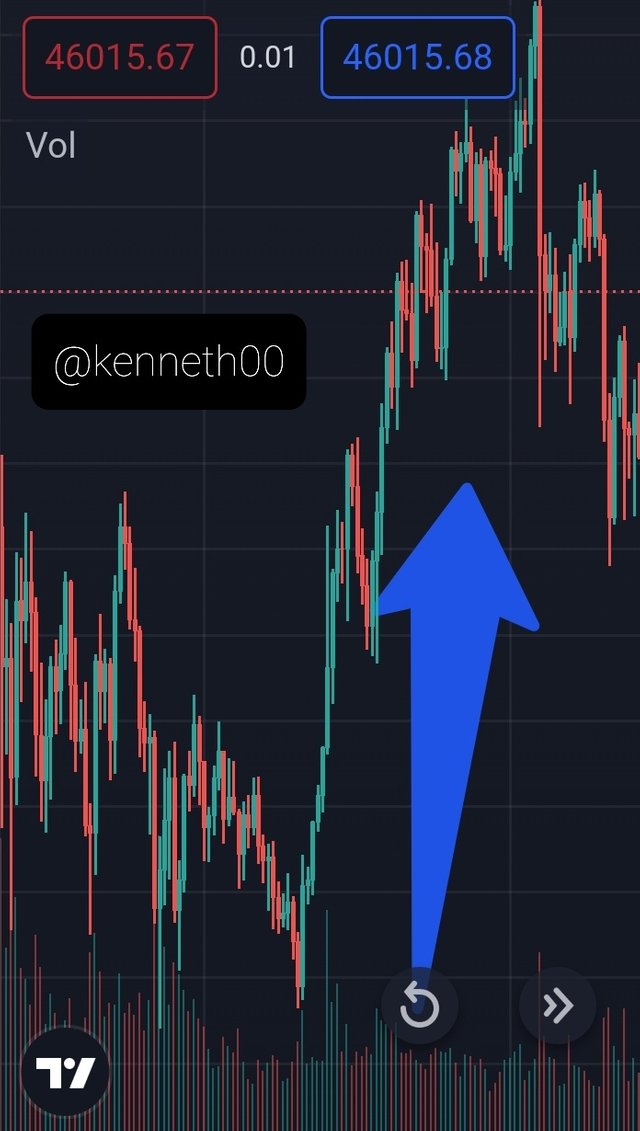
Following the previous Candle stick this shows the previous this one represents like 3 0r 4 upward trend candle stick, this is our move in the opposite direction we have been look for.
Step3
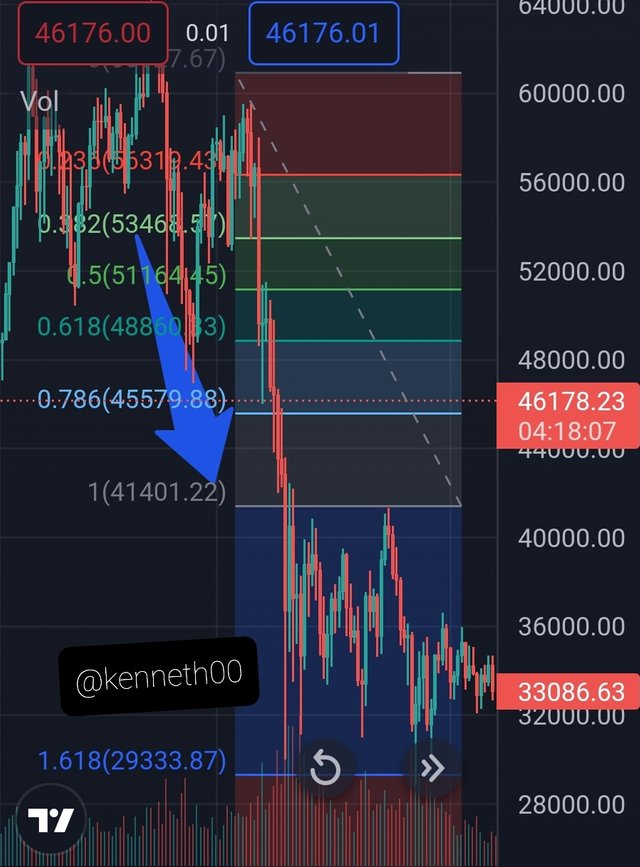
Find a break in the price and the Engulfing Candle Pattern: After identifying our strong movement in the opposite direction to the trend that was dominating in "Step 2", we must wait for the price to take a break, this break is a simple retracement (In this case bullish), where the price after this, will give us a “Bearish engulfing candlestick pattern”, as the candle that came before is bullish and our strong movement is downward, the price reform as i like to call it is to the upside, here we will patiently wait for our aforementioned "Pattern", a bearish candle that surrounds practically 100% of the previous bullish candle, when we identify this, we must mark a "Horizontal Line" at the ends of the "Engulfing Candle", in addition of a "Vertical Line", to identify our candle, this to continue with our next step.
Step4
Once we change the chart to 5 minutes, the next thing is to look for a clear break of the area marked by the engulfing candle on the 15-minute chart. However, something that can happen is that when we change the chart from 15 to 5 minutes, the zone has already been broken, in that case, we must wait for the price to return to the zone and be rejected by it, that is, We wait for the price retracement again and just when a red candle is thrown at us and the price starts to retreat, we enter our entry immediately. Placing a STOP LOSS a bit above that last retracement and our “Take Profit” at the last support we can identify. In this case it is support because the entry is to the downside.
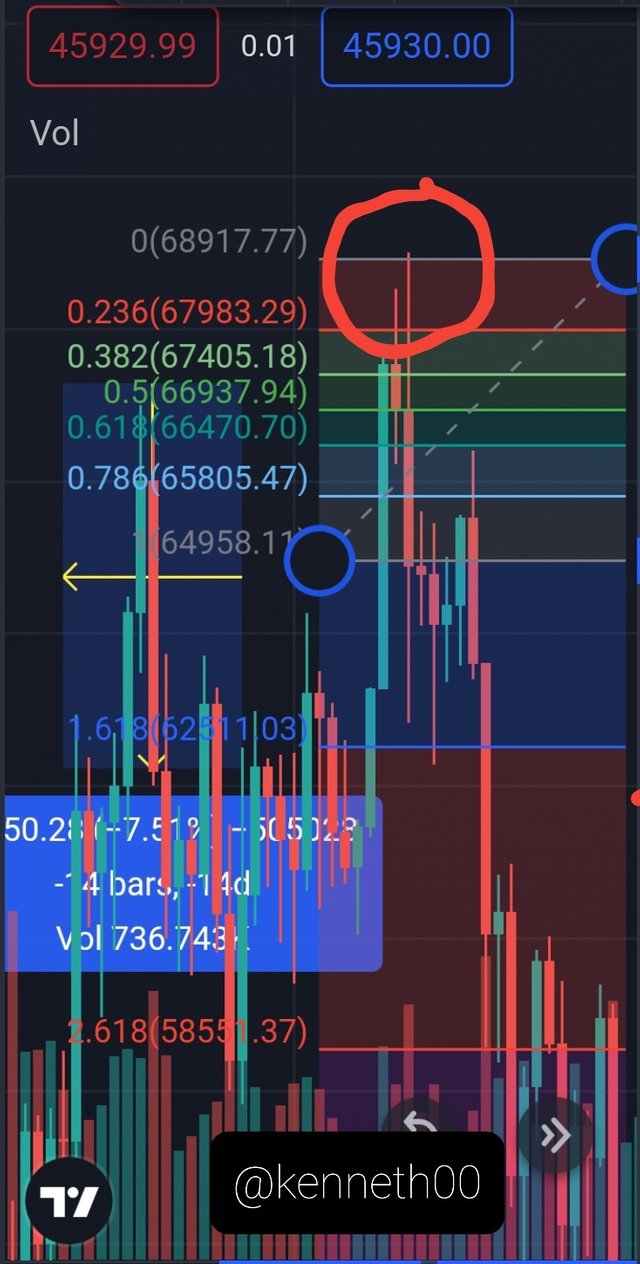
The space which i circle with a red circle is the entry in the trade because after the pullback that we waited for and it happened, we enter the trade and this time to the downside.
- Bullish Engulfing Candles
- Bearish Engulfing Candles
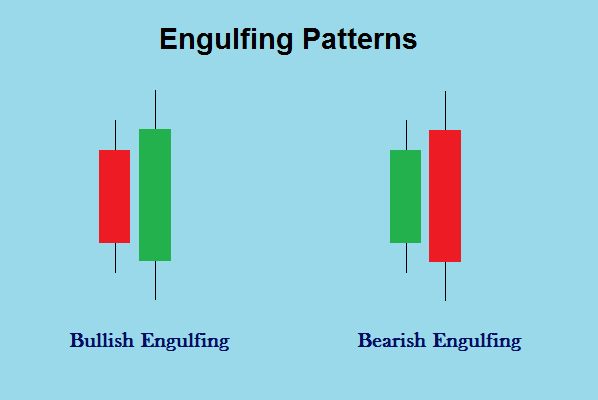
This a price action that initially begins with a bearish candle, then a price reversal will happen to the price to move it an opposite direction giving a bullish candle, therefore we observe at least 4 or 5 candles to count the bullish engulfing candle valid. Here the inital candle which is a bearish is then engulfed by a bullish candle giving a bullish trend. Here the price of the next day must have opened at a price lower than the previous day and closes significantly higher than it opened on the day before.
This a price action which initially begins with a bullish candle, the price reversal then happens and the price changes movement in an opposite direction giving a bearish candle, in other for it to be considered a bearish engulfing candle we observe at least 4 or 5 candles to count the movement as valid. Here the inital bullish candle is then engulfed by bearish candle giving birth to a bearish trend. The sellers are said to be temporary in control thus the larger it is the more important it becomes.
2). Explain in your own words the interpretation that should be given to a large strong movement in the market. What does the price tell us when it happens?
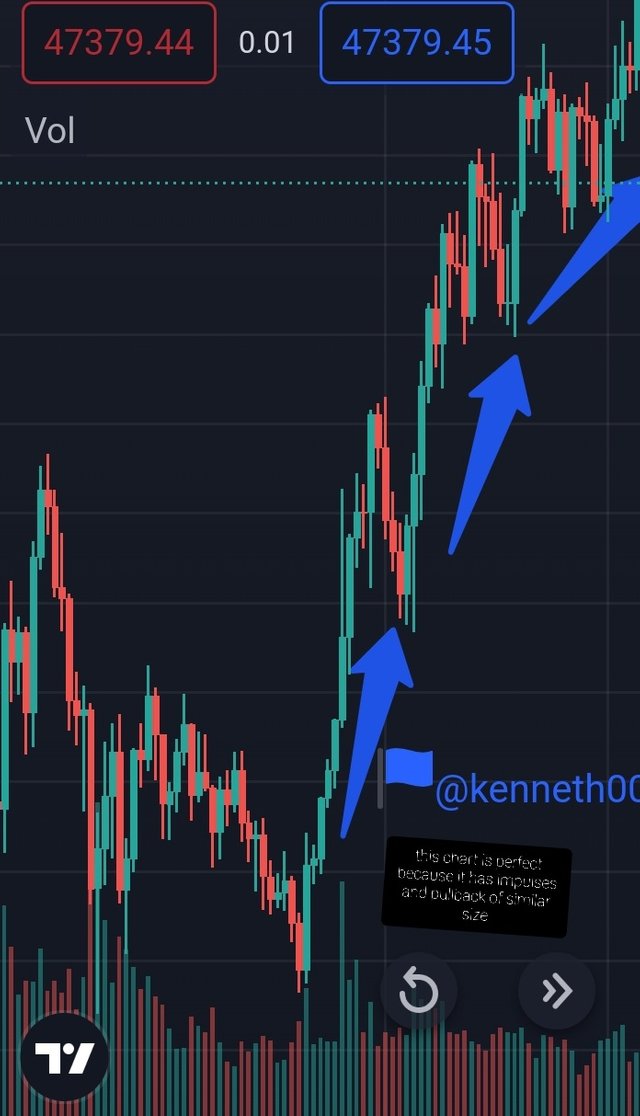
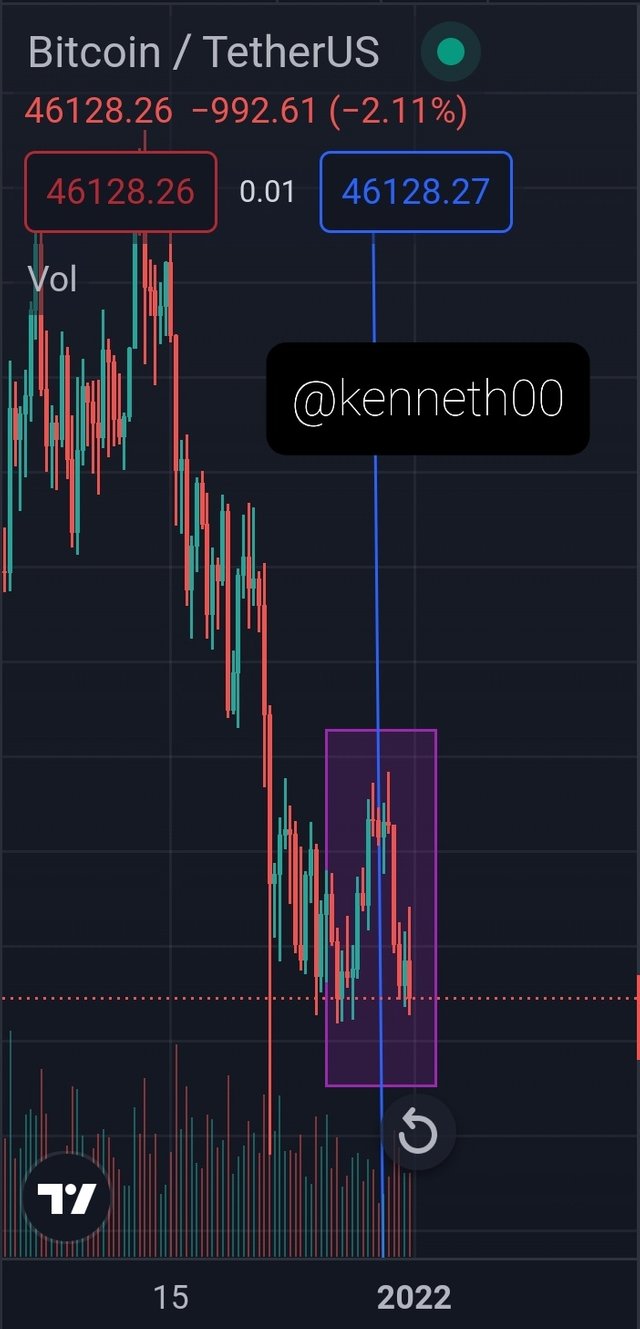
In my own words and with the knowledge i have gained from this lecture i will say the interpretation that should be given to strong movement in price is "price action" meaning the price of that asset has started to take action by having a movement either upward or downward just like in the image below which is a BTC/USDT.
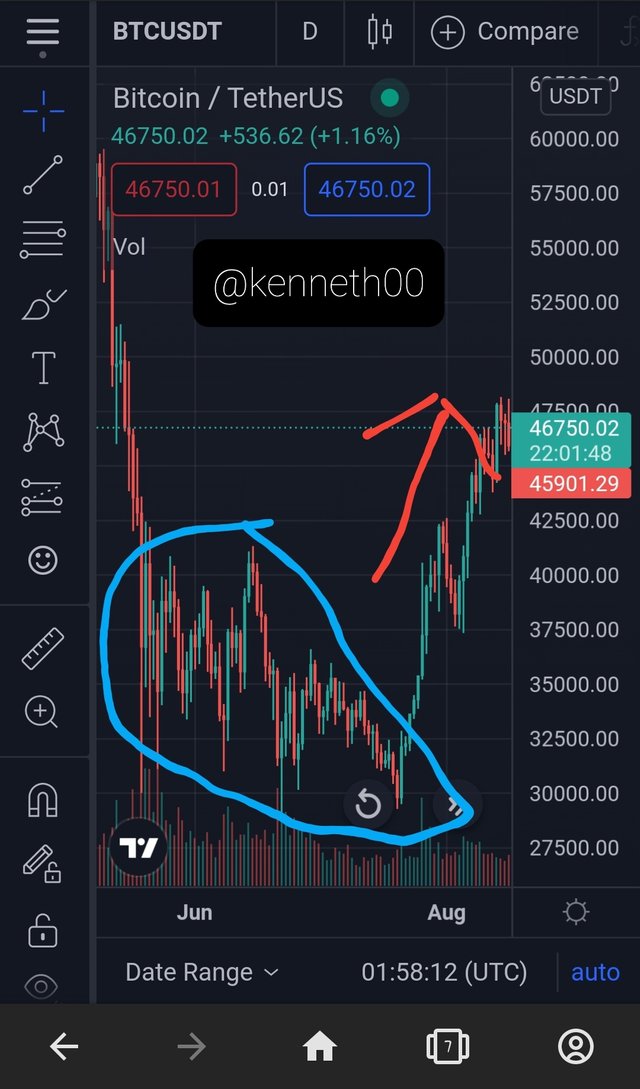
The blue circled area is the area of liquidity for Bitcoin because it was not going below $30,000 or above $42,000, it remained in that areas for like 2 months before finally have a price action that took it all the way to $70,000.
It means the whales stepped in to push the market back up after they must have accumulated a lot of bitcoins from retail investors, some will say it's manipulation but i will say that is how the global market works.
3). Explain the trading entry and exit criteria for the buy and sell positions of the trading strategy with Price Action and Engulfing Candlestick Pattern in any cryptocurrency of your choice (Share your own screenshots taking into account a good ratio of risk and benefit)?
In this question i am going to be using Bitcoin as the crypto of my choice to explain this thank you.
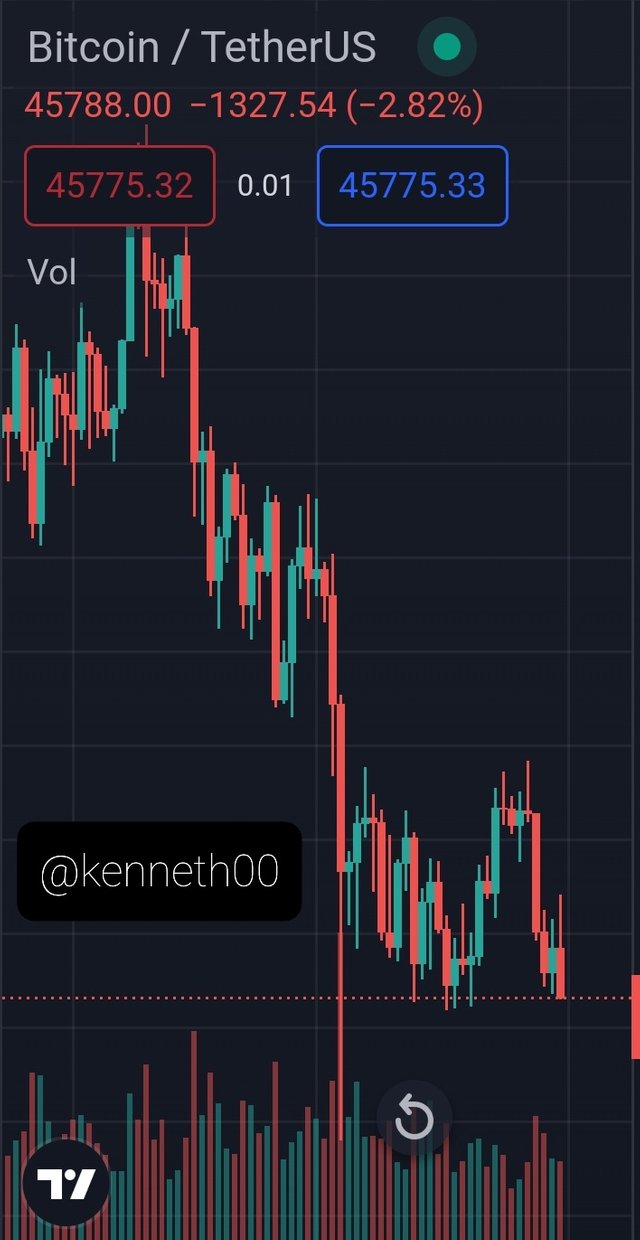
- Bitcoin chart in a harmony upward movement 👇
The first thing that we must bear in mind in before trading, regardless of the direction of the trend, is that the price structure is orderly and harmonious just like the Bitcoin trend above, in short, that the price is in a clear upward or downward trend. If this does not happen and the price is in a range or in extreme volatility, the strategy will not work and it is best that we look for a pair of cryptocurrencies that offer us a stable trend in any direction.
- Engulfing Candlesticks👇
It must established in mind that the strong movement that we are looking for after identifying the trend is very clear, there must be 3 to 4 engulfing candles with a good body, to be able to take the movement as valid and we can look for our engulfing candle pattern in a flashback. If this does not happen, we must look for another opportunity where this criterial is specifically met. Engulfing candles are very important and reflect the action of strong hands (Whales), to change the trend at their preferred time.
- Enveloping Candles 👇
We must be clear about our “Enveloping Candle” pattern to mark the upper and lower zone of it in a 15-minute time frame. When we change to 5 minutes, the zone of not being broken, we will look for a clear break in force to take a trade. If the zone is already broken when changing the time frame, we must wait for the price to develop and give us a new setback, and as soon as the price begins to fall again we enter our trade. When this happens, the whales are constantly tricking us in order to liquidate retail traders, it is for that reason that we must be very concerned to this specific criterial, since it will not always be perfect. The only thing is, if the candle is really not engulfing, we should discard this setup and wait for another opportunity.
- Take Profit or Stop Loss👇
Finally, when our zone is broken (15-minute engulfing candle), our STOP LOSS must be above our bearish candle, which is the one that will mark our entry. Having clear the previous criterial. Our TAKE PROFIT, on the other hand, must be at the last support or resistance as the case may be. If we do not find a clear support or resistance in 5 minutes, we go to greater timeframes and in that way we will obtain our profit-taking zone. The risk-benefit ratio must at least be 1 to 2.
CONCLUSION
I will be concluding this post by saying thank you to our professor @lenonmc21 for taking his time to give us this good lecture, it was more difficult for me because i am not good at speaking Spanish so i had to use translation that messed some of the question up for me so i had to improvise a way to answer the question because i love the challenge and i hope i did well.
This price action and Engulfing Candlestick strategy has the ability to generate a large amount of profits in the market. We also learn that strong movement in market is caused by the whales or institution manipulation in the market they basically affect what goes on in the market of today.