CRYPTO TRADING BY IDENTIFYING SUPPORT AND RESISTANCE/STEEMIT CRYPTO ACADEMY S6W3 HOME-WORK POST FOR @SHEMUL21.

Introduction
I will define trading as the ability to buy and sell with the aim of making Profit, globerly you find more people Trading this motive trigger's the intention at which trading is driving at.
Trading is driven by supply and demands the higher more people enters a position the higher market trends, many thanks to the market makers.
Crypto Trading is very volatile which means one needs to be careful courtesy the way Trades should be placed, you need to consult so many things before placing a trade in order to avoid unnecessary looses in the market.
trading using an Indicator is good but one thing we should realize is that Indicator isn't 100 trusted despite what.
In this facet's everything has to be in place in order to make the best out of the trending market, when market trends there are lots of things going on.
Trust me that is the best time to trade, one major thing to put in place before trading is location strategic entry and exit points which brings us to topic of discussion Identifying Support and resistance.
What is the Support & Resistance zone?.
Just as I said earlier Trading is actually triggered by supply and demand, by this I will say that Support can be defined as a spot in the market where downtrend is expected to observe a pause, the pause occurs as a result of concentration of demands.
Resistance can be defined as a spot in the market where Uptrend will have a pause this pauses are all temporary as there are always break-out's and retracements, remember market moves in Zig-zag form.
A support zone is a spot in the market where a traders places a buy order, after several Analysis hoping that market goes up so he/she can maximize profits, that is practically the essence of trading the financial market. Note at the Support level you only buy.
Resistance is the opposite of Support which means that at the resistance phase you place a sell, at this point I will say resistance level is a spot in the market where your sell order is been executed. Please Note at the resistance phase you only sell no one places a buy at the resistance level.
Explain different types of Support & resistance with proper demonstration.
We have three various types of support and resistance and I will be exploiting then one after the other, I have previously highlighted what Support and resistance levels entails moving on we have.
Horizontal Support and resistance.
Dynamic Support and resistance and
Slopping levels Support and resistance.
Horizontal Support and Resistance.
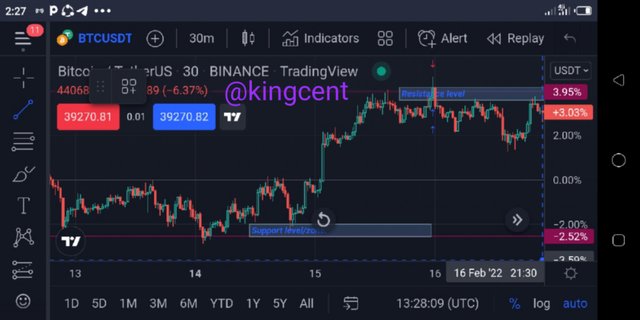
Horizontal Support levels are Levels that connects various price bars, be it at a high or lows at this point Levels of horizontal Support levels are formed courtesy price charts take a look at this chart below.
When we observe Support and resistance in the market we usually notice various swing point's as trends continues, as market keeps trending so as there various swings in the trending market.
When market moves in Zig-zag form there are always break-out's in the end and this break-outs at some point you see Support turning into resistance vice versa.
As a trader or a new trader for you to be able to determine horizontal Support and resistance Levels very well you must know your structures and price actions very well.
While executing your trades you don't just depends on the signals provided by the Indicator in use alone, you combine Indicators and also look out for the occuring and previous formations and market structures.
higher-highs, and higher-lows formations all round, courtesy this let's talk more about Uptrend and downtrend for effective understanding.
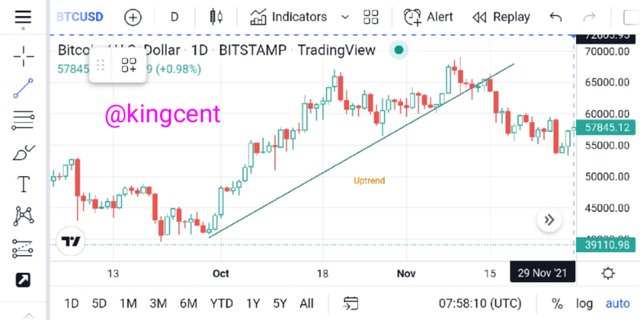
Uptrend.
You must know your uptrend and downtrend very well so you can easily know when to place your buy or sell other without making unnecessary mistakes, you need to be very careful remember crypto Trading is very volatile.
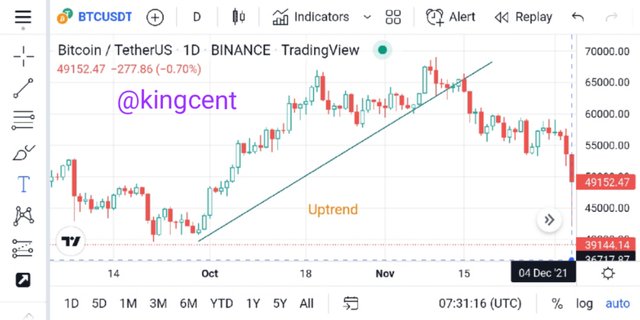
Looking at the chart uploaded you will see that from the point where the trend-line started that region was the Support level, so you can easily place your buy order there and price goes bullish.
The point where the trend-line was broken was the resistance level, at that point you start looking for a sell opportunities because market might go bearish but not 100% certain.
There can be a breakout and that resistance level will thus turn to support, that is practically how trading works sometimes it looks pretty much difficult to spot out resistance turning to support, vice versa.
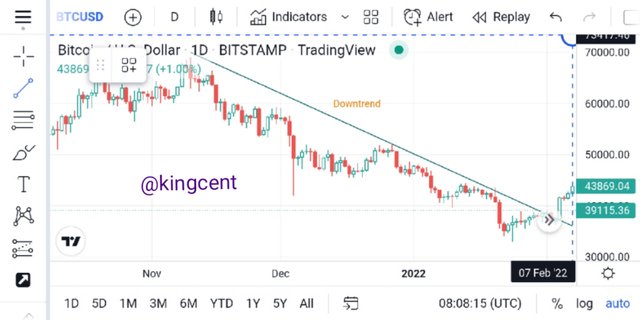
Downtrend.
Downtrend is a point in the market where price tends to go bearish (Downtrend), this basically occurs from the resistance level Down to Support. When market is going down you can pass a trend-line to monitor the move take a look at this chart below.
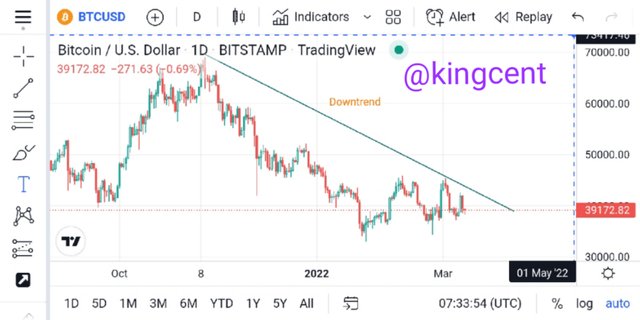
When your trendline is broken that means market is planning to change phase, from downtrend to Uptrend formation at that point you look out for possible new entries.
One can consider the signals been issued by the Indicator been used also very important consider the market structures and price actions before executing your orders.
Dynamic Support and Resistance.
Dynamic Support and resistance are strategic levels where one can expect a pull back courtesy price actions when dynamic Support and resistance happens then we understand that market is really evolving.
Identifying Dynamic Support and resistance levels for me I think 20 EMA is pretty much my best choice, when 20 EMA is used trust me you see a a clear structure of the closing price for a long period of time basically 20days.
One of the most reason why I love the EMA is that it gives a clear indication as a result of the most recent momentum by so doing you see a clear indication of price actions, I will say EMA is very balanced.
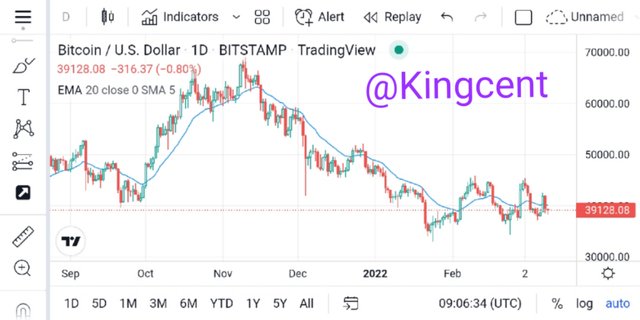
Here I applied 20 EMA to the chart you can see vividly how price acted and reacted each time it gets to either the Support or resistance zones, this clearly signifies entry and exit points.
Looking at the chart you will understand how price touch the 20 EMA on several occasions this will amount to intense lookout for dynamic Support and resistance zones.
Slopping levels of support and Resistance.
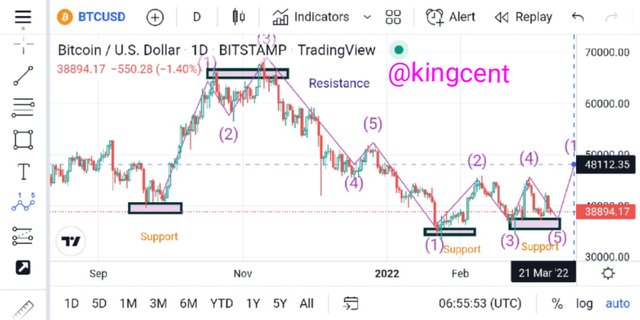
Only the name defined it all slopping levels of support and resistance this can be defined as the level at which trend occurs and ends before there is a breakout, we have two various levels which are uptrend and downtrend levels.
As for the Uptrend it starts from the Support level to the resistance level forming series of higher-highs, and higher-lows formations all round when this occurs we call it slipping levels from Support level resistance, let's take a look at the Uptrend first.
In this level Support is slopped to resistance, looking at the point where the slope started down to the resistance level there has always been a break and retest without the Support level officially been broken.
You can place your buy order when price touches the Support and a sell order otherwise, vice versa, the ability to detect your support and resistance zones are key as it gives you an insight on what happens next in the market.
Now let's talk about the downtrend levels at this point there is a formation of lower-highs, and lower-lows formations all round, downtrend are seen from the resistance level down to the support phase when this is observed we can say this is a slopping level of resistance.
At the resistance level you only place your sell order and hopefully market comes down all the way to the Support phase, when price gets to the Support phase then you starts looking for buying opportunities.
Identify The False & Successful Breakouts. (demonstrate with screenshots).
False break-out can be defined as a time in the market where level of support and resistance failed to maintain it's momentum at this point trend has failed totally to maintain it's Level above.
This break-out pattern is very important in price actions strategy, so many trader's trade false break-out as a trading strategy, in the market it will look like there will be a breakout to the Support or resistance zones before you know price will reverse.
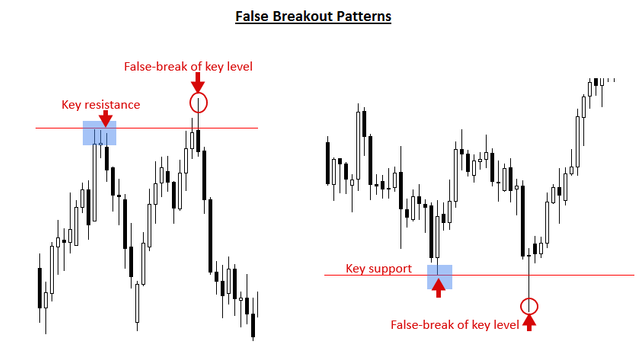
Looking at the chart there are false break-outs from the Support level to the resistance level all clearly showing false break-outs, looking at the chart price trying breaking above the two levels but failed wofly.
Trading Breakout entail alot one you need consider your structures and price actions in-conjunction with your candle-stick patterns all should be put in a clear recognition.
Let's say there was a series of higher-highs and higher-lows formations, from the Support to resistance level you will agree with me that at some point trend will change which is break-out.
Let's say all of a sudden break-out occured from resistance phase down to support then we saw only two lower-highs and lower-lows formations only then Uptrend continued at this point big false break-out has occurred.
At this point we shall talk about successful Breakout, just as our people usually say anything that has Advantage also has disadvantages too.
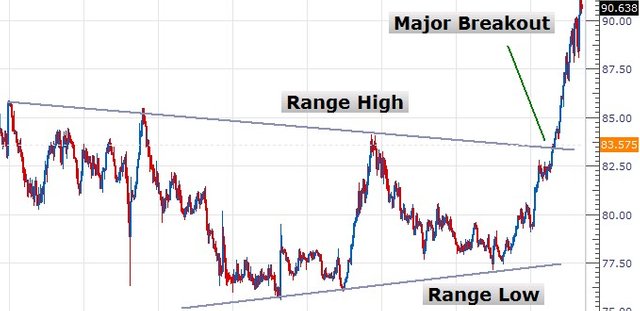
A successful break-out is valid when price breaks the high and low range and continues in the direction at which it is based in, looking at the chart above there was a breakout price didn't return to the previous level instead it surged up.
Identifying valid Breakout can be done in various ways not just drawing series of lines from Support to resistance, one can look at price actions and market formations patterns and structures.
You can find a buy or sell entry when you see a candle-stick closing outside a defined area be it support zone or resistance phase, trading break-out you should be very careful about false signals because they will surely come as time goes on.
Use Volume and RSI Indicator Combined with Breakouts & Identify the Entry Point. (demonstrate with screenshots)
The use of volumes and RSI to confirm market trends are very good in a trending market, just as we may know RSI simply means Relative strength index which measures the phase of the market by this I means talking about Overbought and oversold region in the market.
Volume itself is an indicator that measures the total assets been traded in a given time interval let's take the stock volume as an example with this you will find out that volume measures the total traded pairs.
Concluding this I will say volume measures the total number of shares that are traded in a stock overtime, using volume you can easily know market activities at a defined time interval. Let's look at some screenshots below.
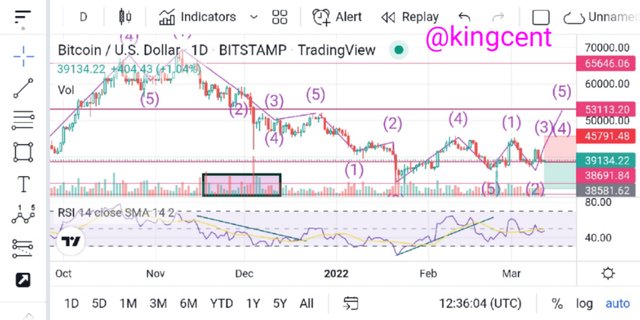
Combining this two Indicators are very important remember when RSI is 70 and above we consider it overbought, and when it ranges within 30 below it's seen as Oversold, at this two points one can easily create buy or sell orders along the long run.
Talking about volume from the screenshot uploaded you will see that each time price falls Volume usually increases, when this happens it signifies that trend is been gaining lots of momentum and strength towards the down phase.
From the screenshot uploaded you will see each time price climaxes to new high volume makes a decrease when this happens they Market is bond to thus reverse. All this are all showned on the screenshot provided.
Take a Real Trade(crypto pair) on Your Account After a Successful Breakout. (transaction screenshot required)
When break-out occurs signal to buy or sell comes to fruition, break-out from the Support zone to the resistance level is called Support break-out, while break-out from the resistance zone to Support us called resistance break-outs.
Just as the question demands Making a real buy in order for you to maximize profit thereby been on a safe side one needs do proper analysis to execute that fact.
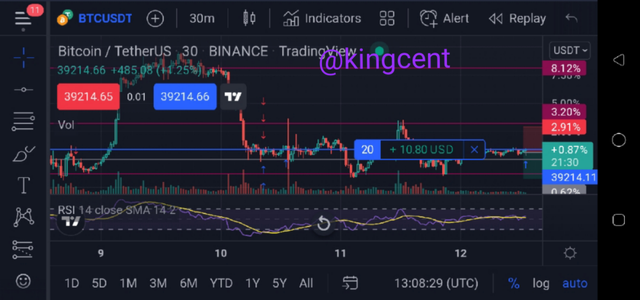
Looking at the chart above I discovered successful break-out and quickly I placed a buy order since the break-out is a Support break-out in less than no time I was running Profit's.
Before a breakout is dimed a successful one so many things has to be put in place, not just the breaking of the trend-lines, one has to consider the Market structure and price formations all round.
Another bond factor is the Support and resistance Levels in conjunction with the Indicator in use very important, for Mei prefer the use of multiple Indicators to confirm price movements in the market (confluence Trading).

Explain the Limitations of Support & Resistance (false breakout).
When we talk about limitations we are talking about the ability for something to be made impossible as a result of it's actions, limitations of RSI is the question here they will all be listed.
RSI can move in a particular direction without showcasing a clear trend for a specific long period of time.
Signals provided by RSI most-time's are pretty much misleading as it gives divergence signals often.
RSI can stay for a long time in either Overbought or oversold region for a longer time period
When there is a strong Trend in the market you see RSI misbehaving it's usefulness is totally unacceptable in that regard.
When there is a breakout where Support can thus turn to resistance RSI Indicator usually lags behind providing false signals.
Conclusion.
Support levels are always seen at the downside, this point market moving from uptrend is obledge to officially have a pause, while resistance level are spot in the market where market gets to before retracing back, always seen at the upside.
I discussed about different types of support and resistance where highlighted the three various ones we have, Support and resistance are categoricalised to having various forms of slope's from the Uptrend to downtrend.
- Thank you very much for this wonderful home-work professor @shemul21 I really appreciate, all images that isn't mine was properly referenced thank you very much for your understanding.