CRYPTO TRADING STRATEGY WITH MEDIAN INDICATOR/ HOME-WORK POST FOR @ABDU.NAVI03.
Introduction.

The most volatile trading among all remains Crypto trading, so before you think of engaging in it then you need to consult various professionals in the field to get the best out of it, forex, and volatility aren't anywhere close to how volatile crypto Trading is.
Before you execute your buy or sell orders there are so many parameters one needs consider since technical Analysis deal's naturally with the overall study of Chart patterns.
Technical analyst believe that trends repeats so in general they look out for patterns and formations in conjunction with Support and resistance, when all this are gotten then when to execute orders will come to fruition.
We measure the phase of the market overall thereby knowing what the market is up to in due time, this can be done with the help of an indicator at this point we discussing the topic for today Median Indicator.
Explain your understanding with the median indicator.
Median Indicator can be defined as a tool used to measure the direction and volatility of the market over a given period of time, it's channel are based on the behavior of the ATR basically from the middle down to the range.
Median Indicator helps in identifying the Median value as a result of the average that exists between various high's and lows as a result of the actual length.
The median has a company of (EMA) Exponential moving average using the same length, let's show the chart for clear understanding.
Looking at the chart you will understand that the median coupled with it's EMA has a cloud colour which signifies that the value of pretty on a high side, looking at the green cloud this shows when median is on a high side thereby making a formation of uptrend.
The violent colour from the chart clearly shows downtrend, in general I will say that Median Indicator is basically developed courtesy band based average ATR, they True range multiplies the ATR multiplier then it can thus be added or subtracted from the median itself.
The Median length tells us how many data points are basically in used at a time when the Median itself is officially Calculated.
ATR length is the duration that will be used courtesy Calculating the ATR in respect to the median.
ATR multiplier is simply the values at which the ATR itself is multiplied, after that then the bands can be formulated.
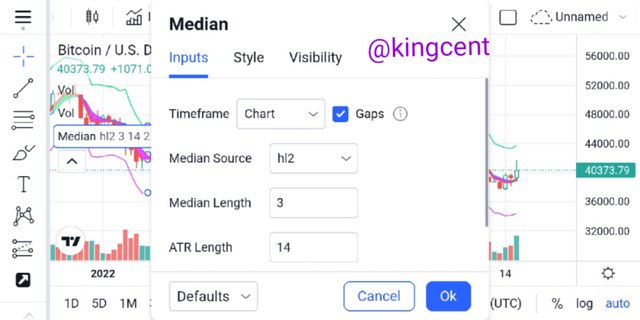
Parameters and Calculations of Median indicator. (Screenshot required)
Calculating Median Indicator is pretty simple all you need do is to add the high and low price and divide it by 2. Putting this into simple perspective I will say median Indicator focuses on first.
Calculations of average prices of each candle-stick by so doing all the period averages will be added and division will then take center stage courtesy the period number.
Let's talk about paremeter's of the median Indicator settings, first the period for the period the default settings is actually 14, which are standards for most Indicators when it's been set it means 14 average price will officially be showned looking at the Indicator line.
For you to get the formular first you need Calculate the basics period of a particular candle-stick average prices after that add up the candle-stick average prices and divide it by two. Or the specific periods.
Formular includes
Candle-stick averages= [(high price +low price)]/2
14 candle-stick average=you divide it by 14 period average.
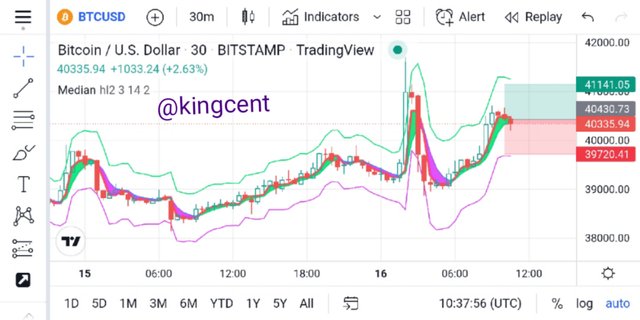
From the screenshot provided I entered a trade and my stop loss and take profit joint where officially seen and shown clearly, here I will add the high and low price and divide it by 2.
Let's see how it goes from the chart the high price is seen converging to been
40430+40335=80.765
80.765÷2=40.38....
Looking at the Indicator you will notice the fact that when share price climaxes above the median price then we should be talking about a buying opportunities strong trend is coming to fruition.
If the occuring price actions is see lying below the Median price line then we are observing weakness that means seller's will take total control of the market at that particular time.
In general terms median Indicator is basically used to showcase average price courtesy a specific period, so that one can easily know when share price climaxes the Indicator line then we know what to do a buy order will be placed vice versa.
Uptrend from Median indicator (screenshot required)
Aside looking at the median Indicator Uptrend can be defined as a state in a chart where price is making a formation of higher-highs and higher-lows formations all round for a specific period of time.
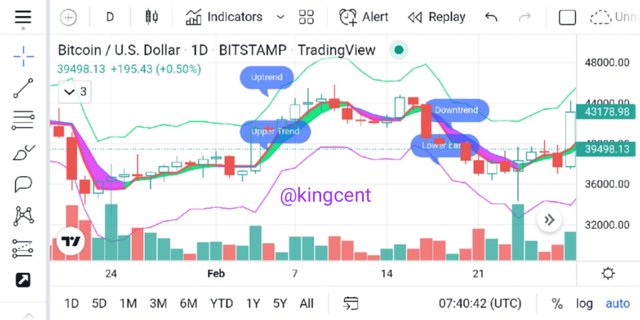
With Median Indicator it's very easy to identify bullish and bearish market all you need do is to follow the various Indicators lines looking at the below chat you will see vividly
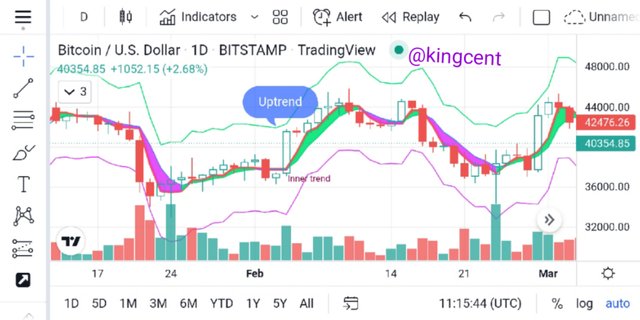
The green line shows Uptrend while the green line inside indicate the upper Trend so the upper trend and the green trend outside must correspond if not then it will be deemed as divergence.
Looking at the chart whenever you see the green line it indicates Uptrend and the other purple line indicates downtrend, so at the bigining of the green line is our buy option which means market will thus climax bullish.
Downtrend from Median Indicator (screenshot required)
When we talk about downtrend this is a region or time in the market when we begin to see series of lower-highs, and lower-lows formations all round in the market, when this occurs then seller's are taking advantage in the market.
Since median Indicator measures the direction of volatility in the market, if one detects the phases of the market you can then determine when market is ranging in overbought or oversold region, let's look at the chart below.
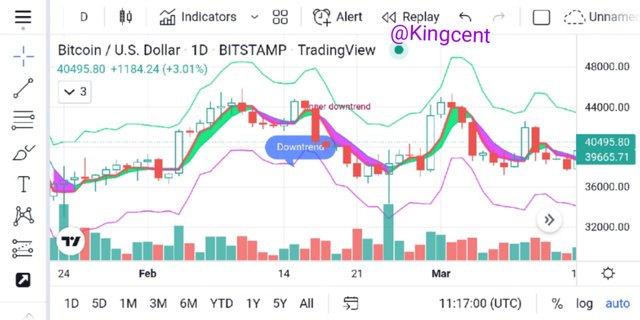
Looking at the Indicator and it's line you will understand the fact they the violent cloud signifies and shows that market will go Bearish (downtrend).
For me in identifying entry and exit points in the market I don't just depends on Indicators alone, reason been then when there are more volatility in the market Indicators lags behind.
Indicator can't be trusted 100%, now let's look at a point in the market where price is seems consolidating you find out that at that moment Indicator doesn't always work effectively until there is break-out either to the Uptrend or downtrend region.
Identifying fake Signals with Median indicator(screenshot required)
With an indicator in used doesn't mean that false signals are totally eradicated in here that isn't the case and can't be the case.
false signals itself can be defined as a situation in the market when price fails to continue a situated trend thereby providing inaccurate trends in the market.
Please Note that false signal is quite different to divergence they both are two various things, divergence is when an Indicator been used are performing different thing, not corresponding with the reality of market trend.
Now let's use a chart to identify false signals courtesy Median Indicator just as the question demands.
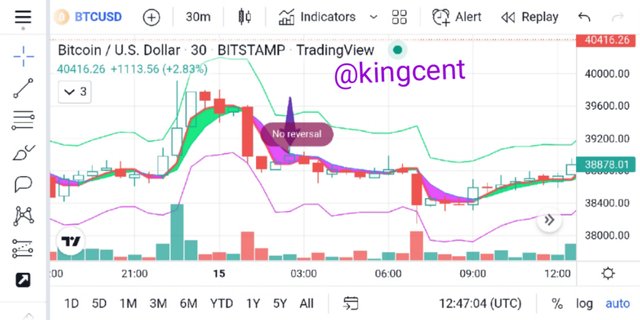
We all know that when price goes down volume increases vice versa, looking at the chart there was a two candle-stick trying to form series of high's but the high's just went in two directions only.
This was confirmed by the volume Indicator been used, since the both high's didn't close above the previous high's to continue in Uptrend phase I will tag this false signals.
Looking at the chart you can see vividly that price continued in downtrend phase, so the previous signal provided are all false, I will advise for a trader before you open a position make sure there are multiple formations before you enter a trade.
One major parameters you need consider to safeguard your position is trend-line this will assist you know when there will be break-out from the Support zone or the resistance zones, when this happens then your trading point will thus be identified.
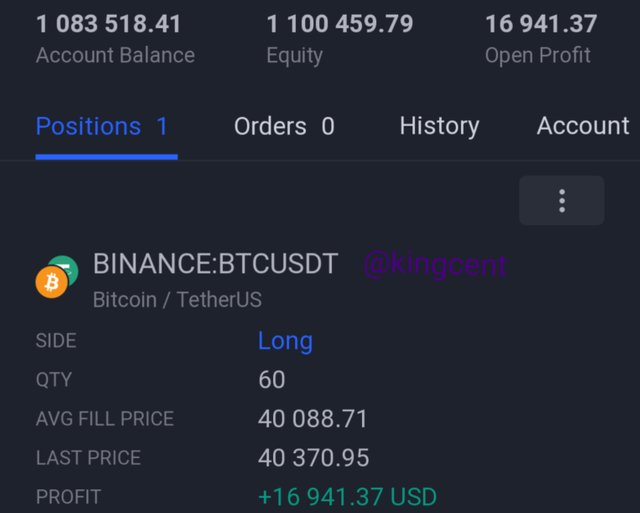
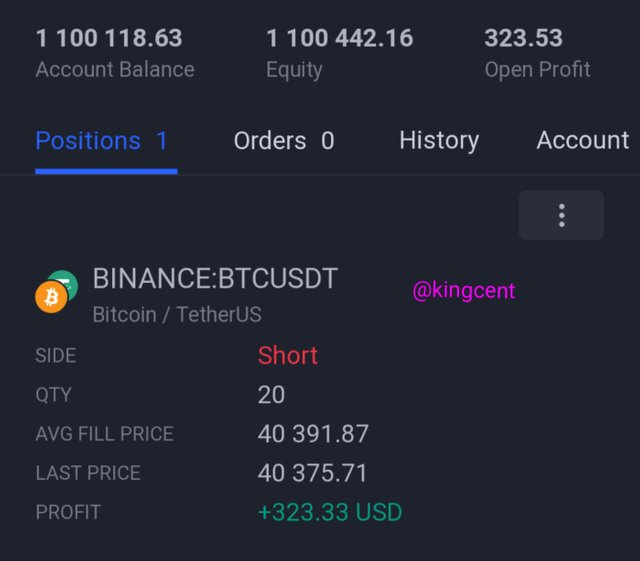
Open two demo trades, long and short, with the help of a median indicator or combination that includes a median indicator (screenshot required)
Opening a demo trade either long or short capitally means buy or sell, since this Indicator is very good at measuring the direction of volatility in the market then we can thus use it also to generate buy or sell signals.
Despite the Indicator been used in conjunction with RSI which means Relative strength index, which measures Overbought and oversold region in the market I also considered price actions and market structures before opening my trades.
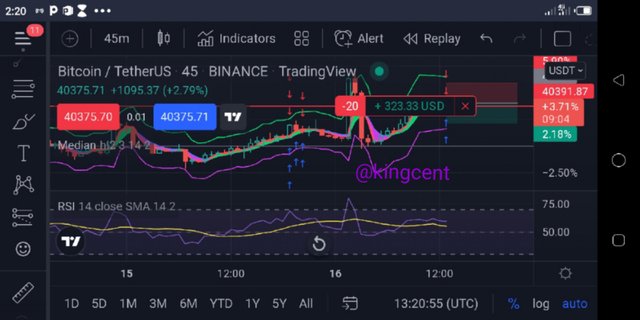
screenshot taken from https://www.tradingview.com/
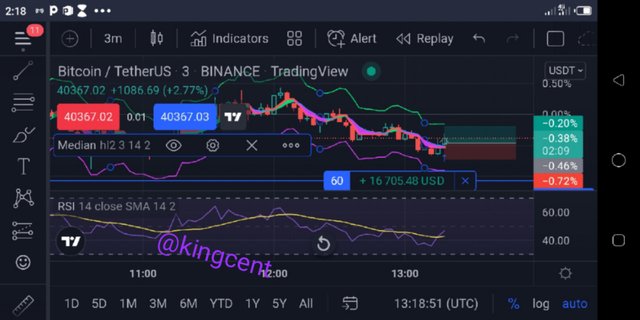
Looking at the both orders they where placed according with the both yielding out results, I used the RSI Indicator to measuring the phase of the market before executing the action in conjunction with the Median Indicator.
For me Indicator doesn't work 100%, I won't lie, that is why from the onset I usually advocate for conflien trading, when multiple Indicators are been use it gives group to trend comfirmation that is what just happened here.
Now let's look at the overall profits maximized from the buy and sell demo trade just as the question demands.
Conclusion.
One of the basics of this Indicator is measuring of market directions, there is no way to you can trade without knowing strategic market directions over a specified period of time, in the lecture I combined this Indicator with other Indicator's and the result provided was very much valid.
I discussed about the Indicator parameters, I also talked about Uptrend and downtrend where it was stated that uptrend is a phase in the market where price creates series of higher-highs and higher-lows formations all round.
Same is applicable when it comes to downtrending market, it's not proper to leverage on Indicator's alone as most times they lag behind, identifying the phase of the market is key.
Thank you very much professor @abdu.navi03 for this wonderful lecture presented by you trust me I really learnt something new today.