CRYPTO TRADING WITH RATE OF CHANGE INDICATOR (ROC)/CRYPTO ACADEMY S4W8, HOME-WORK POST FOR @KOUBA01
Introduction
Trading in general has to do with buying and selling in order to make profit, but the most important thing is knowing when to buy and sell in a long run. In the crypto Market the synerio is quiet different because we make use of various Indicators to confirm various trends in the market.
The volatile Market most-times is unpredictable, but with the help of very strong Indicators like the RSI, MACD, BOLLINGER BANDS we are able to predict the phase prices is going to clamax to thereby forming various types of high's and lows, at this point I will be talking more about another powerful Indicator which is the ROC Indicator. Meaning Rate of change Indicator.
In your own words, give an explanation of the ROC indicator
ROC simply means Rate of Change, this is a technical Indicator used to measure the percentage, whenever there is a change in price, we know that the market moves in a zig-zag form by so doing there are always changes in price movements, trends moves as price moves in a zig-zag form.
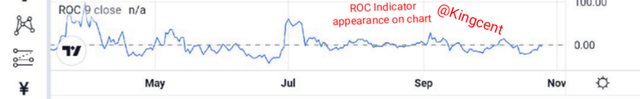
since the ROC measures the percentage change in price it is thus plotted against the zero line, by so doing the Indicator usually surges up toward the positive phase, if there is a change in price in the opposite direction then it moves in that direction where the price is facing, that is practically how this Indicator works.
On like other powerful Indicator's around this ROC Indicator can be used to detect whether price is Overbought or oversold, within a specified period of time, it can also be used to spot divergence.
ROC oscillator is a speedy Indicator that Technical analyst makes use of detect trends in the market thereby setting it against a zero level Mid-point.
When the Indicator makes a surge up above the zero level that means an Uptrend confirmation, vice versa.
Whenever price is compacting with each other, the ROC line will be closer to Zero, as an experience trader I usually watch the trend, because this Indicator works best when Market is trending.
with an example show how to calculate ROC value?And comment on the result obtained
Here I will show how to calculate the ROC, and it's value associated to it, but first I will highlight the formular, keep reading and get the fun.
ROC=[(Closing price-Closing price of N previous period/Closing price N previous period)]x100.
Closing price of the previous day that is closing price.
N value represents the total number of values and previous periods backwards, it can be Compared to the current price though.
Calculating the ROC Indicator
Knowing your n value is important although it depends on the efficacy of the trader shall, a short term trader will mostly choose a little n value, and a long term trader will mostly a higher n value, the n simply shows you the totality of periods that price has been consolidating.
When there are minimal values, you will see that ROC react fast as a result of change in price movement, vice versa when higher value are selected. although break and retest are bound to take place thought, and false signals will be generated.
It like when there are little value ROC will change and react faster, along the process generating lots of breakout's and false signals.
But when there are larger values ROC, will reaction will slowgish but the signal will be more compatible and meaningful, thereby no fake-out's will be produced.
Here what I will do is to select various values which can be 7, 47, 200, remember long term and Short term traders makes use of various numbers, short term traders are bound to selecting smaller numbers which long term traders goes with higher values.
knowing the periods are very important, opening and closing price of assets.
Knowing the period closing price, from the previous periods all this must be identified before you proceed to making an entry.
Whenever each period comes to climax, you need calculate the ROC value.
Calculating price Rate of change with fugures
This Indicator is very speedy that's Why it measures the strength courtesy price momentum, let me give for instance a stock closes with $20, and the closing price in the previous 4 days stood at $12, the with massive Calculations the four days ROC will stand at 66.7%.
(20-12)÷12)x100=66.% approximately 66.7%
The ROC shows up in a chart at the down side very separate from the price axis, plotting the ROC is always in the zero line, by this you can easily determine the +and- values.
Remember the position value shows that price is in Bullish phase (Uptrend) while the negetive shows that price is in Bearish phase (downtrend). When values increase be it in the positive or negetive values it signifies that there are lots of momentum.
Demonstrate how to add the indicator to the chart on a platform other than the tradingview, highlighting how to modify the settings of the period(best setting).(screenshot required)
For an Indicator to fully function very well it must be added to chart and the settings modified like the periods and all the rest, just as the question demands trading View is an exception, here I will be using the coinigy.
First I logged into the website at the landing hom-page and I filled in my details, it was further confirmed through my E-mail address and the Exchange opened and I accessed it. I choosed a chart pairs involving AXS/USDT.
Step1
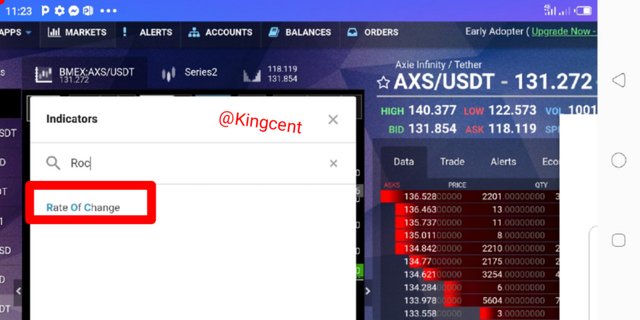
snap-shot collected from coinigy official home-page
- Here at the middle I clicked on the three dots there it took me to the spot where I searched for the ROC Indicator, it showed up and I clicked on the Indicator hopefully it was added to chart.
Step2
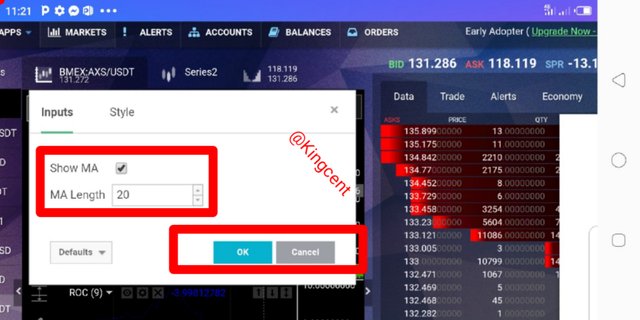
snap-shot collected from coinigy official website
At this stage I will be imputing the MA length which I choosed 20 MA, for me this is the best settings and I clicked on the ok botton.
Note for the MA, it's practically optional you can decide to choose any value provided it's the best for you. the next phase I will move on to modify the style.
Step3
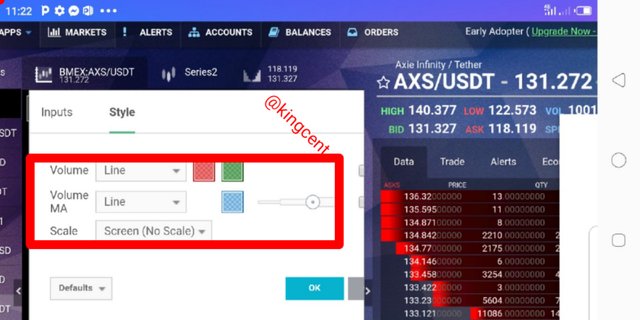
snap-shot collected from coinigy official website
At this phase you will choose the pattern you want the volume and MA to appear, for me I think the line will be more comfortable been accessible.
After modifying the settings I clicked on the Ok botton, here I will be showing the overall phase on how the chart showed after series of settings and modifications, look at the snap-shot below.
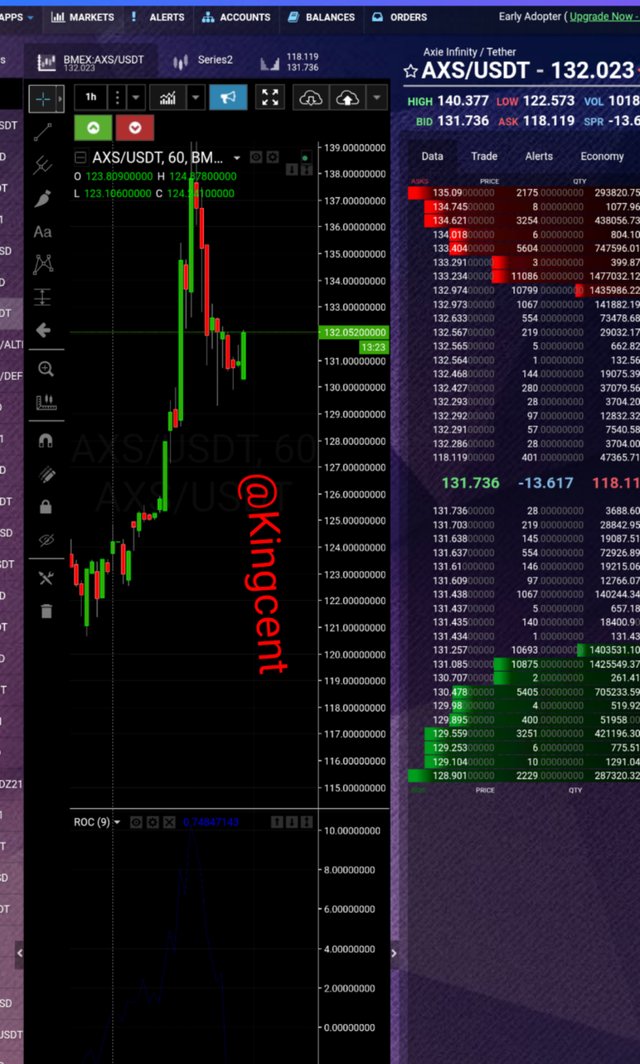
snap-shotcollected from coinigy official website
What is the ROC trend confirmation strategy?
Trend confirmation has to do with evaluating the right time to place buy or sell in the market, this can be done through an indicator, that is a motivational factor discussing about this ROC oscillator. Trend confirmations are very pivotal.
Before you enter the market be it at entry or exit points the Indicator in use must confirm the trend, if price trend and the Indicator in use are going in opposite direction then know that there is problem somewhere, that means divergence is occuring.
Here I will use ROC for trend confirmations, keep reading and watch how this unfolds.
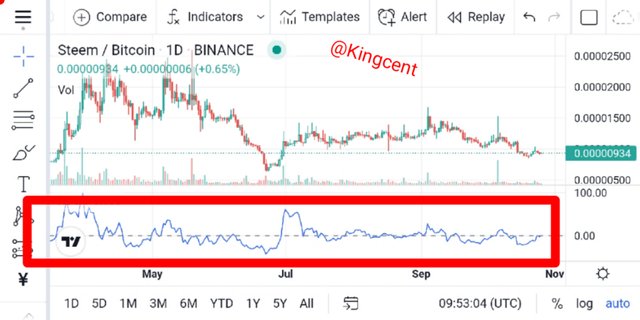
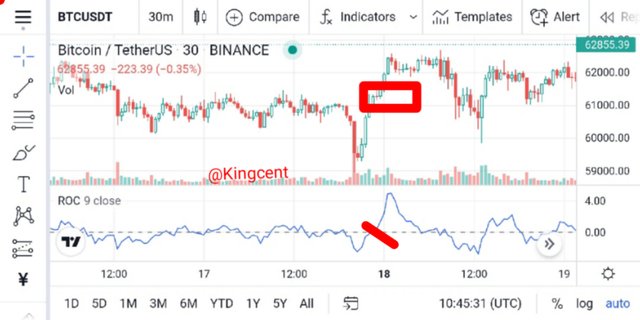
Technical Analysis has to deal with charts, to confirm various trends and each strategy deployed depends on the traders physcology, using the ROC Indicator to confirm price movement is very simple all you need look at is the structure that price is about forming through that you can detect your entry position.
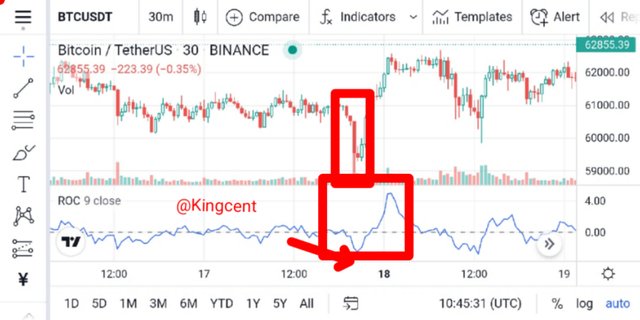
Looking at the chart above note that whenever the spread of ROC exceeds 3 to 4 I might tag it Overbought or oversold, at the chart above price is Making a surge to move downward, that means price is in oversold phase, yet to make a cross above the line.
At this point a buy entry has been confirmed, I will buy this market and wait a little,it's just a matter of time before price gets to the resistance level, looking at the structure of the market, price is trying to form a W formation. So a buy signal has been confirmed all you need is to make your buys, remember ROC oscillator works best when Market is trending.
And what are the signals that detect a trend reversal? (Screenshot required)
When we talk about trend reversal is more like a break and retest, price may be forming series of higher highs, and all of a sudden the trend will change and start forming a higher low at this point another trend has been initiated all you need to do is to draw your trend-line and follow the trend as it unfolds.
At this point I will say the market structure has helped to detect new trend, you don't trade blindly, you trade market structures, Technical analysis traders always believes that patters occurs and repeats itself, that is why we have structure like the head and shoulder pattern, double top and double bottom.
Whenever you notice a new you can easily detect the next signal be it but or sell signal, you can then spot it with good snippa entry. you can also keep an eye on candle-sticks formations, market might be trending and price forming series of highs.
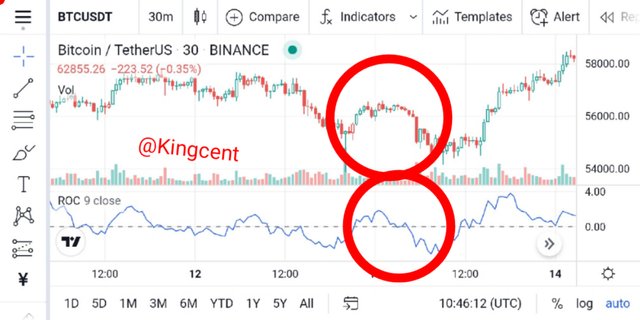
and all of a sudden you see a bearish candle-stick engulfing the previous bullish candle, at this phase trend reversa may change from forming higher-high High's to higher low. Let's see this chart below for further illustrations.
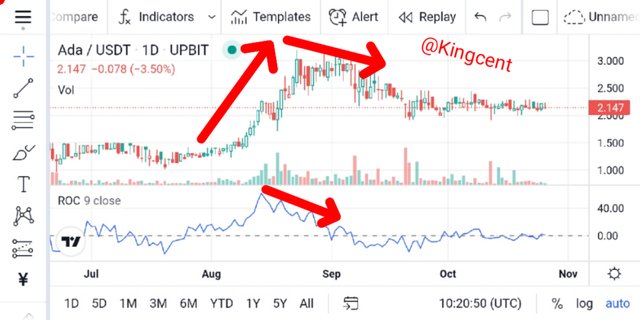
From the chart above price was forming series of higher-highs, and all of a sudden trend reversed and break and retest started to occur, at this phase I will say the series of bearish/red candle-stick engulfing the bullish ones led to the change in trend, you can also see how the ROC Indicator was able to spot it out, price moved from resistance level down to the Support zone, crossing the 3 lines.
What is the indicator’s role in determining buy and sell decicions and identifying signals of overbought and oversold؟(screenshot required)
Indicator determining buy and sell decision in most cases isn't accurate as divergence usually occurs in most synerio, but Indicator moves as price moves too as well, so determining when to buy or sell is pretty easier, another thing is knowing the phase of the market before executing your buy or sell entries.
Let's say price is in Overbought region, in this phase you don't buy instead you follow the trend and sell, place a sell entry, I will say most times at the resistance Overbought level there are always a sell signal provided by the Indicator.
At the Overbought region if you don't want to follow the trend and sell, it's optional, you can wait until price gets to the support zone and you buy the market up again, monitoring the ROC Indicator you will get the desired signal you need to execute the market.
Buy signal determining oversold region
From the screenshot showned below there is a buy signal, price been at Overbought region, so as an experience trader what you need do is to place a buy order and indicate your take profit at the best zone, remember indicating TP is optional.
You done sell at the oversold region, you only place a buy, and indicate your TP, if need be.
Sell signal determining Overbought region
Whenever market buys to the resistance level, the next thing is for sellers to enter and drag the market back to support level, the highest point it got before retracing back is the resistance level, at that level you don't place a buy again.
ROC Indicator didn't divergence, it followed the trending market remember this Indicator works well when Market is trending, from the chart price got to the resistance level confirming a sell signal and later retraced downward. At this phase signal for overbought has officially been identified.
How to trade with divergence between the ROC and the price line? Does this trading strategy produce false signals?(screenshot required)
Divergence usually occurs when Indicator stop moving in conjunction with price in the market, at this phase we say divergence has occured, when Indicator moves in opposite direction with price the divergence is on the way, it usually affects the Indicator been used and the price line tends to change, at that phase false signals are innevitable.
Bullish divergence
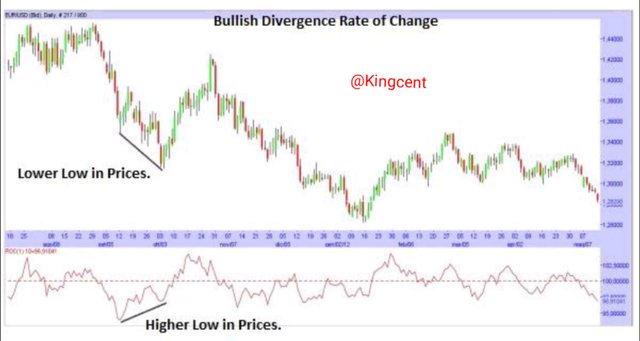
Bull means buy, in trading terms, bullish divergence is a period where Price does correspond with the Indicator been in used they both acts in opposite directions. We know that the ROC Indicator measures % change courtesy price. The divergence are measured in percentage, and along the process comparism are done.
The period of ROC has a standard values which are 12 days and 25 days for traders who places short trades. And for traders who trades long they have 125 days to 250 days, note there are huge difference for traders who trade in a long term and the ones who trade in short term. The ROC standard values are always different.
Bearish divergence
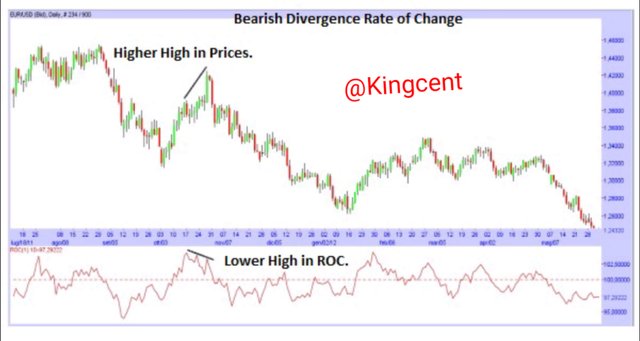
When there is a change courtesy the high's and lows formed at the price and the Indicator then divergence is occuring. Looking at the chart uploaded you will see that at the ROC Indicator price is forming lower high, and at the market price is forming higher high.
Looking at the line you will understand that zero above the zero line Indicate that price is going to rise, various values below the zero line means that price is going to decline.
Note whenever divergence occurs there are always reversals in trends.
How to Identify and Confirm Breakouts using ROC indicator?(screenshot required)
When market is moving forming various structure, higher highs, or higher lows, courtesy support or resistance levels, then later retraced more like a breakout to fake buyers in the market at this phase I will say breakout has occured in the market.
For me a breakout can also be classified as a false signals, because when a Market is in Bullish phase and breakout occurs some traders May collect their profit at that time thinking a retracement is about to occur.
from the chart uploaded you will see that the market was forming series of higher high, and a reversal candle-stick pin-bar showed up. But the market continued in bullish phase thought, until it got to the highest resistance level.
When the little break out occured, the ROC Indicator was forced to shake, but later continued the trend as price kept on forming series of higher highs. Note there is a difference between retracement and breakout's, some people thinks they are the same.
Review the chart of any crypto pair and present the various signals giving by ROC trading strategy. (Screenshot required)
When market trends it's appreciated with the help of an indicator and before entrying the market you should identify the trend with the aid of the Indicator, here I will use the ROC, Indicator to confirm various signals here I choosed a Crypto chart involving the SHIB/USDT.
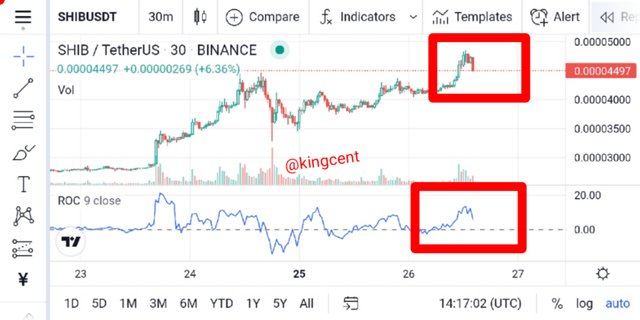
Looking at the signal provided on the ROC, you will understand that it's a sell signal, market was at the resistance level up until a bearish candle-stick showed up engulfing the previous one that's a clear downtrend, so what you need do is to enter for a sell downward.
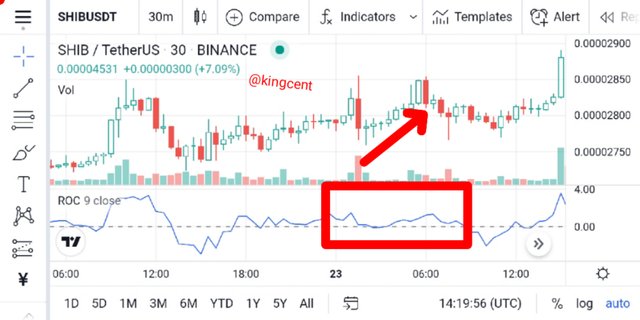
ROC oscillator showing a buy signal, looking at the chart you will understand that a bearish bullish engulfing closed above the previous candle-stick there validating the Support zone, by so doing the ROC is clearly showing a buy signal.
There has been many structure's forming, break and retest, several patters but you need clear identification from the Indicator in use before making your entry be it buy or sell entry, knowing your trading strategy will also boost your Profit maximization, knowing how to read various candle-sticks will also help you to propagate your profits in the market.
Conclusion
Here I will conclude whatever I have discussed from the home-work task so far, from my homework I highlighted alot of things where I said that ROC which simply means Rate of Change this Indicator is basically used to measure percentage change courtesy price and the previous price which is mostly seen as N. The ROC has the mandate of notifying the momentum associated with price movement in previous times.
In the case of trend confirmations you need apply various Indicators and they need point in one direction to confirm your entry or exit point at any particular time, of course we know that Indicators moves as price moves too in the market but there are always times where the Indicator and price moves in opposite direction, at that phase divergence has occured. Thank you very much for this wonderful lecture professor @Kouba01.
Hello @kingcent,
Thank you for participating in the 8th Week Crypto Course in its 4th season and for your efforts to complete the suggested tasks, you deserve a Total|4.5/10 rating, according to the following scale:
My review :
An article with under average content that required me to stand on a number of points, the most important of which are:
An acceptable explanation of the ROC indicator and how to calculate its value. It was possible to use a price edited from a real graph so that the result and conclusion are closer to reality.
You did not touch on how to choose the best settings for the indicator period.
Your answer about determining the trend and its reversal was inaccurate, as you touched on the two signals from a general angle without reaching the prinipal target.
The same remark for the following two answers.
In the last question it was possible to extract several other signals.
Thanks again for your effort, and we look forward to reading your next work.
Sincerely,@kouba01