FIBONACCI TOOLS/STEEMIT CRYPTO ACADEMY S6W4 HOME-WORK POST FOR @PELON53.
Introduction.

No doubt market moves in circles/zig-zag form that is practically why we have fluctuations all round be it in the forex market, futures Market, or crypto market, they are practically the same in tense of the way market moves.
Before you start your trading journey there are key things your mentor is suppose to teach you trust me they will guide you to making good trading decision's, first you will be thought support and resistance.
Since market moves in Zig-zag manner/form knowing your support and resistance helps you know where the market is at a particular time interval through that you can know when and where to execute your orders.
When orders are been executed they are done to favour the trader in the sense that you trade to maximize Profit's at the tail end of the day.
Another important thing to not is the vario retracement Levels at this point we will talk about the topic of discussion for today Fibonacci tools.
Explain in your own words what you mean by Fibonacci retracement. Show an example with screenshot.
Fibonacci retracement can be defined as a horizontal levels in a chart pointing out strategic positions where support and resistance will mostly occur, Fibonacci retracement levels are enormous but the good thing there is that each Levels are associated with various percentages courtesy how much price retraced.
various Fibonacci retracement levels includes 23.6%, 38.2%, 61.8%, and 78.6% note 50% is not a Fibonacci retracement level but it can be used as a Fibonacci ratio, I so much love this Indicator because it can be drawn pointing at price point's determining high and low, more like Support and resistance phases in the market.
Fibonacci retracement level connects levels known as potential Support and resistance levels.
Fibonacci percentage levels are strategic point's where price can make a U-turn thus reverse.
They have some common ratios which are 23.6%, 38.2%, 50%, 61.8%, and 78%.
The various levels are splendid but shouldn't be relied on exclusively, price can hit a fib level and not reverse.
We have talked More about various Fibonacci retracement Zones let's give some examples for proper understanding.
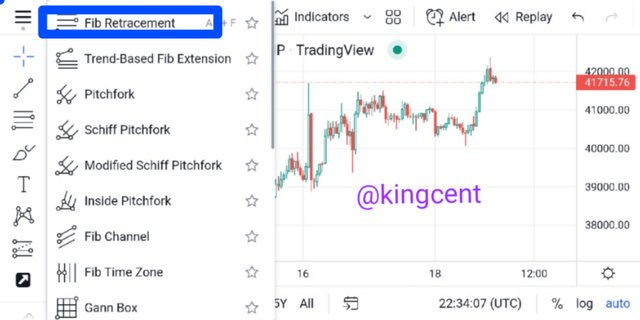
Looking at the chart above adding Fibonacci to a chart looks pretty simple all you need do is to access the landing home-page of trading view.
After acessing the landing home-page, at the left hand corner click on the first icon and you will see Fibonacci.
Click on it and apply it to a chart, before then choose a Crypto pairs so that the application will be done easily.
After applying it to a chart you will see the various Fibonacci retracement levels lined up.
Explain in your own words what you mean by Fibonacci extension. Show an example with screenshot.
Fibonacci extension can be defined as basic tools that trader's makes use of while determining their Profit potential's over a specified period of time, with Fibonacci extension one can determine the duration of price after pull back has been exhausted
Fibonacci extension can also be said that they are strategic areas in the market where we can observe reversals, the extension levels are centralised courtesy Fibonacci ratios, the common Fib extension levels we know are as follows 61.8%, 100%, 161.8%, 200%, etc.
Before giving an example courtesy Chart let me say a stock goes up from $10-$20, and comes back to $15.5, in here I will conclude that the move from $20-$15.5 is a retracement if we see a hike in price maybe to $17 and upward then we say this is extension
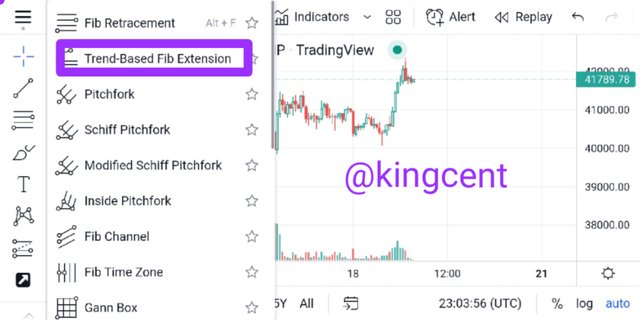
Locating Fibonacci extension is very simple all you need do is to access the chart interphase after Fibonacci retracement level, click on the second icon.
Select a crypto pair e.g BTC/USDT, apply the fib extension from the bottom of the last downtrend.
One major objective of applying Fibonacci extension is to know these three things
Point where trend began
Point where trend ended. And
point where retracement ended.
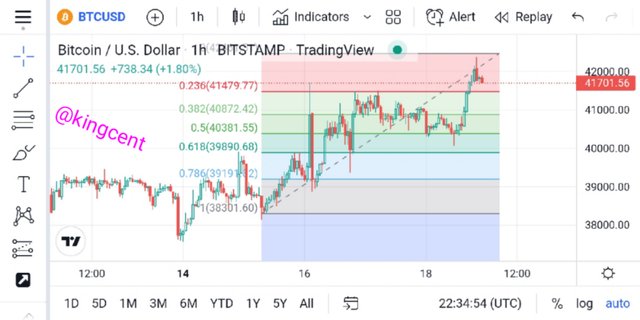
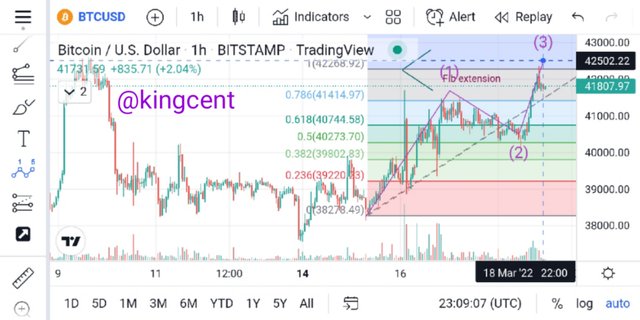
Now looking at the chart the above listed things where all observed from the bigining of the trend fib level from the downtrend which is basically where price begun was seen at 38278.
After all retracements you can see vividly from the chart that price got to 42268. Courtesy Fibonacci extension, we should understand that Fibonacci Levels assists us to knowing potential Support and resistance levels.
Perform the calculation of the Fibonacci retracement, for the levels of: 0.618 and 0.236. Pick a crypto pair of your choice. Show a screenshot and explain the calculation you made.
There is a formular used in calculating Fibonacci retracement, when that is gotten you can proceed to getting the recoil, let's proceed to see how it unfolds.
Fibonacci Levels are pretty much percentages courtesy as a result of a particular chosen price range from the question given 0.618, and 0.236, where chosen.
Just as I said we have a formular in Calculating Fibonacci retracement and the formular is stated as
R1=X+([1-% retraced/100)]*[(Y-X)]
X=the actual point where fib level took center stage.
Y=Where Fibonacci fib Level ends, the value up there will be considered.
From the onset I stated the various fib ratios and they includes 23.6%, 38.2%, 50%, 61.8%, and 78%. Diving into the Calculations proper we have
R1=X+[(1-0.618)]*[(Y-X)]
From the chart my X and Y are 0.618 and 0.236, respectively, substituting then into the equation we have
R1=0.618+[(1-0.618)]*[(0.236-0.618)]
=1.325*-0.382
=0.12415
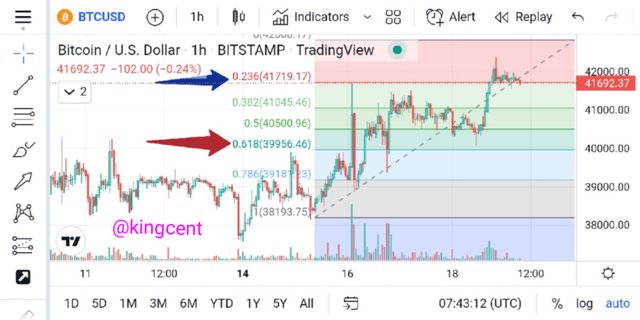
For us to calculate the recoil we have to consider where fib level started and the highest point reached, consideein that we have
38195.75 USDT and .
41719.17 USDT.
The recoil will thus be at 0.382.
R2=381195.75+[(1-0.382)]*(41719.17-38195.75]).
R2=38195+[(0.5*3,523.42)]
R2=38195+1,761.71=39,956.75USDT.
R2=39,956.75 USDT.
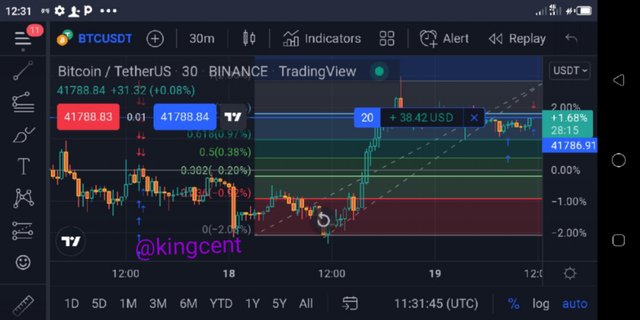
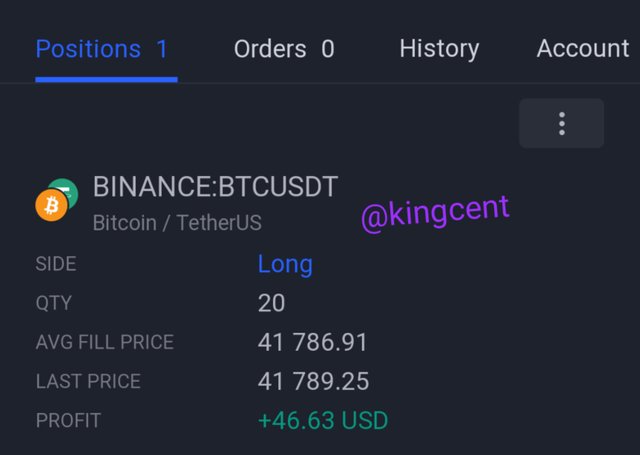
On a Live account, trade using the Fibonacci retracement, screenshots are required.
Fibonacci retracement helps you detect various Levels of support and resistance, which by all identification are levels where orders can be executed.
For me I don't just depend on the fib levels alone to execute my orders first I have to consider price actions, and chart patterns with this two my orders can be placed and seen yielding fruit's.
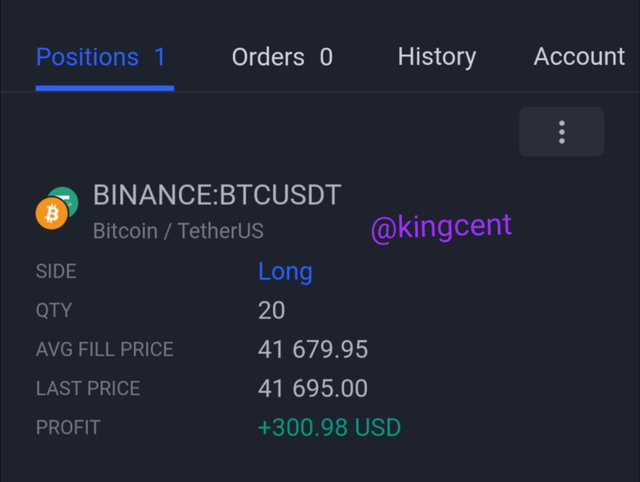
Looking at the chart above I analysed my Levels of support and resis courtesy Fibonacci retracement points, from Support to resistance level I observed a higher-highs, and higher-lows formations all round.
From the Support phase I waited when price got to the resistance zone, it failed to close above the previous high, this calls for a sell signal, when I confirmed it, I quickly placed a sell order.
My trade came out with flying colors as I was already swimming on profit at the trail end of the trade, after sometime I checked back and my trade was already yielding fruit's.
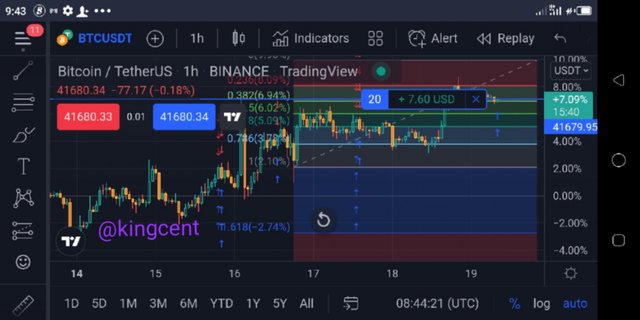
On a Demo account, make a trade operation using the Fibonacci extension. Screenshots are required.
Fibonacci extension makes use of determining profit potentials from my chart I will saw a duration of price occuring after various pull backs was officially observed.
My fib extension was basically inline with price actions and market structures and formations all round with this I was not confused on the strategic points of my trade execution.
My trade was executed in good fate and as you can see I'm already maximizing good profits from the chart I showed. Fib extension shows you spots in the market where market will reverse.
I quickly waiting monitoring the extension levels when my set-up entered I quickly buy order when I observed a reversal considering the fib extension Levels.
Conclusion.
Fibonacci retracement level are strategic points stated out by horizontal lines used to measure out key Support and resistance levels, this levels are spot's in the market where reversals are bound to occur overtime.
Fibonacci extension can be defined as basic tools that trader's makes use of while determining their Profit potential's over a specified period of time, this Levels aren't 100% sure that is why one needs consider other trading potions too.
Trading in general entails alot one needs analyse properly remember the market itself is super volatile so lots of concentration has to be put in place to maximize profits in due time.
Thank you very much professor @Pelon53 for this wonderful lecture presented by you today I really appreciate God bless you sir.