Introduction to the principle of Crypto Analysis/cryptoacademy /S4W7, Home-work post for @imagen
Introduction
Trading is an act that involves buying and selling, and the superior motive here is to make good profit at the end of the exercise, as a result of buying and selling, knowing when to buy and make profit is important and knowing the amount to sell to inquire massive profits are also very important, this are the basic concept of trading physcology.
In the volatile Market, it's pretty the same but a little bit different, before buying an assets you need carry out lots of Analysis to determine your entry and exit point in the volatile Market, at this point fundamental and Technical analysis comes to fruition, as the homework post goes by I will highlighting in details what Technical and fundamental analysis are all about in details.
What are the differences between Fundamental Analysis and Technical Analysis? Which one is used most often?
Before we proceed to knowin the difference that exists between fundamen and Technical Analysis, it will be nice we discuss the both in a more detailed form.
What are fundamental analysis
Fundamental Analysis can be defined as a process of determining the value attached to an assets thereby summarizing the various factors that will influence the price of that assets in future moving forward.
The basicity of this form of Analysis are centralized on events that involves financial statements are trends, one important thing about fundamental analysis is to know the authenticity of price, whether it is Overbought or oversold very important.
In fundamental Analysis you understand economic change, in the market economic news might emernate from a particular country and it will affect the market drastically this news can affect supply and demand based on that particular countries currency.
Let's say in the United States, economic news be it politics or other things can contribute to making their currency strong by so doing fundamental Analysis could be done and you see people putting their cash on the countries currency by so doing the currency will be strong.
Technical Analysis
Technical Analysis just as the name implies can be defined as the study of prices and their behavior with the sole motive of using a chart pattern, by so doin determining the future movement, price actions can be determined with the aid of an indicator.
Technical analysis makes use of chart to identify various trends, they apply indicators that moves as price moves this will bootress their capability in determining future probability of market reversals, Technical analyst believes that patters repeats in the market so each time they sport their snipa entries they always indicate stop loss and take profit, all this are mostly verified courtesy patterns.
Technical Analysis involves identifying Support and resistance levels in the market, with this you can easily know your entry and exit point's in the market. Technical Analysis centralizes on
Trend identification
Identification of Support and resistance entry and exit points through the assistance of charts and time-frame's.
Markets does three different things which are move up(bullish), move down (bearish), and move sideway.
Technical Analysis uses three various technique for their Analysis which are
Price actions; this involves the study of previous structure formed, and drawing of trend lines to ascertain when new structure will be formed.
- Chart patterns; this involves where price will be going to and the break and retest structure it's about developing.
Indicators; indicators are used to confirm trends in the market, it can be used to know when to buy and sell in the volatile market**
Diffeeenc between fundamental and Technical analysis.
| Fundamental | Technical analysis |
|---|---|
| Fundamental Analysis basically centralizes on the viscosity courtesy various prices of an assets and it's behavior in the future | Technical analysis basically centralizes on Market charts, and previous trends/structures formed, technical analysis makes use of multiple Indicators to confirm trendings in the market. |
| In fundamental Analysis traders considers various factors before knowing their entry and exit points, such factors could be climate change, politics etc | Technical analysis deals with the study of price action's just to identify various patters in the market, this patters could be break and retest |
| Fundamental Analysis involves the study of a country currency, if a particular country economy is good their currency will appreciate vice versa | Technical analysis are basically used to identify Support and resistance in the market, by this knowing when to buy and sell is key, knowing when market is in Overbought and oversold region. |
Choose one of the following crypto assets and perform a Fundamental Analysis indicating the objective of the Project, Financial Metrics and On-Chain Metrics.
Cardano (ADA)
Solana (SOL)
Terra (MOON)
Chiliz (CHZ)
Polkadot (DOT)
Before investing in any Crypto of your choice Analysis has to be carried out to determine the future of that particular assets, courtesy the question I will choose Solana.
Solana deals with smart contract, and it's platform gives different investors the opportunity to build their various DApps decentralized applications, the Solana project kick-started in the year 2017, and the mainet was officially launched in the year 2020.
Solana coin;Solana has a blockchain and the SOL cryptocurrency powers the entire blockchain technology, Solana token initially had a maximum supply ranging around 500 million, some previous allocation was as follows.
Seed sales=16.23% of intensive supply.
System strategic sales=1.88% of actual supply.
Block validator scale=5.18% supply.
Uses of Solana coin
Half 50%, of some percentage paid to Solana are burnt bringing reduction courtesy the maximum supply, the remaining percentage are used in rewarding the block validators in the blockchain ecosystem.
Uses of Solana coin;when you stake Solana token you are bound to becoming a block validator in the blockchain, those in possession of the coin too can stake, along the process gain staking reward.
- One major objective of SOL coin is that they are used to pay transaction fees, in the blockchain. Also SOL coins are very much needed to carry out proposals in the blockchain network.
Coins grows more rapidly if Many people are bound to having the coin within their posession, as a particular ecosystem grows the coin will continue to experience an upsurge. Currently at the time of writting this post SOL token is trading at $59, volume ranging at 821.
Looking at the chart below SOL token price is ranging at $200.46, currently ranking no 6 by coin-marketcap.
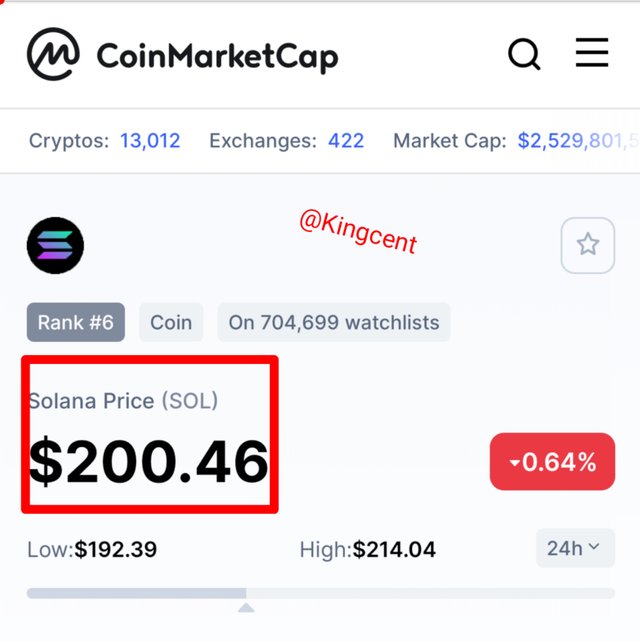
Currently SOL coin in circulation are massive as over 80%, are been staked, this means that there are little coin available for sell in the trading market, there are many activities on the Solana network courtesy this Solana coin will experience an upsurge and push forward forming higher-high.
Make a purchase from your verified account of at least 10 USD of the currency selected in the previous point. Describe the process. (Show Screenshots)
Intense Analysis has been done and I will be purchasing the SOL token with my binance account and the process will be described just keep reading and enjoy the the process.
Making a purchase in of any coin has two phase long term and short term investment, you can buy and leave the coin after your analysis it will surely rise, that's long terms investment, you can purchase a coin within a short while it can add $3, then you sell and collect your profit that's short term investment.
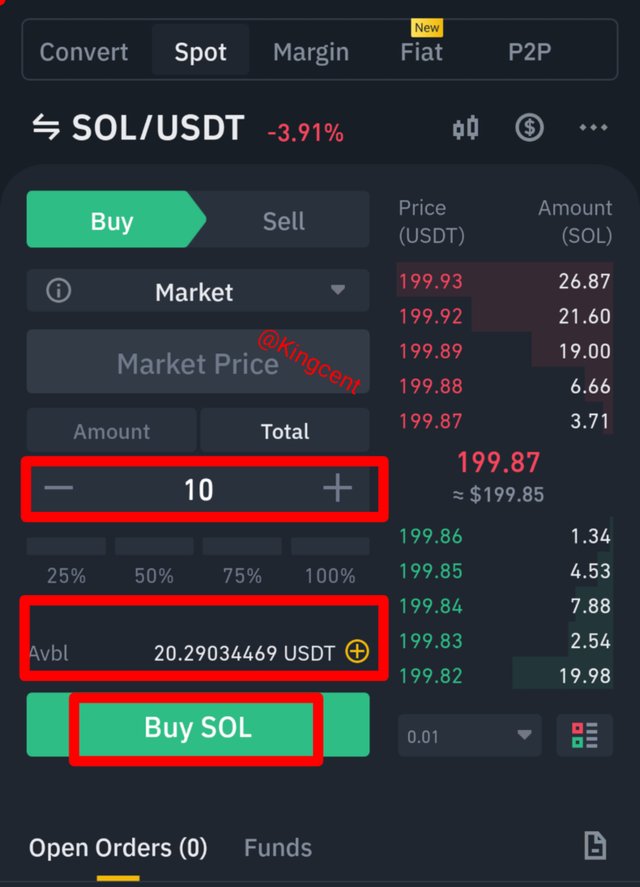
From the snap-shot uploaded you will see that I was having $20 worth of USDT, and I decided to use $10, to buy SOL, token which is SOL/USDT, procedures you open your binance account.
click on spot and imput how many USDT you want to use to purchase SOL token, after that you click on buy, you can check the market by clicking on an icon at the right side of the screen and the chart will open vividly.
Apply Fibonacci retracements to the previously selected asset with a 4 hour time frame on the platform of your choice. Observe the evolution of the price at 24 and 48 hours, did it go up or down in value? Look to identify resistance and support levels. (Show Screenshots at 0, 24 and 48 hours of purchase where the date and time are observed).
Before we proceed to applying 4 hour timeframe on chart courtesy finanacci retracement level's, I will tell you that Fibonacci retracement level are practically horizontal lines mapping out Support and resistance level at the exact spot price will reverse to. Fibonacci retracement experiences an upsurge when market is trending.
Using Fibonacci it's very possible to detect the exact phase price could reach in future, you can easily know when to buy and sell using Fibonacci tool. Let's look at the chart below in Four hour timeframe image collected from my trading view App
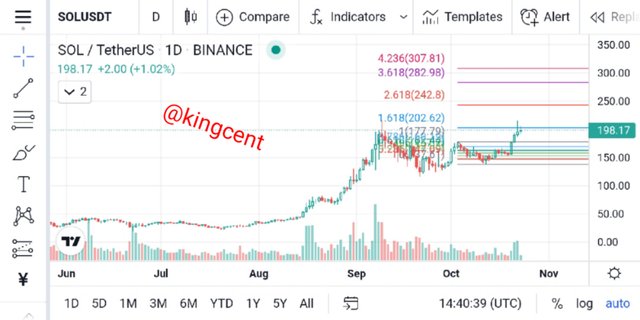
Looking at the price evolution, you will understand the Support and resistance levels price moves from Support to resistance and looking at the chart price will retrace back to support level, that's one important thing about Fibonacci retracement, is that it gives you an insight about the exact spot where price is going to retrace to.
What are Bollinger Bands? How do they apply to Crypto Technical Analysis? With which other tool or indicator do you combine Bollinger Bands to analyze a Crypto? Justify your answer.
Bollinger bands can be defined as an indicator used to analyze deviations plotted against each other, it can be positive or negetive deviations, this deviations can be inform of a simple moving averages, Bollinger bands was officially developed by a practitioner called John Bollinger.
Bollinger bands are technical Indicator put together by John Bollinger, it it's used to detect Overbought and oversold in the market.
Bollinger band has lines, which are the simple moving averages, and the upper hand and lower bands.
upper and lower bands, has +and - from 20 simple moving averages SMA, although it can be modified along the process.
one motive of Bollinger bands are assets identification, you can use this Indicator to identify the phase of an assets, whether that are in Overbought or in oversold region.
Applying Bollinger bands to crypto technical analysis are very simple what you need do is to follow the various steps which will be highlighted here.
First go to any exchange of your choice and find the Indicator. Here I will be applying it with other Indicators just to determine the phase of an assets be itOverbought or oversold.
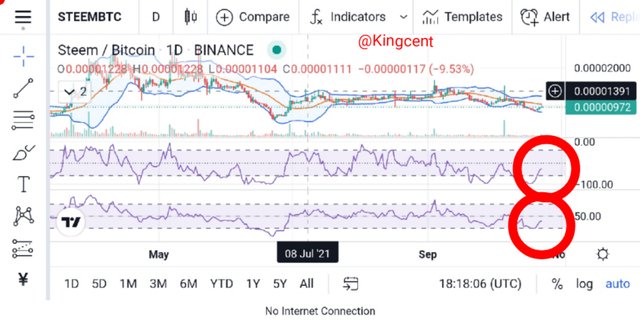
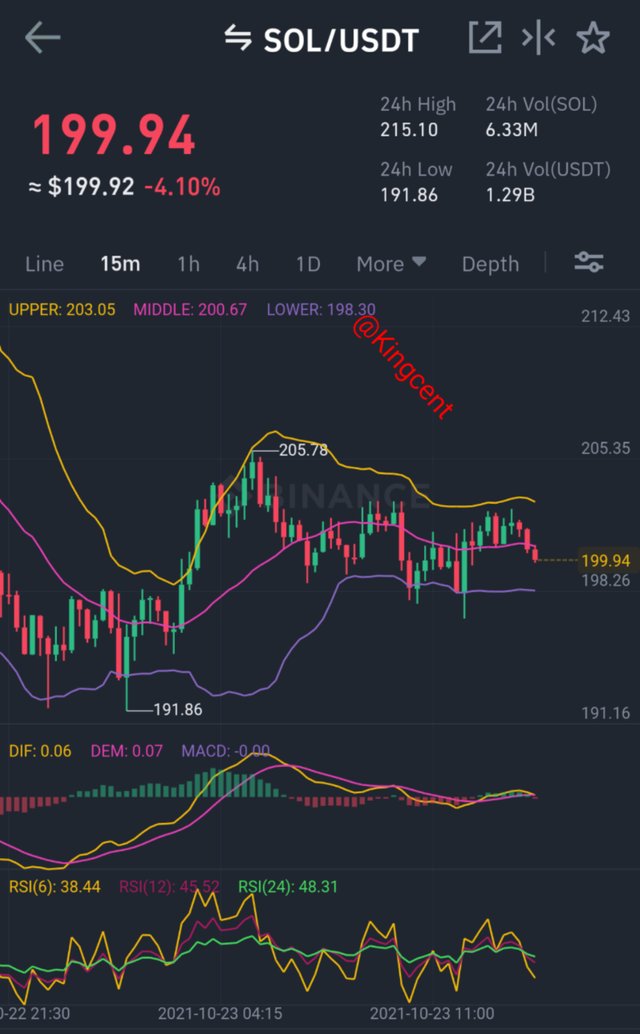
From the chart uploaded I successfully combined Bollinger bands, with Williams %R, and RSI, just to determine Overbought and oversold region in the Market. Looking at the chart the market is in oversold region looking to make an upsurge to the resistance level which is the Overbought region.
One thing about price is that it moves in Zig-zag form, to be able to detect break and retest you need apply various technical Indicators to execute that fate. Just as I have done I was able to detect the phase of the market. Looking at the chart I think I will place a buy up,
Conclusion
Concluding my write ups courtesy this home-work I understand and write that technical Analysis involves the usage of various charts to predict future prices in the market, traders in the technica field Believes much in chart patters, and structures, they Believe that structures repeat itself, I also highlighted in details that Fundamental Analysis involves the determination of values attached to an assets, further Analysis will further boos-tress the future price of that particular assets.
I also hinted on Fibonacci retracement where I said it's a horizontal lines mapping out Support and resistance zone, where market will exactly retrace to, I also said that Bollinger bands are Technical Indicator tool, used to highlight positive and negetive deviations, Bollinger bands was officially invented by John BOLLINGER, it's basic used to detect Overbought and oversold in the market. Thank you very much professor @imagen trust me I really learnt alot from this great lecture.
Gracias por participar en la Cuarta Temporada de la Steemit Crypto Academy.
Continua esforzandote, espero seguir corrigiendo tus asignaciones.