PHYSIOLOGY OF TREND CYCLES/CRYPTO ACADEMY S6W4/HOME-WORK POST FOR @REMINISCENCE01.

Introduction.
Trading Crypto currencies are very volatile you needs expert's to teach you the basics before you can exploit the volatile market in full force many thanks to this great platform through here trust me we have gained lots of experience on how trading effectively.
Trading for me remains the act of buying and selling in order to make Profit's, Profit's are the basic word here on-like our normal food stuffs market trader's out there buys Good's in Large quality, sells at an affordable price in the end profits are maximized.
But in trading cryptocurrencies there are twicks because here the market in general is super volatile so you need Carry out do many analysis basically done through the use of charts patterns (technical analysis), courtesy this we shall discuss about the father of technical analysis Dow theory.
Explain your Understanding of the Dow Jones Theory. Do you think Dow Jones Theory is Important in technical analysis?
Technical analysis comprises the study of charts patterns and the father of this is no other person than Dow jones he developed a theory which clearly states that market price actions has great impact regarding the available information of the various market movements and trends.
The way we analyse price actions in technical analysis using charts are officially propagated by dow in the 1990's till date the systematic approach still works, now let's look at price actions technical analyst still believe that previous trends are repetitive which happens up till date in the market.
In general understanding I believe dow's theory is super fantastic since it entails trends, for me if market is trending then more trends will no doubt be established and they are been categoricalised in three facet's which are as follows.
Primary trends..
intermidiate trends and.
Minor trends.
Since dows theory talk's about technical Analysis and the financial market I think we can't authentically ignore trends. Let's breakdown the various trends for proper understanding.
Primary Trends.
Primary trend shows the main movement in the global market in general, we know what trends are in the market generally, but the actual trends is key.
Intermidiate Trends
This type of trends are very difficult to decipher because it takes very long prior for retracement to occur, trends are very important regarding technical analysis.
Minor Trends.
Minor Trends just like other trends are pretty reliable and takes along lasting spray, when this Trends occurs then it is trusted. Trusted in the sense that with other analysis it can be proved valid.
The importance of dows theory in technical analysis can't be overemphasized in technical analysis expecially when it comes to dows belief where it is believed that trends can act as a follow-up to confirm volumes in the market.
Dows belief up till today is very much valid as we all know price moves with trends, and that can't change anytime soon, price and trend will keep on moving in the same direction until there is a breakout.
With this theory traders can easily spot out trends in the market, when this are been done then the treader is bond to maximizing good profits on a long run, when there are so much trends in the market some Indicator larges behind.
For me I think dows theory is very much appreciated and important to our daily trading activities, uptill now what's does theory signifies still in all ramification takes center stage.
In your own words, explain the psychology behind the Accumulation and Distribution phases of the market. (Screenshots required)
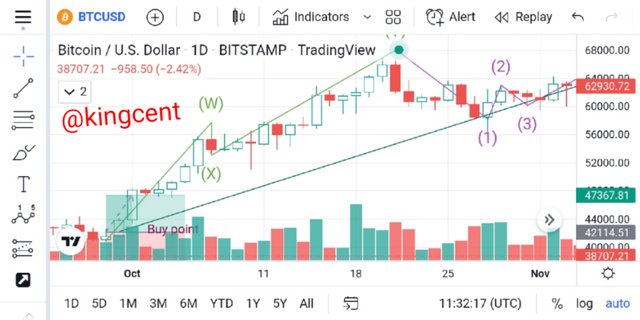
Just as the question demands here I will explain the accumulation and distribution phases in-conjunction with screenshots to back up my claims. But before that it will intrest you to understand that market moves in Zig-zag form (circle's).
Realistically I will tell you market moves in the same direction all round and the formation goes inline with the same phase, when market isn't consolidating, then they are forming series of higher-highs and lower-lows etc.
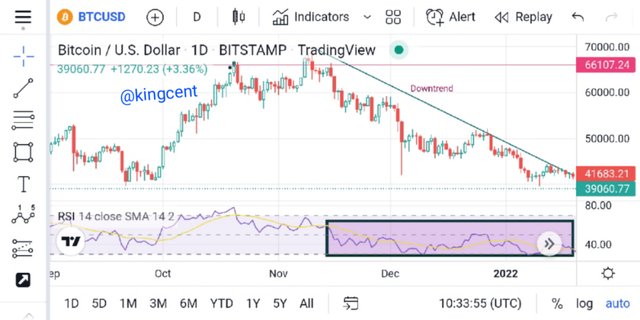
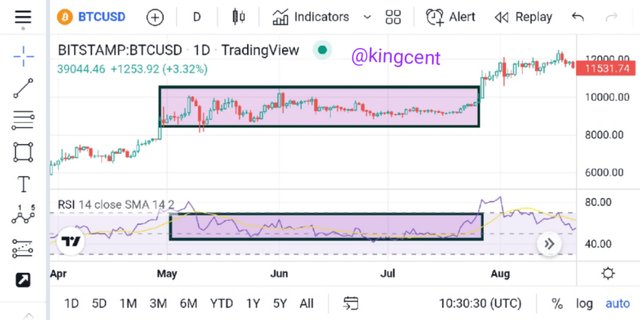
Accumulation phase; in this phase the physiology behind it simply is consolidation (ranging), when we observe an accumulation phase what it means is that trend has no definite shape thus they are stocked out in a ranging manner, let's look at the chart below for proper understanding.
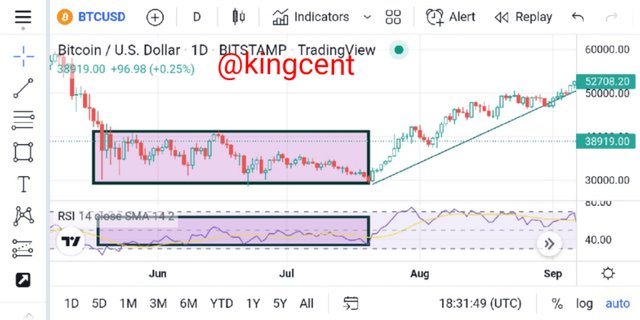
This consolidation period in the market can also be called basing period we usually observe it after downtrend has be completed at this point sellers have started collecting their maximized gains from the sell orders previously placed.
During consolidation periods Indicators used usually give/provide conflicting signals because at that moment there isn't any atom of trending in the market all round, untill there is a breakout either to the uptrend or downtrend then we can read the trend as per the formations.
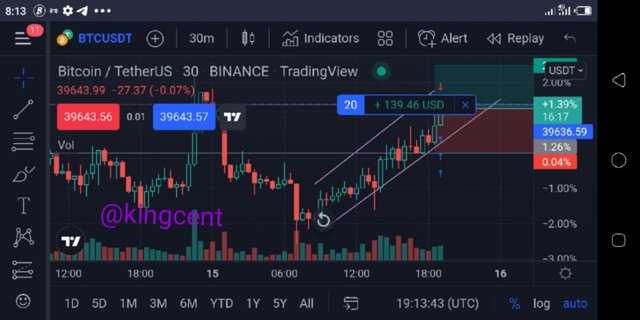
Looking at the screenshot I provided you can see a clear consolidation and all of a sudden break-out occured to the Uptrend phase of the market, now looking at the Indicator the signal it provided was very conflicting.
For me until I see a clear trend in price movement then I won't place any order, until there is a clear higher-highs, and higher-lows formations then I can't be able to place any other because trends haven't been defined.
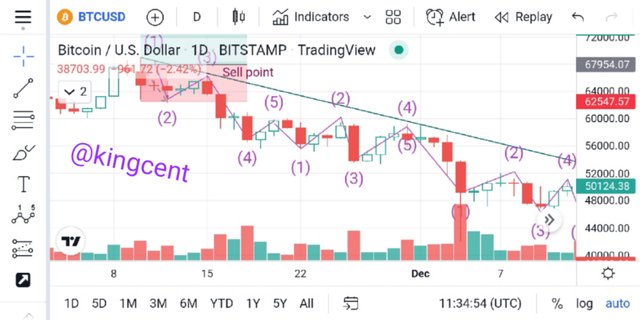
Distribution phase; Distribution phase can be defined as a phase in the market where price climaxes to it's highest peak. At this point creating a sell options for various trader's, when this happens market officially migrates to another range periods.
For me it doesn't matter be it accumulation or distribution the key point here is the ability to identify trends instead of predicting on the next move, this is technical analysis, not prediction analysis we should be talking about analysis not predictions.
Distribution has a pattern which is know as the head and shoulder pattern, if you are able to spot out this then you are good to go.
trust me this pattern is very rare regarding head and shoulder pattern, whenever this distribution patterns comes to fruition the downtrend is about to occur.
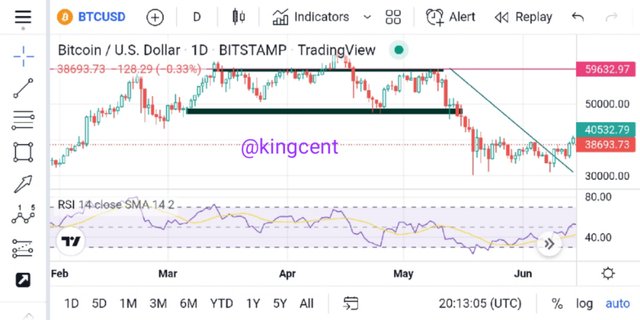
At this point sellers gain advantage as they are bond to dominating looking at the market structure you will see a series of lower-highs, and lower-lows formations all round, we know at some point market will surely reverse.
The basic tool i normally used to identify distribution phase in the market is the head and shoulder patterns, once this occurs then downtrend is emminent, one can in one way or the other rely briefly on the Indicator for me all round I prefer confluence trading.
In general during distribution phase not just head and shoulder patterns but there are so many other patters too that one can use to confirm this phase like the triple tops, and the head and shoulder patterns very important.
Explain the 3 phases of the market and how they can be identified on the chart.
I have highlighted the accumulation phase for uptrend and distribution phase for downtrend the both have officially been discussed by me but in here I will proceed by Explaining the three phases of the market which includes.
Uptrend
Downtrend and
Sideways.
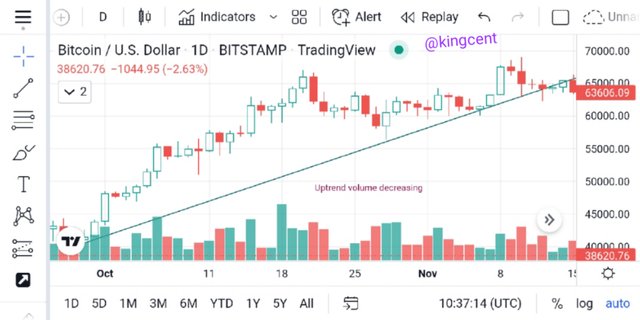
Uptrend; when this happens in the market that means there are series of ascending higher toughs, in general market is forming series of higher-highs and higher-lows in the global market overall.
In identifying this market phase you can decide to pass a trend-line through the point of descending Lower-highs the trend-line needs to be valid when price touches it multiple times before it's eventually gets broken.
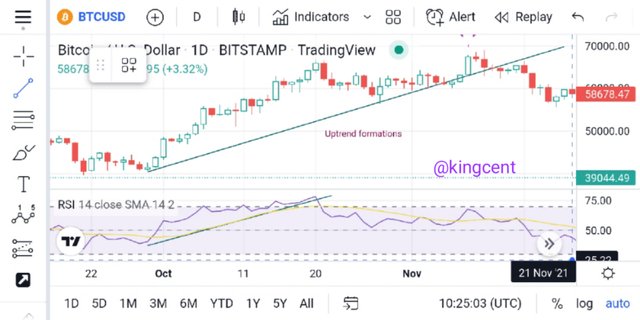
Looking at the chart vividly you will see a clear bullish phase, price forming series of higher-highs and higher-lows formations all round, in here from the Support level you start looking for buying opportunities.
Replying on the Indicator alone isn't ideal for me, Indicator doesn't provide sure signals instead they just lag around and give lot's of divergence all round.
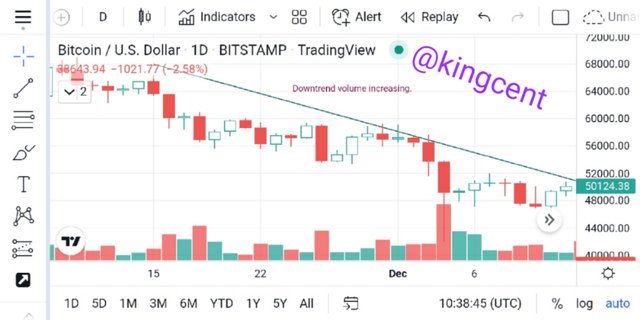
At this phase trend-line is connected from the resistance level down to the Support phase, this time sellers usually takes advantage from the resistance phase, looking at the chart price keeps forming series of lower-highs, and lower-lows.
In identifying market phases for me I think the best is market structure and price actions, with this trust me you don't even need any form of Indicator for price confirmation all round, all you need is to plot your support and resistance.
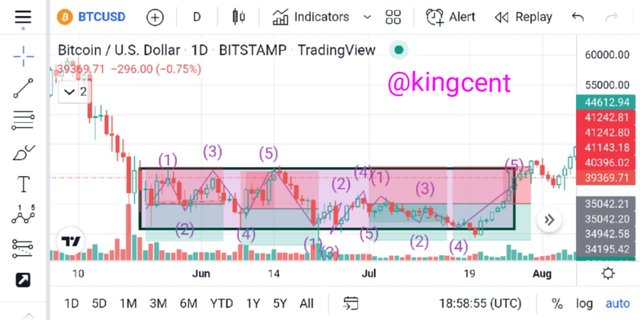
Identifying ranging or sideway market comes with a phase which are a point at which there lots of consolidation meaning there is no clear identity as to a region at which market will go.
Whenever ranging occurs in the market that means break-out is emminent and this break-out could go either side be it to the Uptrend or to the downtrend, at this point Indicator usually lags thereby providing conflicting signals overall.
Explain the importance of the Volume indicator. How does volume confirm a trend? Do this for the 3 phases of the market (Screenshots required).
Before we proceed talking about the importance let's talk about what volume Indicator entails in real Sense, volume Indicator shows how trading Volume changes over time, converging volume Indicator is very essential regarding crypto trading, volume shows the strength of a trend
In technical Analysis in general volume is very important especially when you consider using an indicator and price actions, below are some take-away points regarding volume's.
Volume helps in identifying the strength of a market over a specific period of time.
When price decline volume seems to increase thereby there will be a momentum to the downside.
When Price goes up volume seems to decrease at this point reversal might occur.
Volume confirms a trend by measuring the total number of shares traded at a specific time interval by so doing alerting trader's on the overall market activities, just as I said previously when market is down volume increases let's check this out in a chart below for proper understanding.
When you see an increasing volume know that market is going bullish that means there will be more buyers than sellers in the market all you need do is to identify your buying position and proceed with your orders.
The nature of the volume be it an increase or decrease usually guage the strength of the market overtime, thereby providing an overview courtesy the phase of the market at a particular time.
When there is an increase in Volume then market will potentially be on a sell side, at this point you should be looking for a potential sell positions, all this analysis the bottom line remains that with volume you determine market directions be it bullish or bearish.
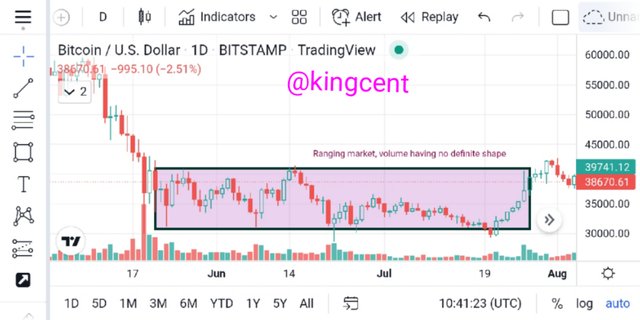
Whenever you see a ranging market volume doesn't always have a definite shape overall, but whenever you observe a lower-lows formations all round then you see volume increasing but at the ranging spray volume has no definite shape.
In a ranging market, any indication used at that particular time seems to not to work effectively same is applicable when it comes to volume. At when market ranges there isn't a specific phase as to market directions up until break-out occurs.
Explain the trade criteria for the three phases of the market. (show screenshots)
With respect to Volume one should know how to place a trade regarding volume's which determines market directions over a specific time interval, one basic trading criteria is the ability to determine various trading point's in the market which are your support and resistance levels.
When you determine your support and resistance levels then you will be able to know the next order you are going to place in respect to what volume is telling you let's look at some key examples for the three basic phases which are.
Bullish phase.
Bearish phase and.
Ranging/consolidation phase.
These three phases are very important to any form of trade that will be carried out in respect to Volume, we all know what bullish phase are, this is a point where market makes upper move to the resistance level.
For bullish phase to be authenticated you need consider some trading criteria' such that at first identify market structures and formations overall
Wait for market to move higher-highs for at least two steps before making a buy order from the Support phase.
You can decide to pass a trend-line to o validate your offers, at this point you can easily know when reversals will officially happens.
In respect to Volume you should under that when price surges up volume seems to decrease. Let's look at a chart below for clearer understanding.
In respect to what has been explained previously by me reading through the charts you can vividly see what it entails to either buy or sell.
Next I will explain trade criteria for a consolidation market, although in here is very difficult to map out trends because the market seems to be of equal balance.
Trading consolidation market seems good what you need do is to know your support and resistance levels very well then you are good to go in respect to where to buy or sell in general.
But for me I prefer not to trade a consolidation market up until there is a breakout either to the Uptrend phase or downtrend phase whichever then I know when to place my buy or sell orders.
In a ranging market it's very difficult to know where market will swing to as the moves in general are of equal size's take a look at the screenshot below for proper understanding.
With the Trade criteria discussed in the previous question, open a demo trade for both Buy/ Sell positions.
From the previous question I discussed bullish phase, bearish phase and consideration phase, just as the question demands I will open a Demo trade in each of the above discussion.
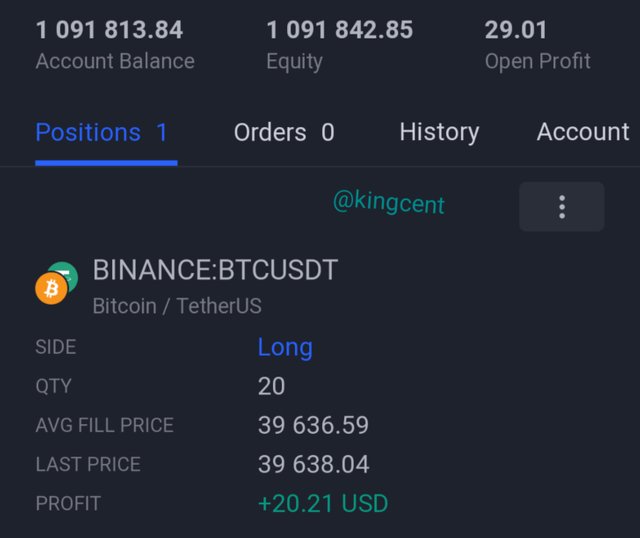
For the bullish phase you look for buying opportunities from the Support phase, let's check out this chart below.
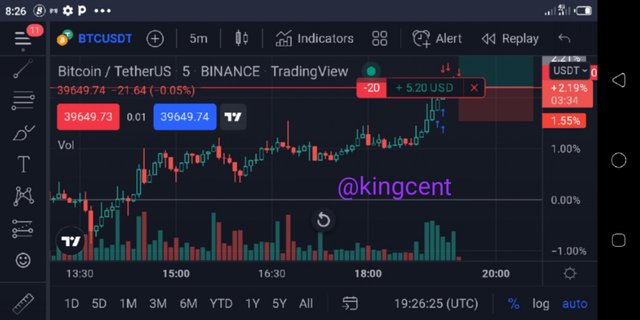
Looking at the chart above you will understand that I placed a buy order after I saw series of higher-highs and higher-lows formations, at this point the trend is valid, so I quickly placed my buy order.
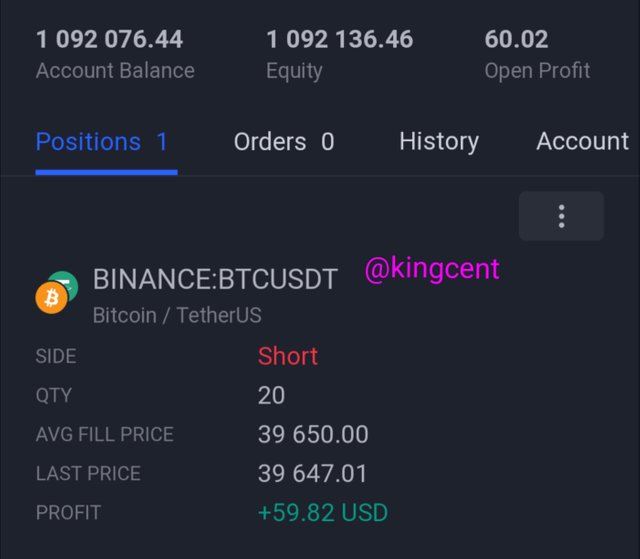
For the sell order from the resistance phase I placed a sell order knowing fully well that market is bond to reversing looking at the volume it helped me confirm the validity of trend in the market at that particular time.
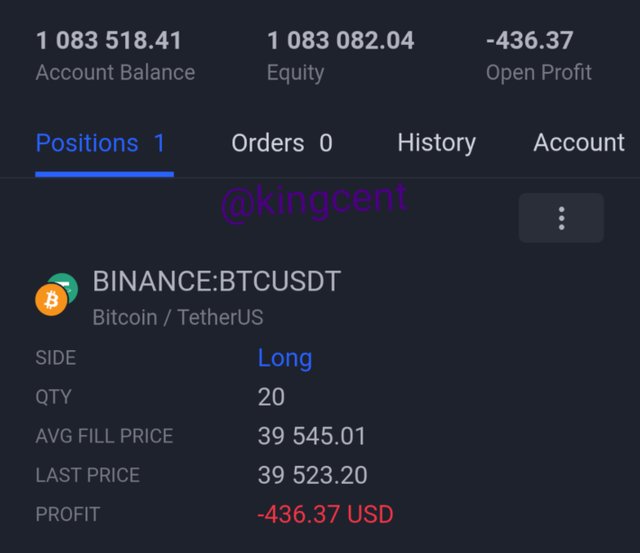
After I'm done placing my buy and sell orders I waited for a while to confirm the order outputs all of a sudden below was my net result,.
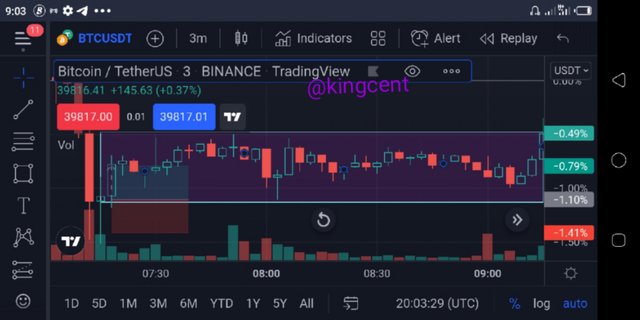
Ranging market occurs when there isn't a clear trend in the market, as you can see price really stocked at this point trading is difficult because there hasn't be any break-out from the Support level or the resistance level.
Let's see the chat outcome courtesy the trade I placed for the consideration phase. Let's see the outcome below.
When market consolidates you find out that in little ocassions there are more looses and more gain's courtesy the fact that the trends are pretty short, no clear break-out.
After I waited for a while for the various orders I placed to materialize behold this was my net profit in general, all my trades was true and hopefully everything came as planned.
Conclusion.
Market moves in cycles quiet understandable equating it to dows theory you will surely understand that actions has great impact regarding the available information of the various market movements and trends.
without trends you find out that market won't boom so in technical Analysis in general we look out for the study of various charts patterns.
In the market in general we have three various phases they are the bullish phase, the bearish phase and the consolidation phase
All this phases are characterised by various market structures and Analysis. Without proper Analysis you can't detect the various phases.
I also mentioned that volume measures the total number of Assets traded in a given time interval where I said when price goes up then there will be a decrease in volume, vice versa.
- Thank you very much professor @reminiscence01 for this wonderful lecture presented by you remember all screenshots used from copyright free source was specified thanks in general.