SUPPORT AND RESISTANCE BREAKOUT'S/CRYPTO ACADEMY S6W5/ HOME-WORK POST FOR @PELON53.

Introduction.

So many people around the world trade for a living, when it comes to trading one thing comes to mind which is buying at a low and selling at a high with the aim of making Profit, in our daily food market you buy in bulk pretty much very low and sell at a high thereby making good Profit.
But trading the global market seems very different because in here there are series of fluctuations which brings about market going or moving in Zig-zag form, when market moves in this form you find out different formations at this process you find out various entry and exit points.
Market basically technical analysis which involves the reading of charts, in this phase you determine various trading patterns which includes knowing and detecting key zones which are basically known as Support and resistance at this point we talk more about the topic of discuss.
Explain in detail the advantages of locating support and resistance on a chart before trading
In technical analysis in general Support and resistance are key as they helps you identify entry, and exit point's, they also helps you identify reversal points all round, depending on the point where Price gets to helps determine what will happen regarding Support and resistance.
When price gets to the Support level you look for a buy options, and when price gets to the resistance level you look for a sell opportunities, NOTE you don't buy at the resistance level, and you don't sell at the Support level, price in general are triggered by supply and demand.
When price gets to the Support level most trader's seems to place a buy, this raises the trend and when price gets to the resistance zone, you can put your T.P above the Support level, it's very important you determine your support and resistance zones as they will assist you make nice trading decisions.
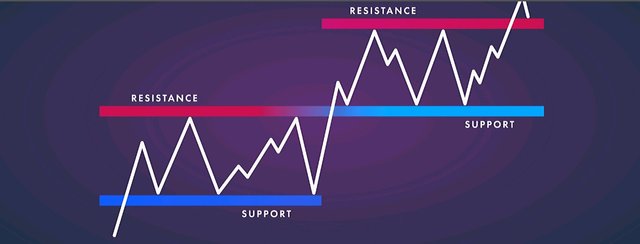
From the image provided you will see a clear understanding on how Support and resistance works and below are various Advantages in locating strategic Support and resistance zones.
Before trading if you locate Support and resistance zones it helps you know the phase of the market, incase of the Support zone you will understand that in Support zone downtrend movement stops which means that at that zone buyer's takes advantage.
Support levels are just temporary when price breaks below Support level that means market is still selling, until there is reversals to the uptrend then we observe series of high's formations, aside that market will keep on surging down. So it's very important to identify Support and resistance levels before trading.
In trading I must tell you looking at it from a mathematical angle it's very difficult to detect where the next Support is going to happen, but with chart patterns we can easily spot out good Support and resistance levels before proceeding to trading.
Identifying Support and resistance zones gives a trader a great insight regarding strategic reversal points in the market in general. Always remember that technical analysis deals with the study of Chart patterns so an occuring or previous patterns plays a huge role in the New occuring patterns as there are always break and retest.
Explain in your own words the breakout of support and resistance, show screenshots for the breakout of a resistance, use another indicator as a filter.
Talking about Breakout as a result of support and resistance levels what it simply means is that price moving aside a strategic defined Support and resistance levels with a strategic defined volume.
Let's say price broke above the Support phase as a trader what you need do is to enter a short position, then when price breaks above the resistance level you enter a long position by this trust me you will maximize profit.
Looking at the chart below you will understand the formation of a double tops, that means price went from the Support Level to the resistance level forming double tops before Breakout occured and price thus went bearish forming series of higher-highs, and higher-lows.
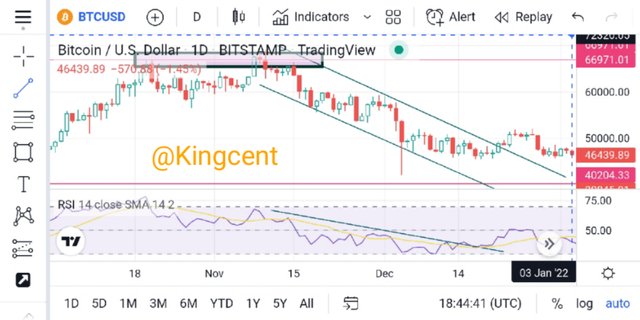
Incase of reversals be it from the Uptrend or downtrend one major thing we should consider is formations and market structures, been market reversal point's and possible retracement Zones/levels, they are very important.
Indicator helps us measure the phase of the market with the help of an indicator we can know when market is in Overbought and oversold region in general, from the screenshot provided I used Relative strength index Indicator (RSI).
Indicator moves as market moves anything aside that then we have divergence, from the chart BTC/USD, you will see a clear Breakout from the resistance level so as a trader what you need do is to place a sell order from the resistance zone, then your stop-loss can be seen above.
Show and explain support breakout, use additional indicator as filter, show screenshots.
In Support Breakout for me I usually confirm it when I see a formation of a bullish pin bar candle-stick with it I will know that market will go bullish what I will do next is to look for a spot where I will place my stop-loss.
Another way to knowing Support Breakout is when you see a double bottom formation, more like a W, formation at this point market will be going bullish which means there will be Breakout from the Support level to the resistance level.
When another lows fails to be formulated to go pass the previous low then Breakout to the Uptrend is about occuring, in chart combining multiple Indicators Confluence trading is very important as it gives you extra view on the spot where market will retrace to, let's look at a chart below for proper understanding.
Looking at the chart the rescent low didn't go pass the previous low level so there will be a nod for Breakout to the uptrend just as we know Market moves in a Zig-zag form there will always be a point where market will thus reverse.
Another tool that will guide you to determine Breakout trend is trend-line it's very important to trade with trend-lines in conjunction with Indicator to determine bullish or bearish Breakout in the market overall.
In a bull market when market gets to the resistance level and we see a hammer candle-stick with a long wick then Breakout is about to happen and trend-line broken, at this point buyer's are getting tired and sellers will surely take advantage.
Explain what a false breakout is and how to avoid trading at that time. Show screenshots.
False Breakout can also be called false signal it occurs in trading alot, whenever price moves above the resistance and below the Support level temporarily then within a short while retrace back to the exact spot it officially kick-started by this we call it false breakout.
As a trader you don't need enter a trade as soon as you witness a break in price, wait for at least two to three steps be it in uptrend phase or otherwise to confirm your trend first before placing your buy or sell orders,
When a level is broken and price changes direction then there is a false break-out, some traders place an entry courtesy the direction of the break-out but the disadvantage is that they get shrugged up when there is a reversal by this they loose money in the market.
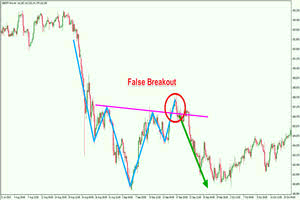
Looking at the chart above many trader's May be thinking that price is going to continue bullish not knowing that the break-out signal is actually false, all of a sudden we see price retrace down (bearish) forming series of higher-highs, and higher-lows.
Before we make an entry we should properly analyse applying various material's Indicators and expecially price actions, and market formations all this will assist one make good trading decision's instead of following a wrong fake signals.
Another important thing to consider in identifying Breakout is knowing and keeping a keen eye on trading Volume, when you see a legit break-out you see a change in it's trading Volume as a result of the proper phase of the break-out intensified.
If the volume isn't present then I will say break-out isn't bond to occur, but if trading Volume seems very low becoming very small when break-out is occuring they keep a keen eye on the next phase of reversal junction in your chart, you don't predict please always learn how to analyse.
On a demo account, execute a trade when there is a resistance breakout, do your analysis. Screenshots are required.
Resistance Breakout is when there is a breakout from the resistance level, trading break-out is very simple first what you need wish to identify the current occuring trends taking into consideration your support and resistance levels very important.
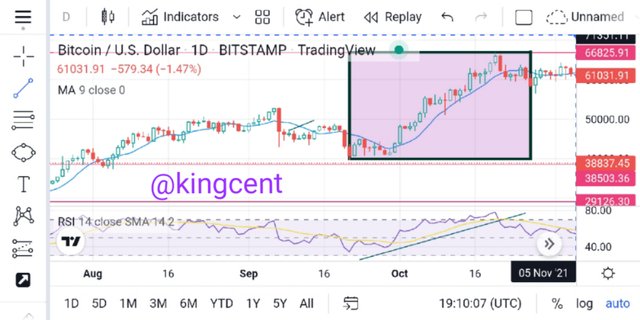
Analysis looking at the chart above I spotted a Trend from the Support level you can see a double bottom chart pattern more like a W formation imidiately that patter was established I quickly knew that price is going to surge up (bullish).
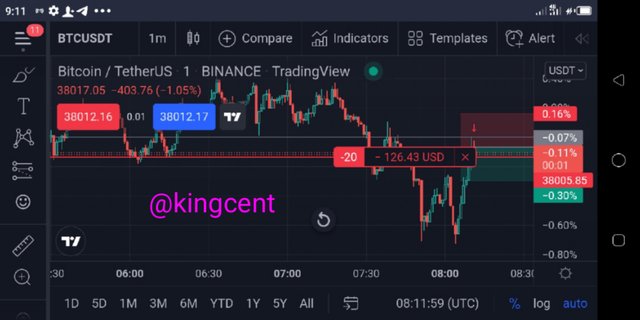
It happened as I annalised thereby price got to the resistance level retesting a previous double bottoms at the resistance level when I saw this I quickly knew that price will retrace downward, let's see if my analysis was correct or wrong take a look at the screenshot below.
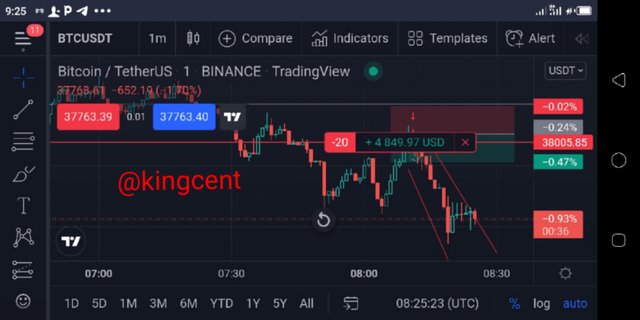
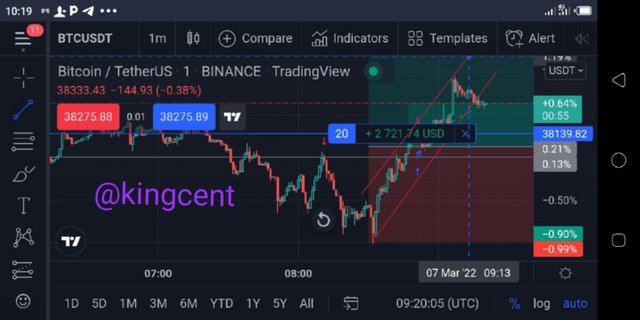
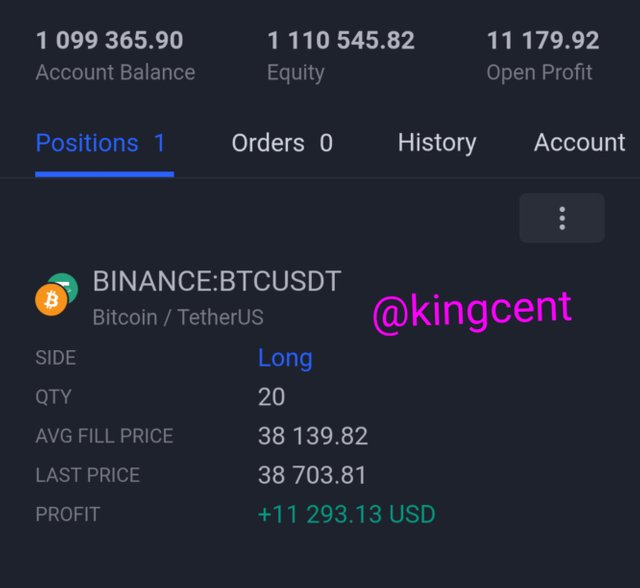
My analysis was very correct when break-out occurred from the resistance level price surged down going bearish forming series of higher-lows, initially I placed a sell order of 20 USD as you can see from the screenshot I have already maximized some Profit's.
In my Analysis I didn't use any form of an indicator, Indicators no doubt isn't 100% as they are always bond to producing false signals all round, if you know your formations and price actions very well trust me you are definitely good to go.
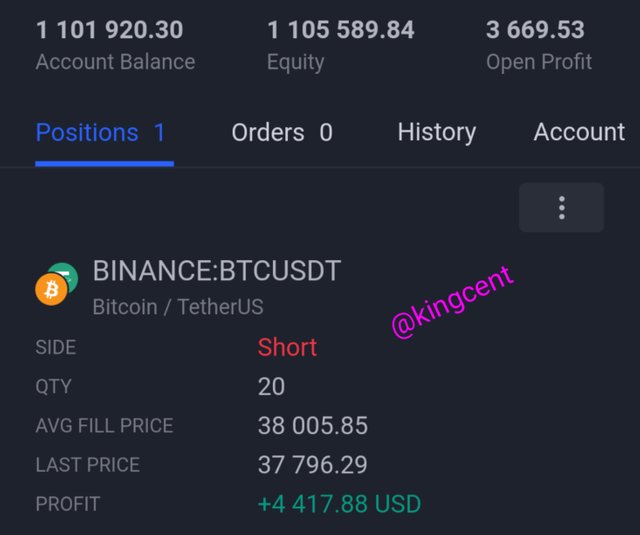
My analysis was very much in line that was why I'm on the positive angle, I believe so much in Analysis not forecasting, knowing one Support and resistance levels are very key, here I have done resistance Breakout now let's talk on the Support level.
In a demo account, execute a trade when there is a support break, do your analysis. Screenshots are required.
At the Support Level we only buy so when price from the resistance Level gets to support we should be looking for a buy options, especially when series of candle-sticks didn't close below the rescent ones so that downtrend continuation won't continue.
When we see a breakout from the downtrend price surges up that means we are pretty much having a Support break-out, as a wise trader you don't just place your buy order.
you have to Analyze properly because price can thus provide a false signal if you enter a buy you might hang and thus start experiencing looses, now let's look at what Support break entails.
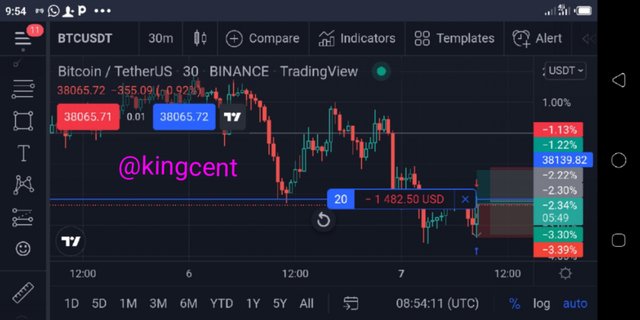
Looking at the chart you will understand a conservative price movement at the Support level price intend forming double bottom before surging up, at this point I know price won't go down below the previous low, after my analysis I realised that there won't be any other lower-highs or lower-lows formations.
What I did was to place a buy order at the Support break, you can see the screenshot above, now confirming my analysis I waited for some couple of minutes to see what is going to happen, from the chart I bought using 30min timeframe.
I bought 20USD as you can see from the Chart after waiting for some hours price actually surged up to obey my Analysis and I was pretty much on profit from the trade I placed.
In trading it's very important we know the importance of patterns all round in the market, always remember that market can't keep going up without retracements is not possible that is why we keep saying market moves in zig-zag form.
After placing my buy order trade I was very busy but after some hours I checked and realized that my Analysis went as planned as you can see I'm raining Profit all the way.
The ability to trade without Indicator gives you the trader a greater insight as to the possible retracement positions all round in the global market.
Conclusion
Support and resistance in general terms are positions in the market where a trader determines on what to do, for the support level trader's place their buy order, and for the resistance level they place a sell order.
One major advantage of support and resistance is that it gives a trader a major boost as to the next move in the global market, if there is a break from the Support level then market is bond to reverse, same applicable to the resistance phase.
I hinted on false breakout where I said it can also be called false signal it occurs in trading most times alot whenever price moves above the resistance and below the Support in less than no time retraces back then false signal is bound to happen.
I did some Analysis where I was able to place some buy and sell orders as a result of support and resistance breaks, thank you very much professor @pelon53 for this wonderful lecture presented by you today I'm really greatfull to be participating at this particular time of asking.
Please note all screenshots used that isn't the author's work where sources aside that all other screenshots are all the author's original work's, thank's for your understanding.
Cc;@pelon53.