TRADING USING TRIX INDICATOR/ CRYPTO ACADEMY S6W3/HOME-WORK POST FOR @KOUBA01.

Introduction
Trading the global market is fantastic what you need do is to learn the basics at the same time try and master the market, in trading I will tell you what you need is absolute consistency, one major question new trader's do ask is when do I buy and sell.
There are so many measures that has to be put in place before a buy or sell order will be executed one you need to know the phase of the market and the current trend formulation, you need to know your price actions very well.
Price actions gives you a great insight regarding the previous trends, in technical analysis previous trend plays a vital role in the upcoming trend formations, so one need pay keen attention as to that.
While trading you need know strategic areas where reversals are band to occur, this is simply Support and resistance, one major thing to consider again is the use of an indicator although using it isn't 100% sure, as to this we come to today topic of discussion TRIX Indicator.
Discuss in your own words Trix as a trading indicator and how it works.
TRIX which is the triple exponential moving average is a technical Indicator basically used to determine the phase of the market be it in Overbought and oversold region, if you are able to know the phase of the market you can easily determine where to place your order be it buy or sell.
With this Indicator a trader can easily determine the momentum associated to price, this wonderful Indicator was officially invented in the 1980s, by a man called jack hutson, this Indicator cleael shows the changes courtesy moving average.
In drawing trend-line one major thing to consider are the peaks and trough's zones I will tell you one thing this Indicator shows it all with this Indicator false signals can easily be filtered out and other spikes that isn't Worthy of producing positive result.
On the other hand you can call this Indicator an impulse Indicator, what it means is that with this Indicator one can easily detect when there is impulse in the market in general, this Indicator basically functions and looks like the RSI Indicator.
This Indicator is basically used to identify when market is Overbought or oversold.
It helps in the smothening of the moving average thus determine various price movements in the market.
This Indicator produces cool signals be it buy or sell, I believe whenever we see this indicator crossing the zero line then buy signal comes to fruition vice-versa.
Show how one can calculate the value of this indicator by giving a graphically justified example?
Every Indicator has a way at which it's values are been Calculated same is applicable when it come to TRIX Indicator.
This Indicator Calculations is centralized on triple EMA's, this Indicator basically evaluates prices of data's, for the default settings trust me it's optional on how you set yours.
Courtesy the Calculations we have a hupping four various components which are as follows.
First smothened EMA=18 EMA basically for closing price.
Double EMA=18 EMA single smothened EMA.
Triple EMA=18 period EMA.
TRIX= 1% change of Triple EMA.
Interpretations.
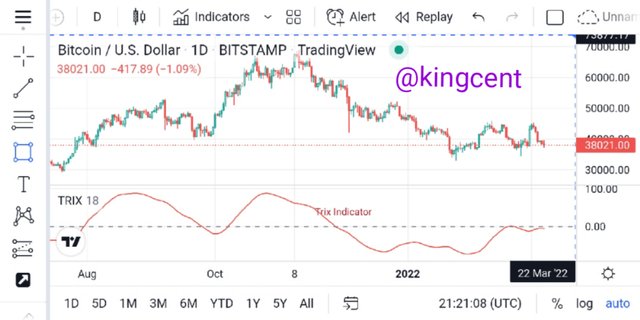
Looking at the chart where I added the Indicator you will see that the value is positive, whenever you see this you will understand that momentum will always be up vice versa when momentum is negetive.
Trix Indicator EMA is usually 18 EMA but can be changed as per what the trader wants all round, Trix Indicator is more like MACD but Trix Indicator line looks pretty smother.
Divergence: just as any other Indicator we know that Indicator gives us a clear overview on the phase of the market regarding when to place a buy or sell orders, I will say divergence is when price actions and the Indicator is moving either ways.
Despite the Indicator calculations that doesn't guarantee that divergence is totally eradicated, bullish divergence is basically the period when price is declining (fallen), while Bearish Trix divergence is when price is surging up.
TRIX(i)=
EMA3(i−1)
EMA3(i)−EMA3(i−1)
The formula above are used to calculate Calculating Trix for me I think 18 EMA is pretty cool but one can easily make a change but always remember that the higher the EMA value the higher it gets more smothened with the main aim of measuring Overbought and oversold region in the market.
Using various timeframes is pretty splendid because this Indicator motive depends on price data analysis, using a Higher timeframe elongates the standard of the Indicator, and thus making the occuring signals to be very valid, for me I think trading via the higher timeframe is the best.
how to configure it and is it advisable to change its default setting? (Screenshot required).
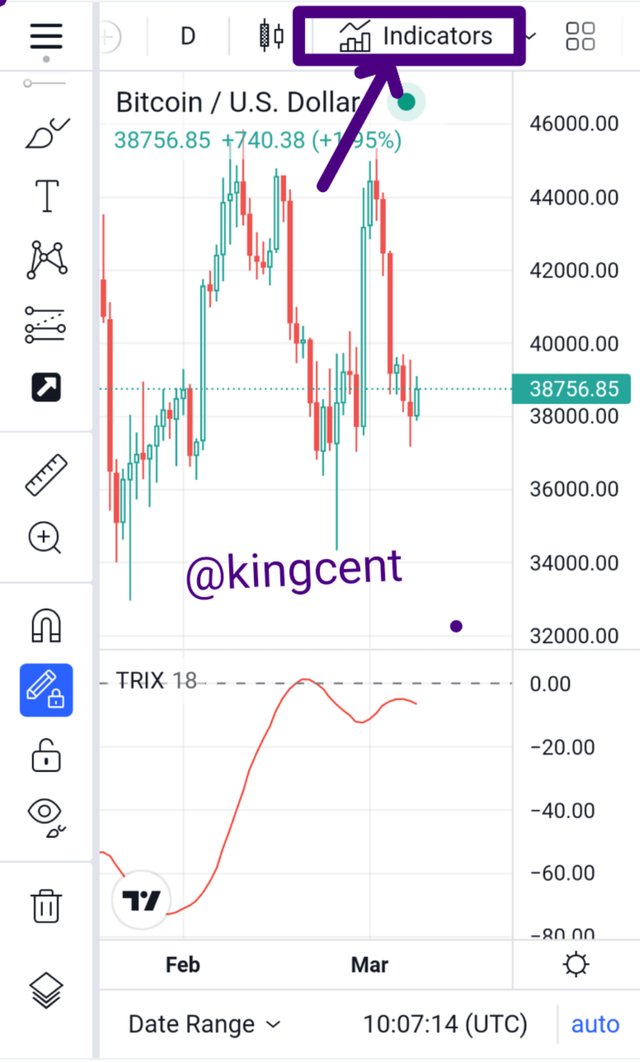
Configuring this Indicator is pretty simple, what it basically entails is the structure and format you want the Indicator to show, first configuring this you need access the landing home-page choose a chart pairs.
After choosing a chart pairs at the top of the chart you will see a spot where Indicator, is written click on it and choose Trix Indicator.
The Indicator will be applied to chart for me I choose 18 EMA, before then I choosed BTC/USDT chart.
- The standards for Trix Indicator is pretty much 15 basically for the triple EMA and 9 courtesy the signal line, but it's optional you can try a shorter timeframe like the 15 and 5, but when this is done trust me the Indicator becomes very volatile.
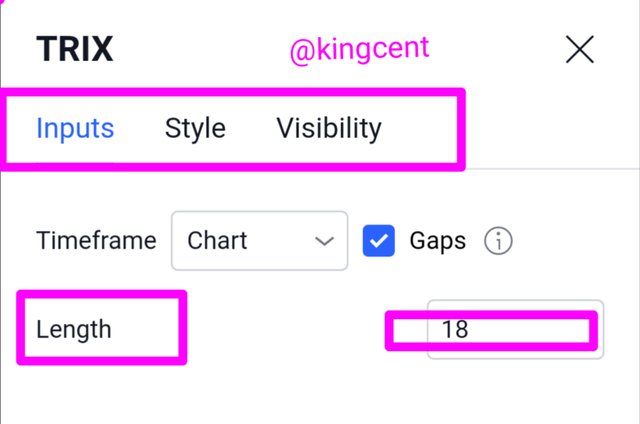
I choosed to add this figured to keep my Indicator line very smothened as we know the lower the Indicator the more volatile it tends to be.
It's optional courtesy the way you want your Indicator to appear that means there are always room for change.
Always remember that this Indicator is used to detect Signals so the Indicator settings matters alot.
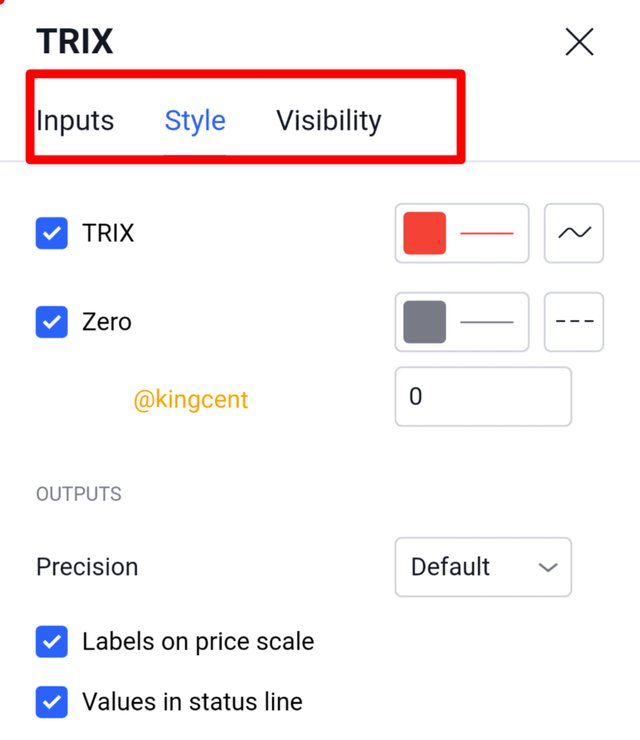
For the styles it depends on the colour you desire to be displayed in here I choose red.
For the zero lines you will choose how you want it to be as a result of the thickness in general.
Based on the use of the Trix indicator, how can one predict whether the trend will be bullish or bearish.
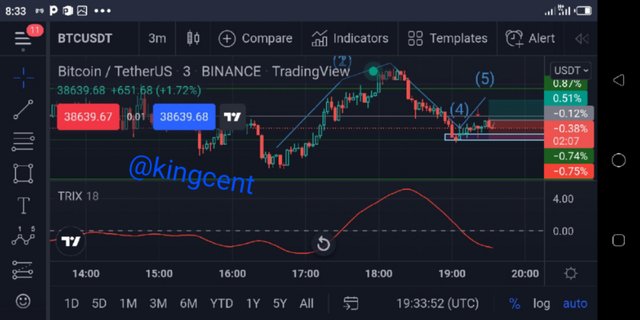
For me I believe in analysis not prediction but just as the question demands first I will consider market structure and price actions in conjunction with the Trix Indicator, don't forget in a hurry that Trix Indicator measures the phase of the market determining it's Overbought and oversold region all round.
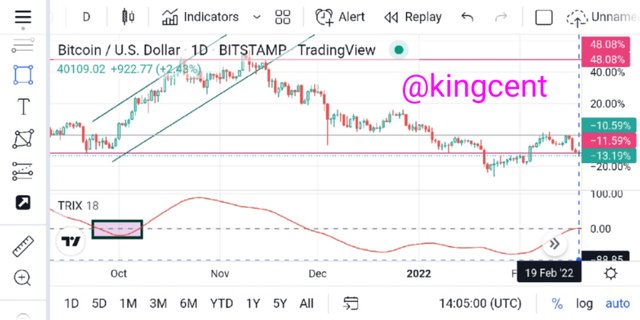
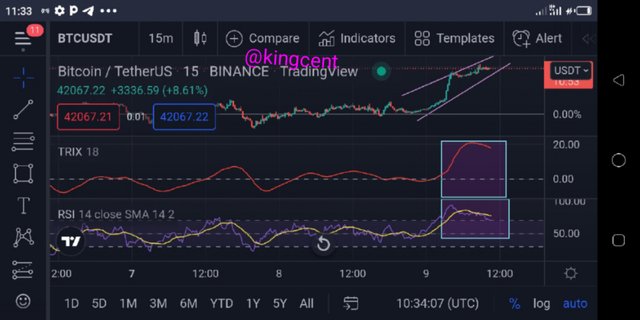
Looking at the Indicator you will understand that market is in the oversold region and the Indicator too isn't diverging, they both are working together at this point one can easily place a buy trade.
From the point where you place your buy trade there is a formation of double bottoms this clearly shows that market will surely go bullish, now looking at the Indicator and structure formulation you will see series of higher-highs, and higher-lows meaning Uptrend continuation.
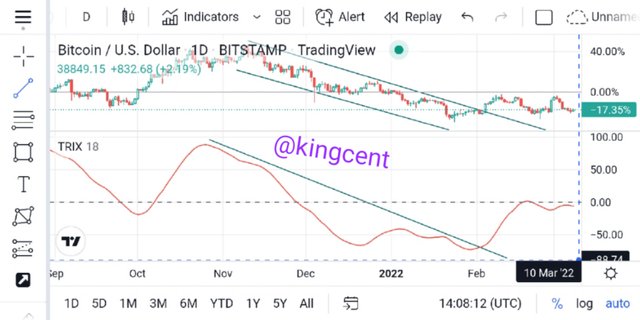
Bearish simply means downtrending market, you will agree with me that at the resistance level you only place a sell order which market will go down forming series of lower-highs, and lower-lows.
From Trix Indicator point of view, when market got to the resistance level Trix Indicator line was seen at the Overbought region which clearly gives a sell signal, for me you don't just sell instead you wait a little to confirm the trend with two to three step lower-highs.
Looking at the Indicator and price movement all round, both worked together, there wasn't any string's of divergence observed, one major benefit of this Indicator is that it measures the phase of the market determining when it's Overbought or Oversold.
determine the buy/sell points in the short term and show its limits in the medium and long term. (screenshot required).
Determining buy buy or sell point is pretty much simple if you know when to place your orders as a result of Trix Indicator signal, but for me I don't depend on Indicator b signals alone to execute my buy or sell trades in the market all round.
In short terms you have the mandate to carry out whatever orders you have structured in mind the limitations on a long run won't be all that negetive provided that the appropriate signal was followed, by this I will showcase a buy and sell trade let's proceed with the analysis all round.
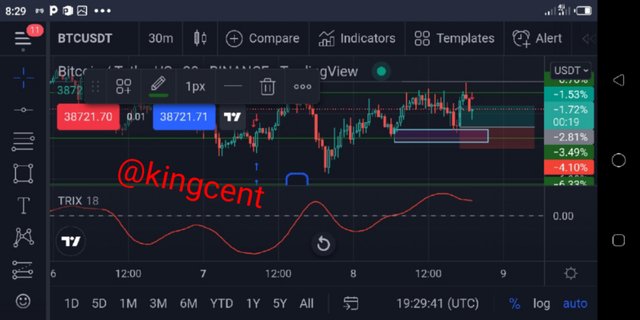
Looking at the chart above From the resistance zone the signal is a sell one, considering price actions is very much clear for a sell, from the Indicator point of view Trix is pointing down which signifies a clear sell option.
For me I don't depend on Indicator alone to execute my buy or sell orders, Indicators no matter how strong they are can't be 100% correct, there are always ups and downs, divergences here and there some false signals.
Looking at the chart market is trying to go bullish, for me this is a buy option, but looking at the Trix Indicator it's practically pointing down, this is purely divergence, Indicator doing opposite thing with the market.
In crypto trading which is very volatile one needs to be very careful to avoid series of unwanted looses, when I saw the divergence I waited for a while when I got back to the market to confirm my buy option this was what I encountered.
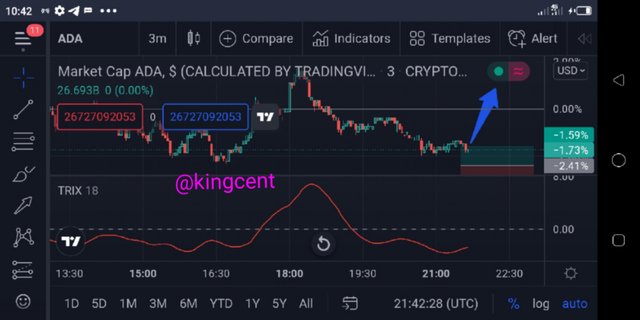
In this case indicator moved in-conjunction with prices in the market generally there wasn't any string's of divergence observed, analysis aside Trix Indicator showed me a clear picture of the trend phase.
From the resistance level there was series of lower-highs lower-lows formations until price came down to the Support level to retest a previous strong support before ralying up again, from the look of things price is bond to moving up.
By comparing the Trix indicator with the MACD indicator, show the usefulness of pairing it with the EMA indicator by highlighting the different signals of this combination. (screenshot required).
This two Indicators are very pivotal in trend confirmation MACD means moving average convergence divergence, it is a trend momentum Indicator when this two Indicators combines trust me the signal it will provide will be massive that is why I usually advocate for confluence trading.
The major usefulness is that a trader using this both Indicator will be very conservative in trading approach in such a way that even if there is a divergence in Indicator A Indicator B will be there to reply on, in conjunction with other tools.
For the various Signals it will produce a signal for buy will take center stage when there is a cross in Trix amid the zero line, and thus crossover courtesy MACD happens/occurs.
An exit signal will be emminent whenever you see MACD makes a cross on the phase of the Overbought region, for me as a trader I will wait for the Trix to make a cross in the opposite direction.
MACD and Trix Indicator looks very similar in-conjunction with the RSI Indicator all this helps in measuring the phase of the market basically Overbought and oversold, but when it comes to the EMA Exponential moving average the story changes a little bit.
Still on the phase of confluence trading here I will add the EMA Indicator with Trix Indicator to see the signal it's going to give me and how reliable everything is going to look like.
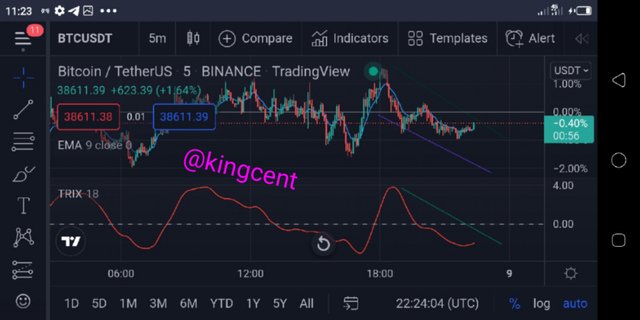
Combining Trix Indicator and EMA Indicator is pretty fantastic as the both Indicator moves as price moves too in the market in general, the two Indicator's provided a bearish signal no divergence observed.
Interpret how the combination of zero line cutoff and divergences makes Trix operationally very strong.(screenshot required).
I have previously explained what divergence is previously as for the zero line cross when this happens the Trix Indicator gains ground, with Trix you can easily determine the impulse of the market zero value remains the center line.
From the chart seen below we can see a clear cross and divergence taken place, whenever we were a zero line cross then it triggers a signal be it a buy or sell, whenever we see a cross from the center line from above gives signal for an impulse market through this analyst can take a sell decision.
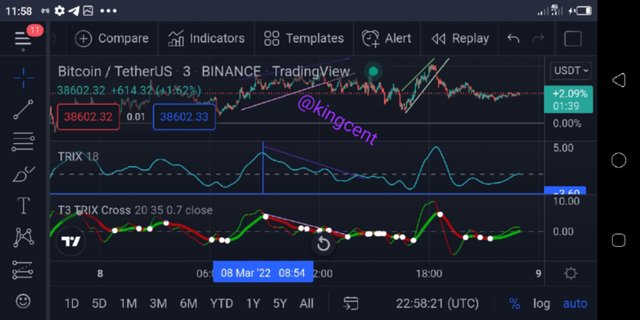
On 8th April 2022 we observed a divergence even when market was going bullish Trix Indicator showing either way this continued for a while untill market continued consolidating and after which there was a breakout to the uptrend.
For a while during the consolidation period Trix failed to go below the zero line to provide a bearish signal, but in general I will say this makes Trix Indicator Strong in such a way that the Overbought and oversold region will be detected and order placed.

Is it necessary to pair another indicator for this indicator to work better as a filter and help eliminate false signals? Give an example (indicator) to support your answer. (screenshot required).
In trading overall false signals are innevitable meaning they must surely occur at some point but the ability to combat then is very important, when you pair two various Indicators there are always advantages which will boil down to excellent signal.
Trix Indicator is a very strong Indicator that one can easily rely on alone to making trading decision's as you may know no Indicator works 100% so for me I think there is every possiblity to pair Trix Indicator to another for effective trading signal.
Talking about confluence trading I will be pairing Trix Indicator with RSI meaning relative strength index, let's watch and see how this will work together to achieve an excellent trading success basically filtering out false Signals.
Always reme that relative strength index RSI measures market Overbought and oversold region in the market by this stren and momentum of trends are put into consideration.
Combining this strong Indicator provides you with strong ambition to the phase of the market, you can easily know when to buy and sell, when the both Indicator are in oversold region trust me they always provide strong buy option.
Whenever you see the both Indicator at the Overbought region trust me it is signalling a reversal from the Overbought region to the oversold region all round.
From the chart uploaded you will clearly see that the both Indicator are at the Overbought region which clearly gives a sell signal.
List the pros and cons of the Trix indicator.
Just as our people usually says anything that has Advantage also has disadvantages too from my explanations from the onset Trix Indicator is a very strong Indicator with lots of potential's.
We tried combining it with other Indicator's the result was pretty much in positive direction, just as the question demands I will list the various prod and cons, watch and see how this one works.
| Pros | Cons |
|---|---|
| This Indicator is a leading Indicator, which determines Overbought and oversold region in the market | Using Trix Indicator alone to detect Signals aren't 100% sure because most times divergence occurs which can lead to looses. |
| It makes us of Triple exponential moving average Calculations, by this market noise are eliminated | when calculations are made using Triple exponential moving average, the signal line croses always differs. |
| Trix Indicator measures bars by so doing signal it provides are always in line courtesy this Trix leads the market | Trix Indicator Calculations using line Chart only shows closing price of an assets not bars. |
| Trix is very good in confluence trading by so doing the noise of false signals are brought to minimal | Combination of various Indicators makers it difficult for a trader to be certain on what Trend is validated. |
Conclusion.
TRIX Indicator is basically used in technical analysis to measure whether Market is in Overbought or oversold region, it comprises of a triple EMA, this Indicator provides divergence and signal Crossovers.
Moving forward I showed how this wonderful Indicator is been Calculated where I stated clearly that EMA18, are for closing price, I also showned how Trix Indicator is been configured,as for the default settings it's very much optional depending on what the trader wants in the market.
Thank you very much professor koub01 for this wonderful lecture delivered by you trust me I really learnt alot, hopefully I keep doing your homework task moving forward.