TRADING USING A WEDGE PATTERN - CRYPTO ACADEMY / S5W5- HOMEWORK POST FOR @sachin08

Hi everyone, I believe you all are doing good today. In the Previous lecture, by @sachin08, we studied about Recognizing patterns in Trading like Triangles, Flags and Rectangles, but In this Lesson, more teachings about Trading using a Wedge Pattern have been explained.
The lesson gave a well detailed explanation of the above topic and I will be giving my answers to the questions asked in the homework task from the lesson by the professor.

1. Explain Wedge Pattern in your own word.
2. Explain both types of Wedges and How to identify them in detail. (Screenshots required)
3. Do the breakout of these Wedge Patterns produce False Signals sometimes? If yes, then Explain how to filter out these False signals.
4. Show full trade setup using this pattern for both types of Wedges.( Entry Point, Take Profit, Stop Loss, Breakout)
5. Conclusion

The wedge pattern is a fundamental technical analysis used by experienced traders for every day trading. In a wedge pattern we tend to discover the formation of a convergence in the price of a crypto trading chart either ascending or descending depending on the current trend of the market.
The wedge pattern is sometimes considered a very tricky kind of pattern in trading, so one must be very careful while making a technical analytic trade decision with the wedge pattern. The top line of the wedge is considered as the resistance while the bottom line of the wedge is regarded as the support line.
The wedge pattern is usually formed after a price contraction occurs in the chart and thereafter a trend reversal is instigated by this contraction either as an uptrend or a downtrend depending on the initial formation of the wedge.
Traders makes use of these trend reversal as an entry point if the market closes up its wedge on a downside but there would be a sell or “take profit” initiated by the traders if the wedge is closed at an upward direction, reason because, by technical analysis, there will be a fall in the price of the crypto asset being traded after a contraction. Below is an illustration of a wedge pattern in trading.
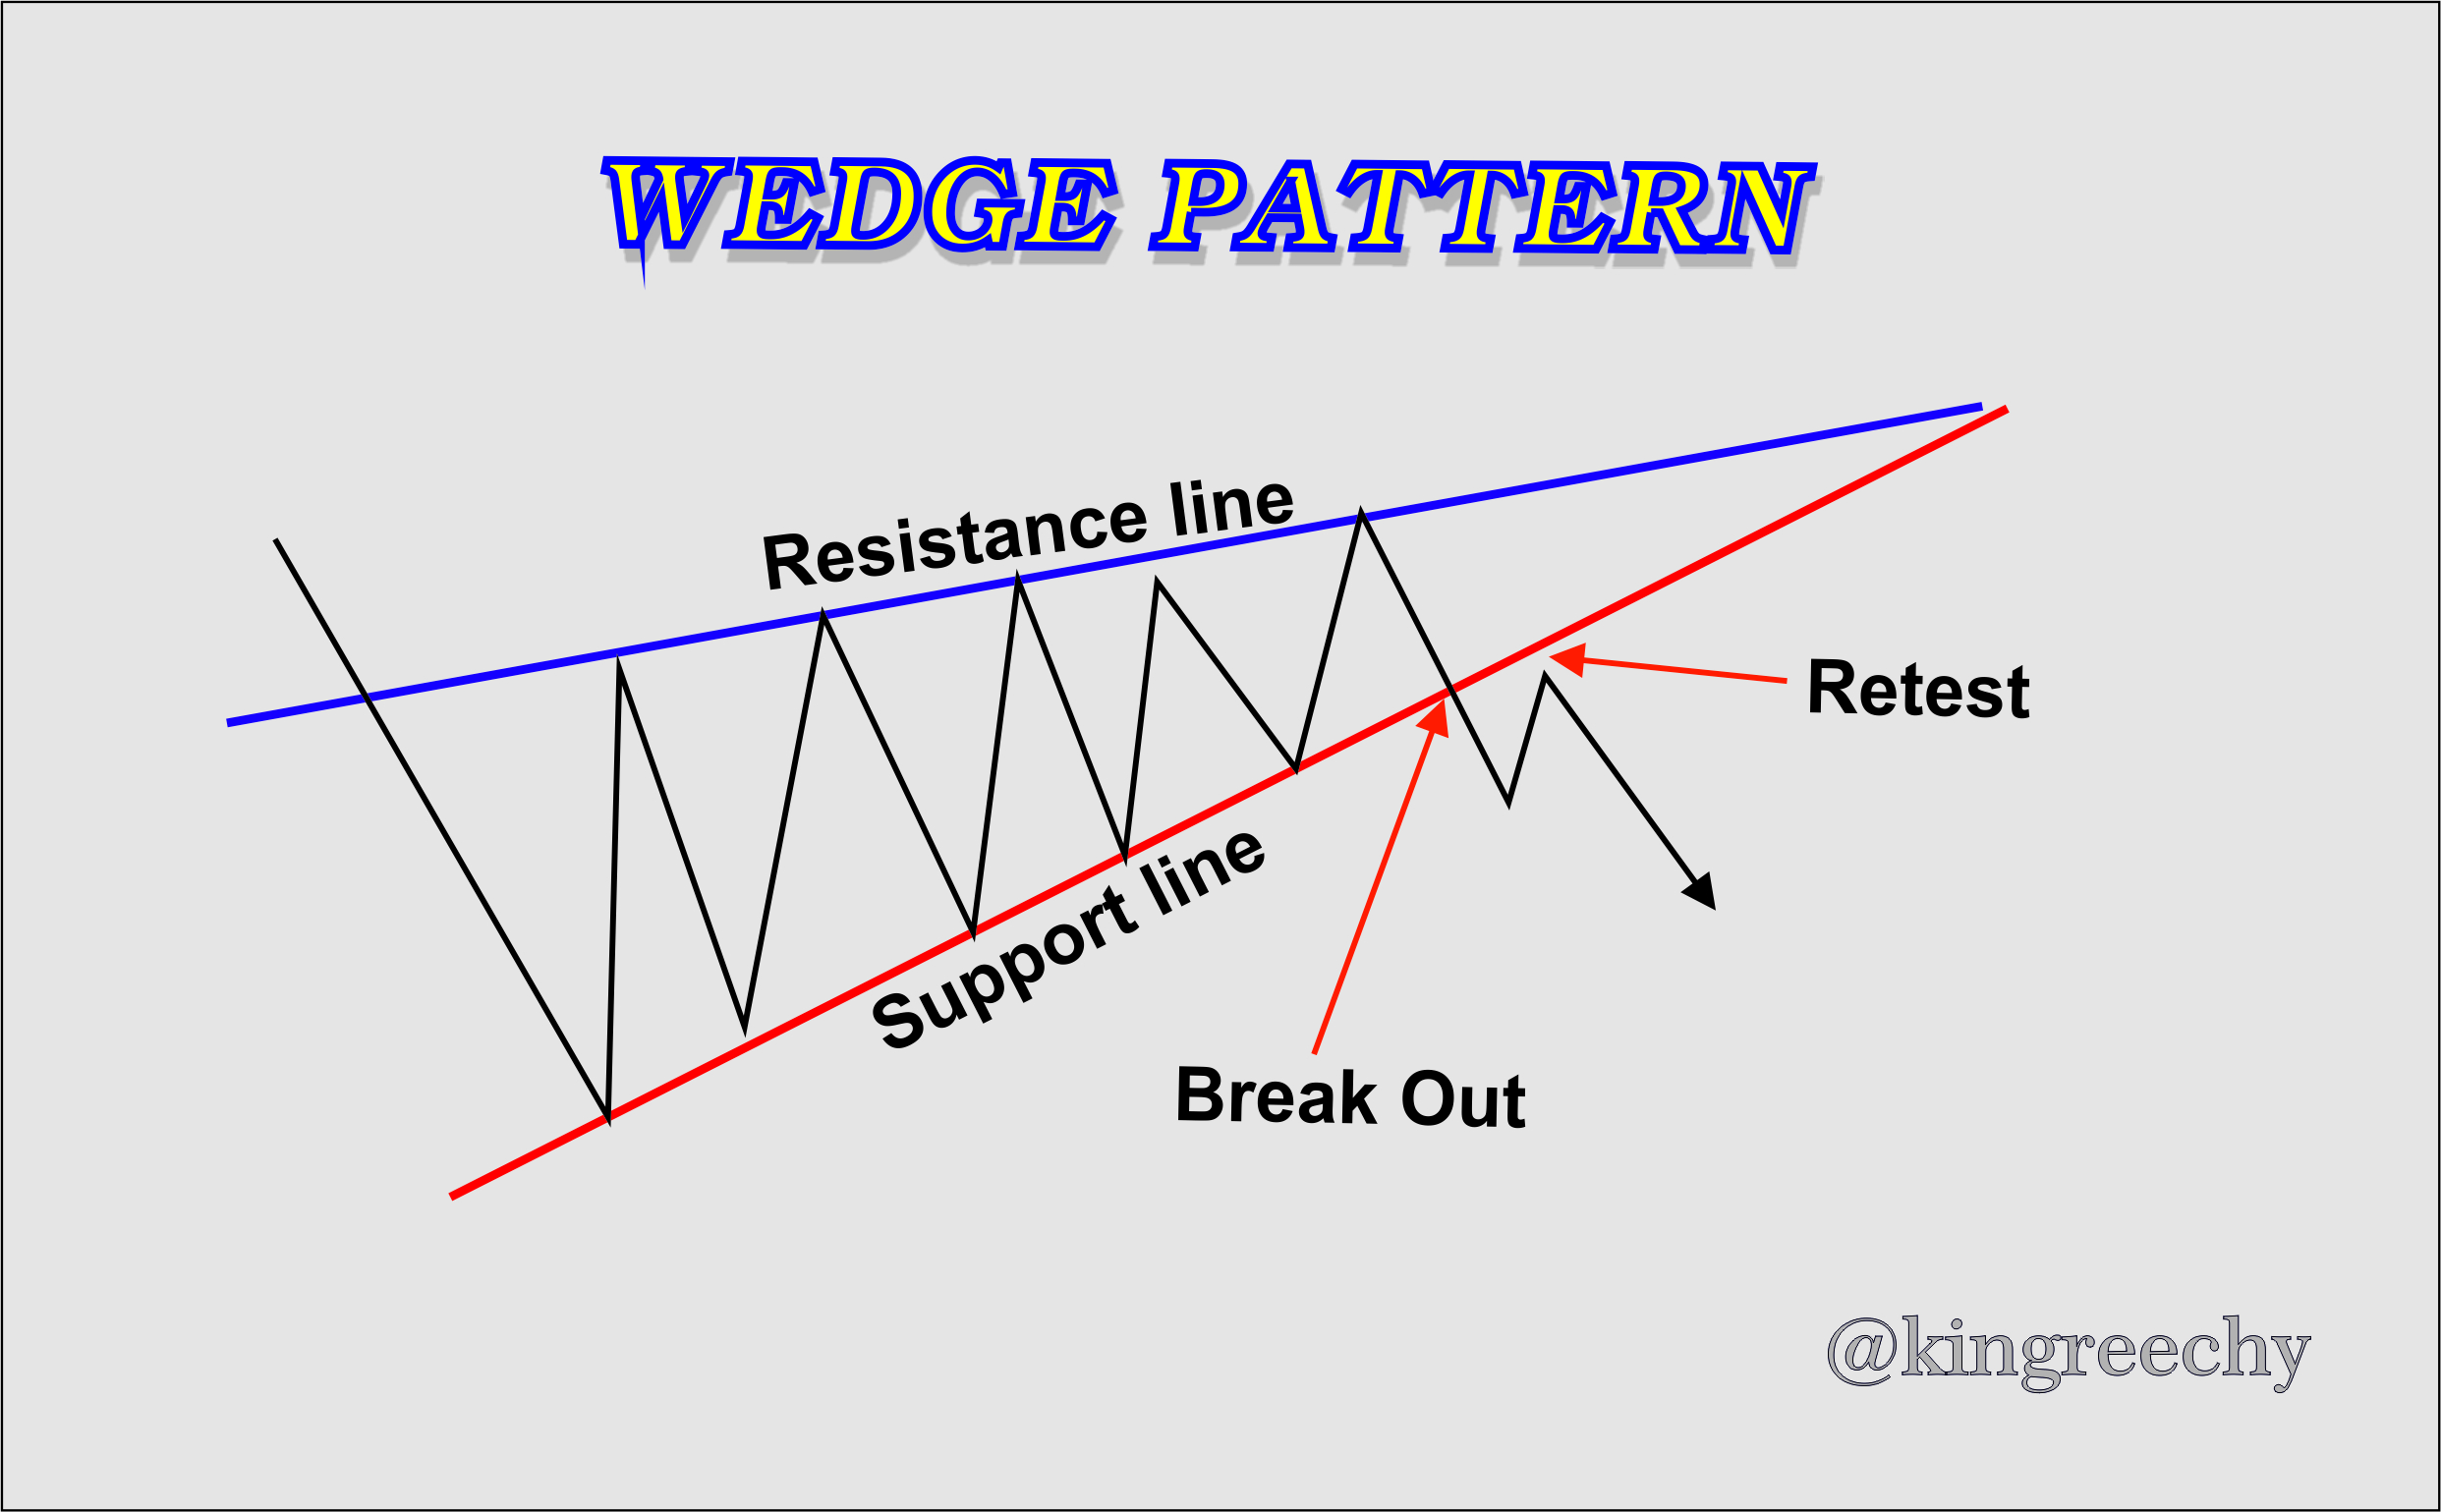
From the above image illustration, we can see a wedge pattern formation and how it is denoted in a crypto price chart. We can observe the resistance line of the wedge and the support. We can also see the break point and also a retest point that failed as price continued in the subsequent trend. There are two types of a wedge pattern;
- Rising Wedge
- Falling Wedge
From the above explanation of the wedge pattern we came to understand that there are two types of Wedge, and will be explaining the both of them starting from the Rising wedge.
RISING WEDGE:
The Rising Wedge is a kind of wedge pattern in a trading that can occur as a result of a trend reversal from an upward price chart or as a result of a trend continuation when a price tried to perform a retracement forming a retest point thereby continuing in the downward trend.
The Rising wedge can also be classified as a bearish version of the wedge pattern and this is because after a rise in the price chart of the market in direction of the wedge, a breakout occurs which leads to a downtrend in the price chart.
In other words a rising wedge is formed after an uptrend and after that comes a trend continuation if the initial trend was a downtrend or a trend reversal will occur if the initial trend was in an upward trend. So after a contraction at the top of the uptrend, the price breakout leading to a bearish trend. Below is an example of a Rising wedge in a crypto chart.
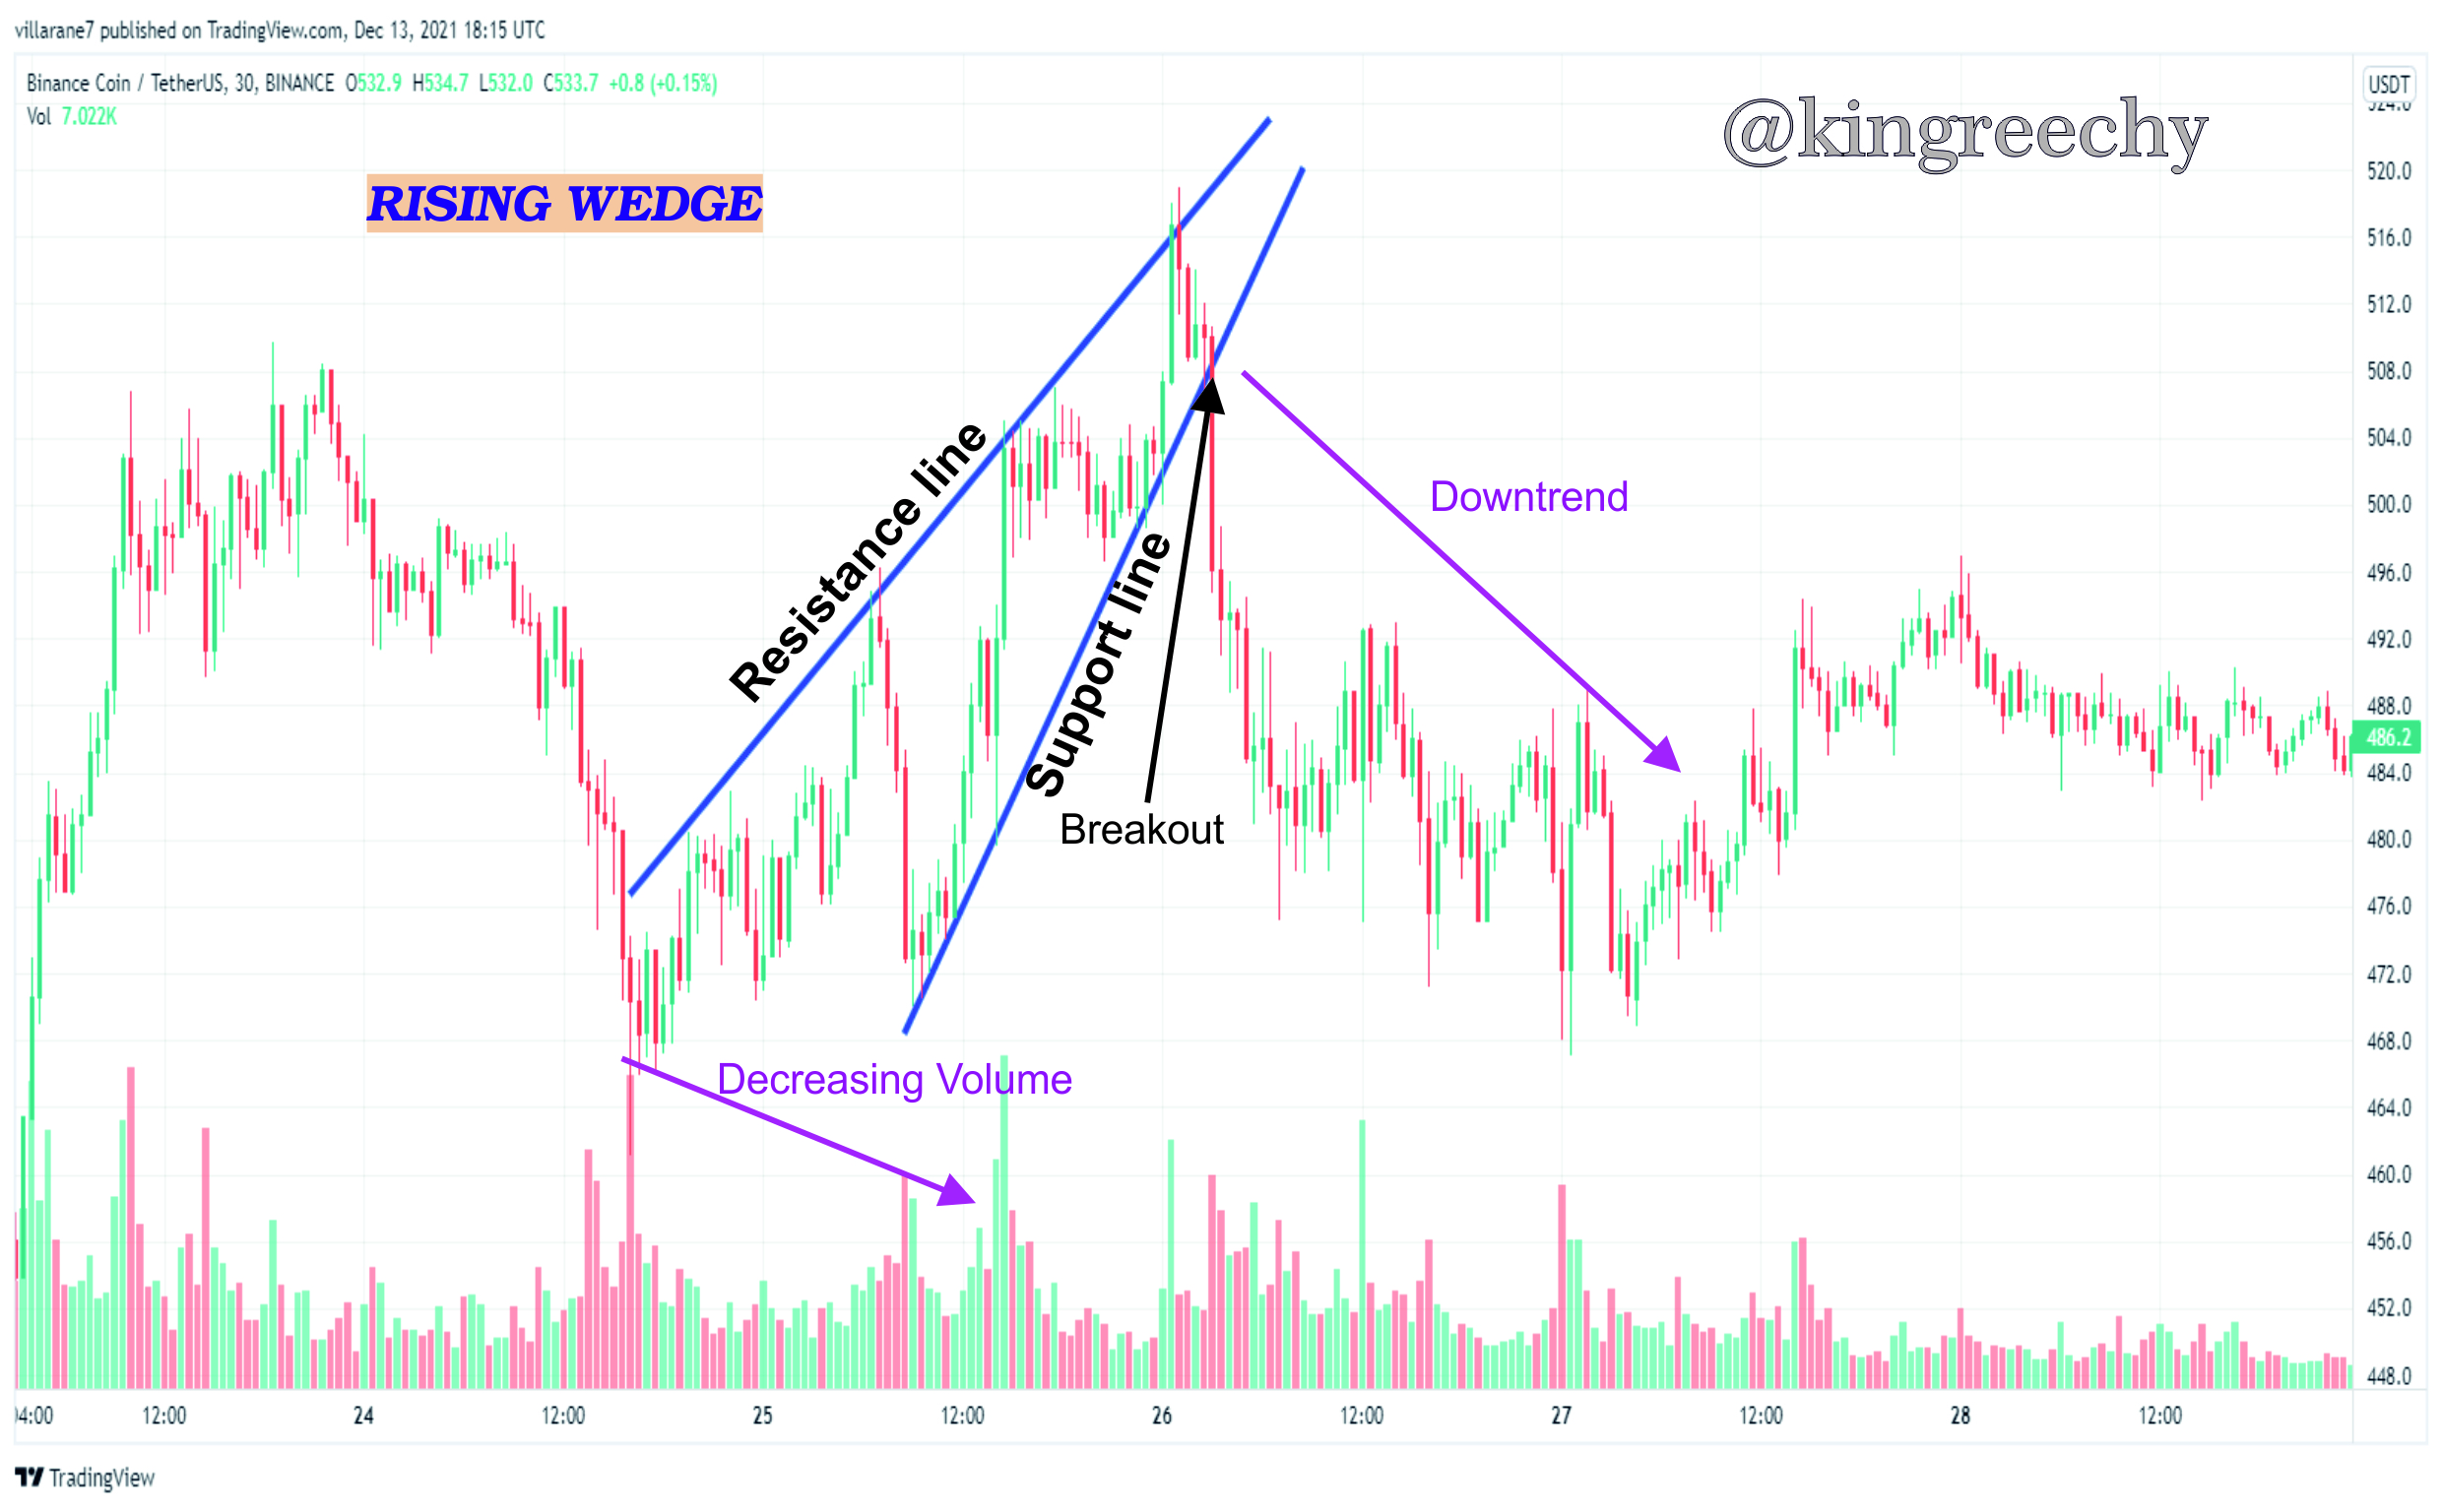
Looking at the above chart we will notice that the price movement was in an upward trend but after creating a wedge formation, according to technical analysis, due to the price contraction at the top, there comes a breakout from the support line as shown above which then leads to a bearish trend. The above process is therefore denoted as a Rising wedge.
HOW TO INDENTIFY A RISING WEDGE:
| Characteristics | Explaination |
|---|---|
| Two Obtuse lines intersecting or showing prospects of intersection. | To get the same wedge pattern, we draw two obtuse lines, the top (or resistance) line will be taken from a minor high while the bottom (or support) line is taken from the minor low to a point where both intersect or show close range of intersection. |
| Multiple touches of price chart. | The candle sticks indicating the price movement must touch both the support & resistance line at least 5 times before a breakout. Three on one line and two on the other to be considered a rising wedge pattern. |
| Volume formation. | The volume of every rising wedge must show a trend in the downward direction in order to be considered a wedge pattern. |
| The breakout volume formation. | The formation of the volume after the breakout must be considerably below an average point of being light or heavy. |
From the above table we should be able to understand how to identify a wedge pattern formation in a crypto price chart and also identify a Rising wedge pattern as explained above.
FALLING WEDGE:
The Falling Wedge is a kind of wedge pattern in a trading that can occur as a result of a trend reversal from an downward price chart coagulation or as a result of a trend continuation when a price tried to perform a retracement by forming downtrend but continues in the upward trend which was it’s initial trend.
The falling wedge can also be classified as a bullish version of the wedge pattern and this is because after a fall in the price chart of the market in direction of the wedge, a breakout occurs which leads to a uptrend in the price chart of the market.
In other words a falling wedge is formed after a downward, so after that can come a trend continuation if the initial trend was an uptrend or a trend reversal will occur if the initial trend was in an downward trend. So after a contraction at the bottom of the downtrend, the price breakout fro the resistance line leading to a bullish trend. Below is an example of a falling wedge in a crypto market.
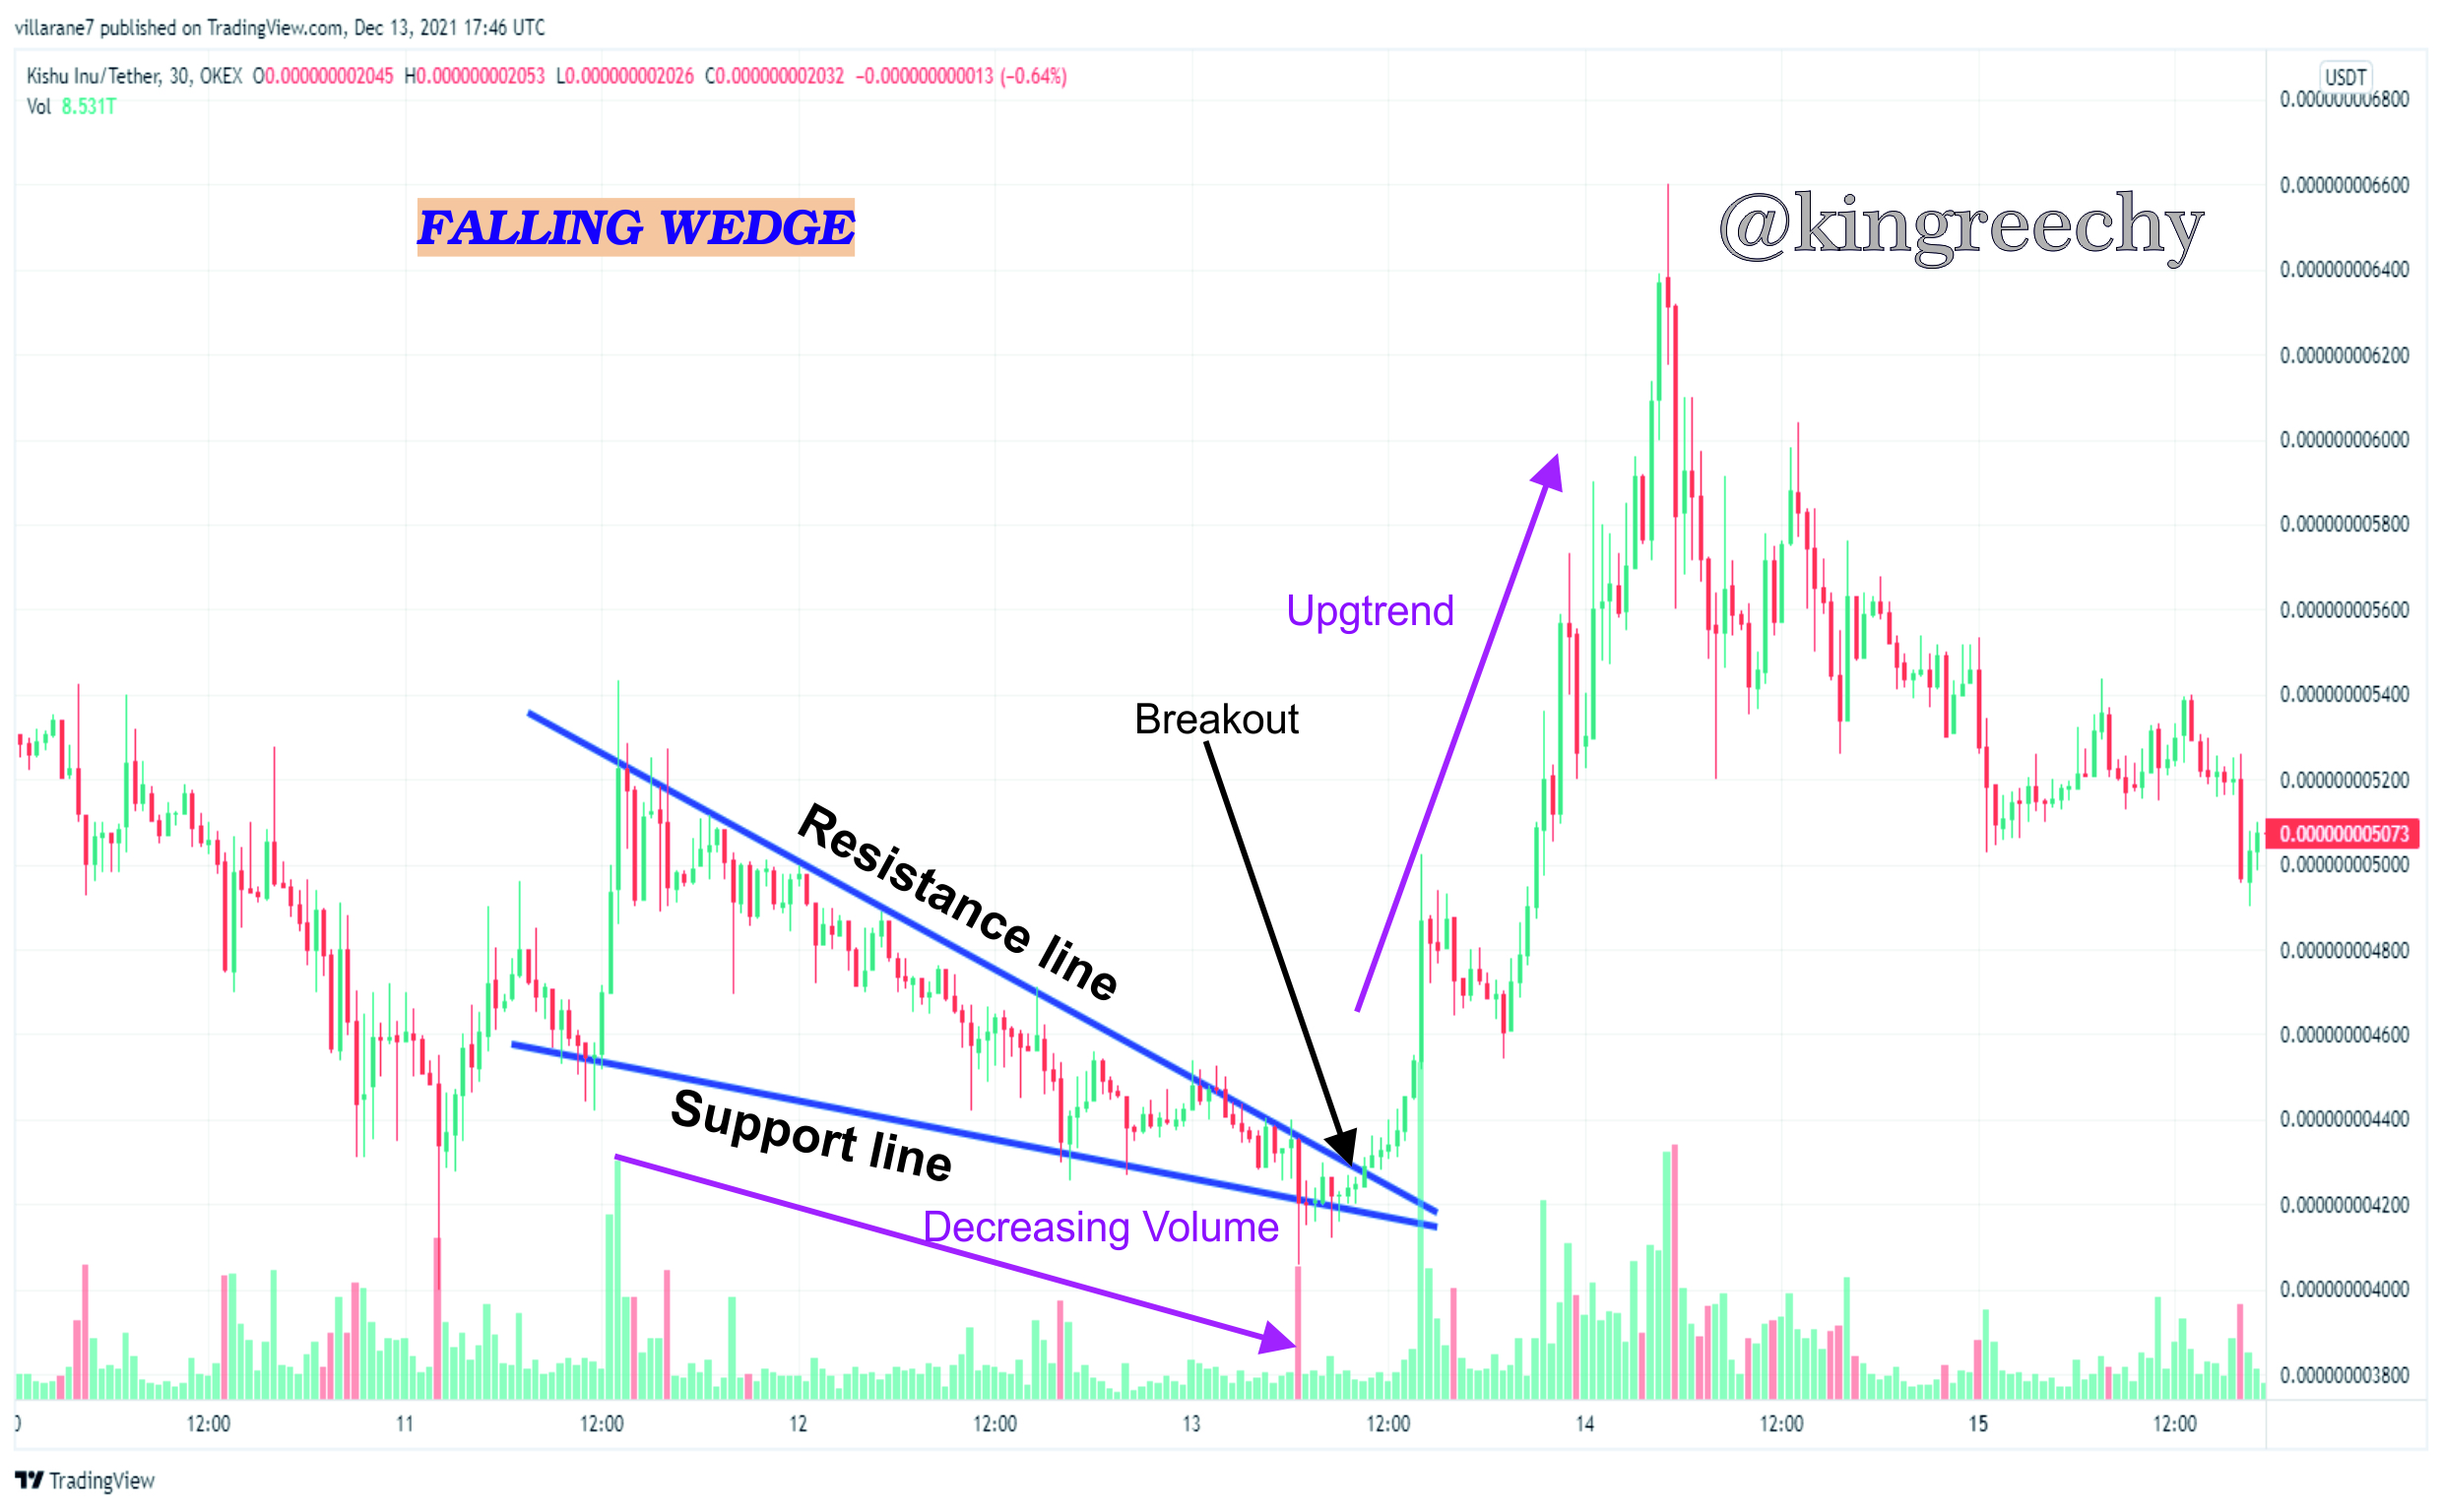
Looking at the above chart we will notice that the price movement was in an downward trend but after creating a wedge formation, according to technical analysis, due to the price contraction at the bottom, there comes a breakout from the resistance line as shown above which then leads to a bullish trend. The above process is there classified as a falling wedge.
HOW TO INDENTIFY A FALLING WEDGE:
| Characteristics | Explaination |
|---|---|
| Two Obtuse lines intersecting or showing prospects of intersection. | To get the same wedge pattern, we draw two obtuse lines from the fall of the price chart, the top (or resistance) line will be taken from a lower high while the bottom (or support) line is taken from the lower low to a point where both intersect or show close range of intersection. |
| Multiple touches of price chart. | The candle sticks indicating the price movement must touch both the support & resistance line at least 5 times before a breakout. There should be three and two touches either above or beneath the lines. |
| Volume formation. | The volume of every falling wedge must show a trend in the downward direction in order to be considered a wedge pattern. |
| The breakout volume formation. | The formation of the volume after the breakout is quite noticeable due to the uptrend of the candle sticks. |
Often times there are breakouts of the wedge pattern that gives forth a false signal. Sometimes we see the formation of the wedge pattern in a bullish trend thereby judging from the technical analysis of the wedge pattern we are supposed to experience an downward trend in the price chart but the reverse is the case and this is as a result of the buyers being able to push the market further above the analysis of the traders.
This occurrence sometimes can be in the favor of few traders while others traders get thrown off balance due to the false signal analysis from the chart. Below is a typical example of a supposed Rising Wedge Pattern:
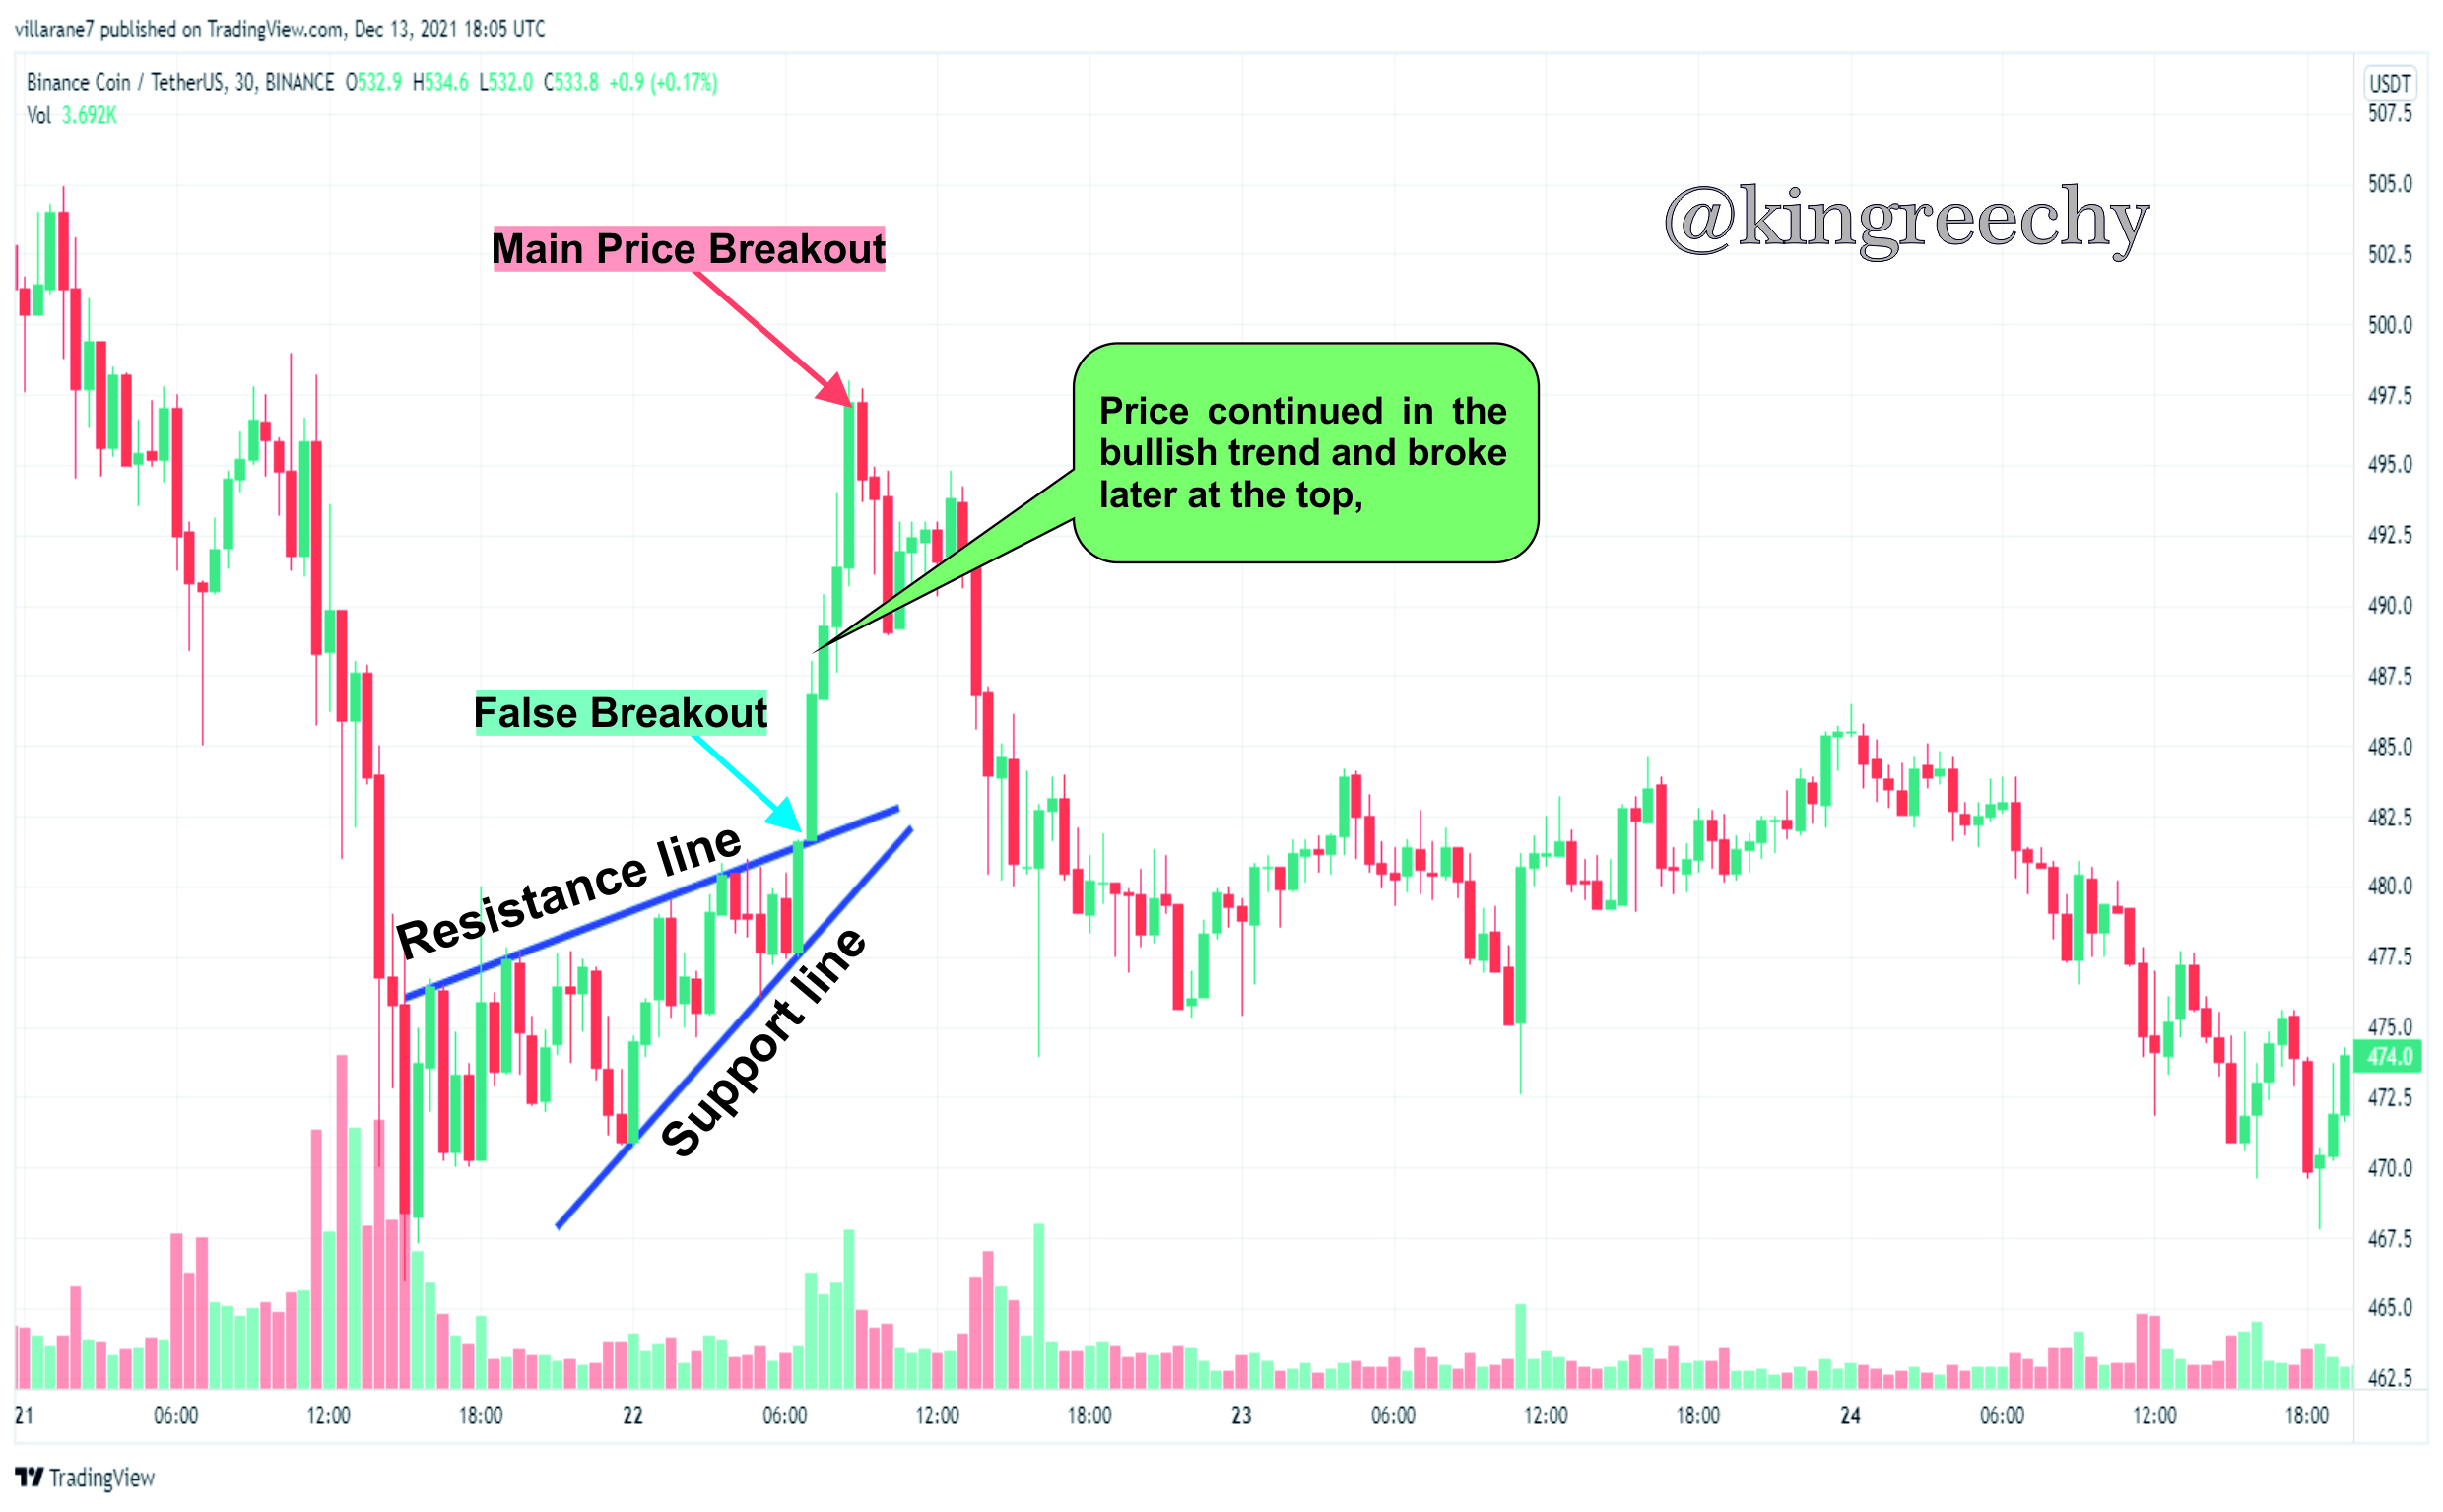
Notice how the price continued in an upward trend even after properly drawing the Rising Wedge pattern as the price contracted at a point at the end of the wedge, this shows that the supposed break point was a false break point as indicated on the image above. sometimes in trading moments like this are unavoidable but with time and experience one can learn how to stay in line with the market movement.
TRADE SETUP FOR RISING WEDGE:
The trade Setup is the most important and practical part of this lesson as it shows us practically how to fully perform a well organized trade for a maximum result in Trading. It can be somewhat tough in making a well organized trade setup for a rising wedge pattern because of its rarity nevertheless, I will be showing my example by using the Rising Wedge of
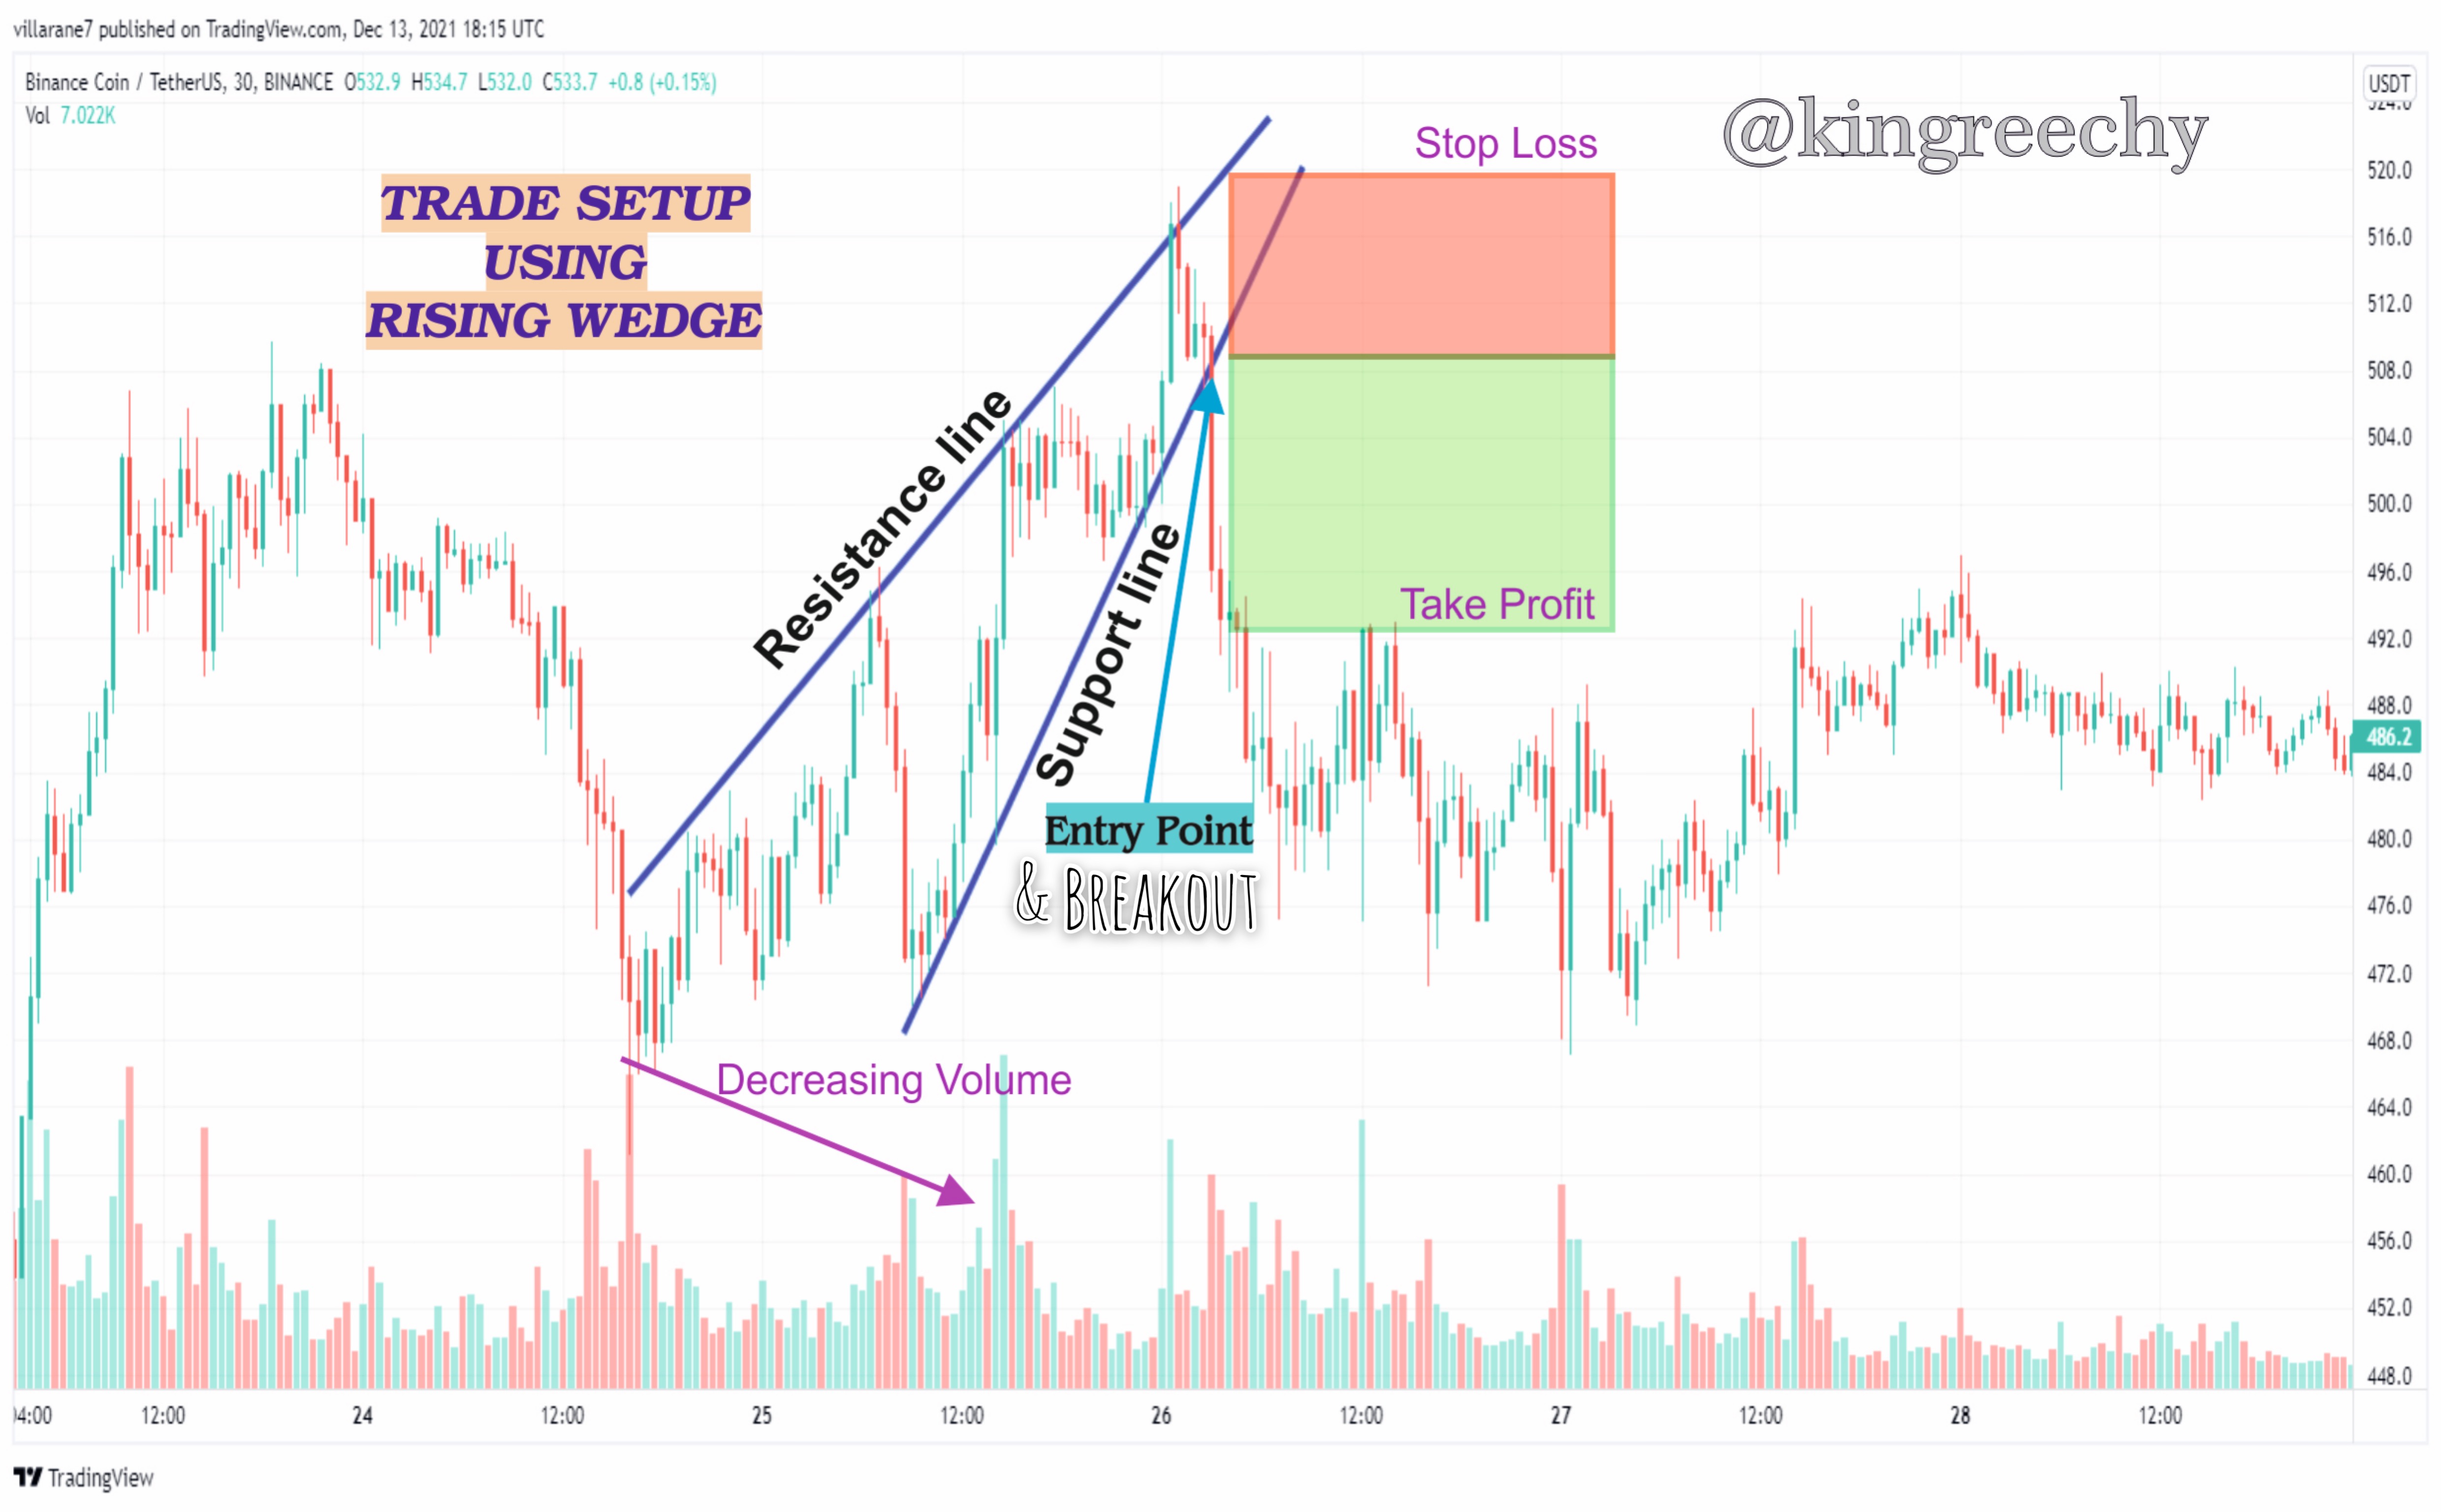
From the image screenshot above we can notice how the candle stick price chart touches the Resistance and support line of of the Rising wedge, we can also notice how the price comes to a contraction at the end of the wedge and breaks out just at the support line. That breakout point becomes our entry point and after that we can mark the take profit point and stop loss point above the tip of the edge or above the Resistance line
TRADE SETUP FOR FALLING WEDGE:
Falling wedges as described above, can also be referred to as the bullish version of the wedge, this pattern brings about an uptrend in the price chart after the formation of the obtuse like wedge. Below is a chart to describe the trade setup for the falling wedge.
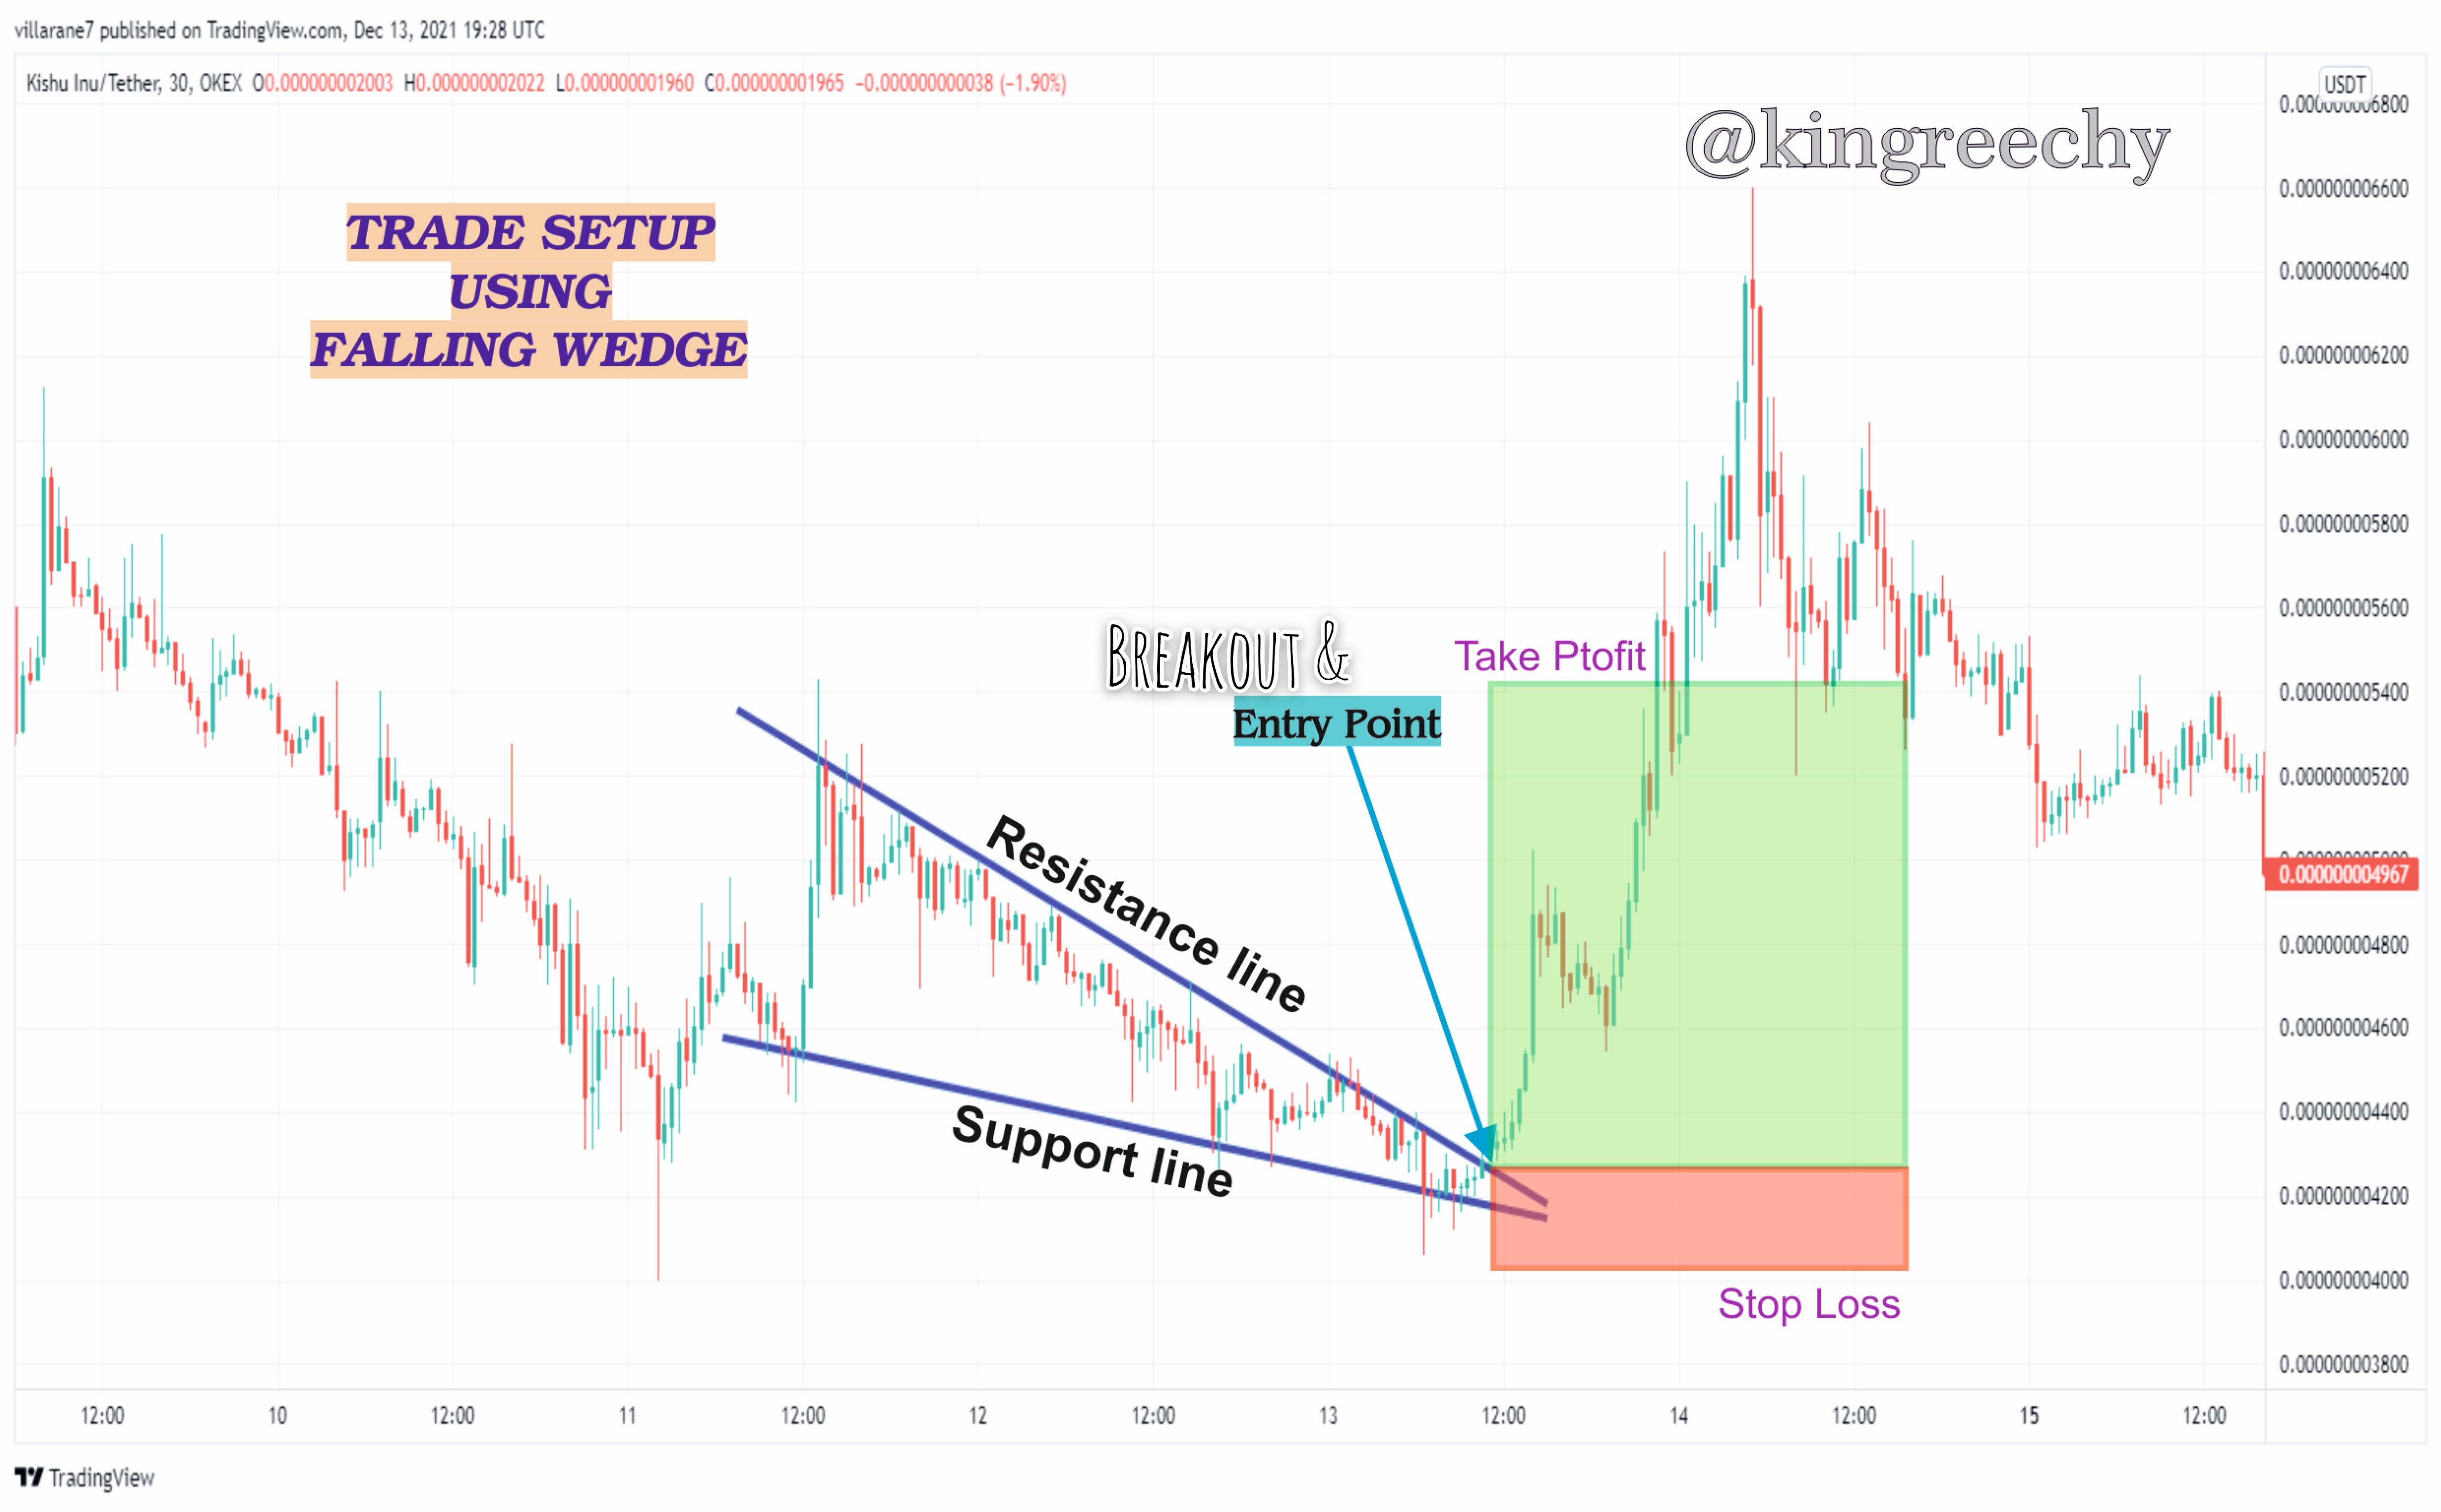
From the image screenshot above we can notice how the candle stick price chart touches the Resistance and support line of of the falling wedge, we can also notice how the price comes to a contraction at the end of the wedge and breaks out just at the support line. That breakout point becomes our entry point and after that we can mark the take profit point and stop loss point above the tip of the edge or above the Resistance line

This amazing lecture from professor @sachin08 have really been of greet impact to me. It has taught me lot about understanding trade and trade setup using the wedge pattern technical analysis. It is always a wonderful time studying and applying all that has been learnt in your lesson. I look forward to your next lecture sir.
Thanks for reading.
All screenshots were gotten from Tradingview.com and were edited by me on corel draw
@tipu curate
Upvoted 👌 (Mana: 3/7) Get profit votes with @tipU :)