Crypto Academy|Season 3 ||week 6- Homework task for @cryptokraze
Hello everyone, i am glad to be part of this week's homework task. I want to specially thank @cryptokraze for this detailed lecture. I will go ahead and attempt the homework task.
1. What is your understanding of the Liquidity Level. Give Examples.
Liquidity has to do with how quickly assets can be changed into cash and at the same time not loss value. These assets (stock, cryptocurrency, bond etc) could be bought or sold for long or short term investment purposes. With the understanding of Liquidity, individuals and businesses can project trends in the finance and economy sector. Now, lets look at Liquidity level.
Liquidity Levels are very important on a price chart, there is the high and low liquidity levels which shows the market's reaction (upwards or downwards movement) and enable traders make a decision on trading. The liquidity levels can be seen close to the support and resistance area, This helps in managing open trades, starting a new trade or adjusting the stop loss of a trade.
Big traders normally use the liquidity levels to their advantage in the sense that they aim at using the less volatility of the market price to achieve the best average price for their entire trade and also reduce the risk of slippage.
Example.
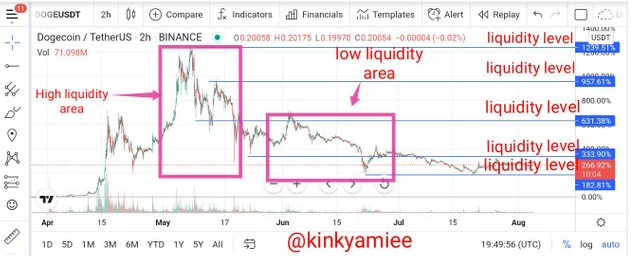
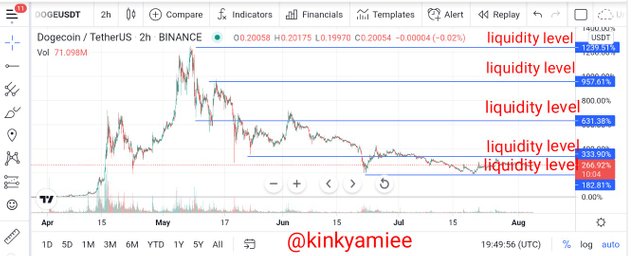
Now lets take a look at the DOGEUSDT pair daily chart on the liquidity level of the market. This chart is trying to explain that when the selling period is at its peak and when its in its low period, in other words, when its a good day to sell or buy, or when there is an in flow of cash or its time for a cash-out in the market.
We see that on the 16th of May, the liquidity level was at its high point meaning that its a good day for a trader to sell his asset and cash-out with out any loss of cash or loss of value of the asset. However, on the 18th, we saw a reversal in the market, as the liquidity level became low. At this point, the trader can buy asset thereby initiating cash flow in to the market.
So from the example, we have just seen how liquidity level influence the trading system that is, the buying and selling of assets and at the same time influence the cash flow and cash out in the market.
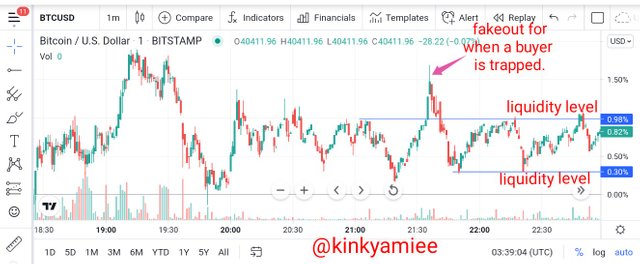
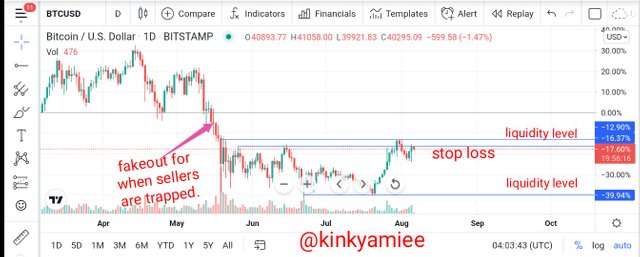
2. Explain the reasons why traders got trapped in Fakeouts. Provide at least two charts to show clear fakeouts.
Fakeouts happens when a big Financial institutions manipulates the liquidity level of price or market in order to take out the stop losses of retail traders and at the same time make more profit for themselves. These usually occurs above or below the liquidity levels where these retail traders must have placed their stop losses.
How Retail Traders Get Trapped
First of all, these big Financial Institutions have their reasons for causing fakeouts which are making profits for themselves and taking out the stop loss of retail traders so as to trap them. However, they trap the retail traders by increasing the volume of the market so as to break prices at those levels they know the retail traders must have placed their stop losses, making them think the price that has broken at that level will keep moving at that same direction not knowing the price movement is taking out their stop losses.
Now, when this big traders hit the resistance or support levels, they increase the volume of the market again causing a reversal that is, in the opposite direction which makes the price fall back to its original level, giving the retail traders false hope and trapping them in their order that they thought will move towards their liquidity level, not knowing those Financial institutions have already made their profits.
When Sellers are trapped
When buyers are trapped
3. How can you trade the liquidity levels the right way? Write the trade criteria for Liquidity Levels Trading. (Clear Charts Needed).
There are two best ways to trade the liquidity levels and not get trapped in a fakeout. Firstly, It is very important to analyse the liquidity level and secondly, using the two market strategies known as the Market Structure Break and the Break Retest Break. Now, for a trader to be able to enter a buy trade or sell trade after liquidity level, the trader needs to confirm a trend reversal or allow the price to break the liquidity level and continue its movement. So i am going to show illustration below.
Market Structure Break (MSB)
To be able to trade the liquidity levels the right way, we have to confirm a trend reversal. The following are the criteria for confirming the trend reversal.
After Price must have created a fakeout by touching the liquidity level and bouncing back in the opposite direction.
There will be a higher low formed if the trend is moving downwards or a lower low formed if the trend is moving upwards after the bounce off.
So whichever trend is formed, we will be drawing our market structure neckline at that point so as to identify the change of the confirmation trend.
**Criteria For Entry and Exit Trade.
Having confirmed the trend reversal, the criteria listed below will assure a good entry and exit trade.
Once the price movement breaks the market structure neckline, we can find an entry point for trading.
Following that, we have to set two exit point for our trade which is the Stoploss and the Take-Profit.
The Stoploss should be marked in the opposite direction of the trend (above or below the liquidity level) so as to ensure that there wouldnt be continuous loss if eventually price continues in its previous direction.
The take-profit ensures that profits generated from the price movement is secured and as such the ratio of reward to risk should be set at 1:1.
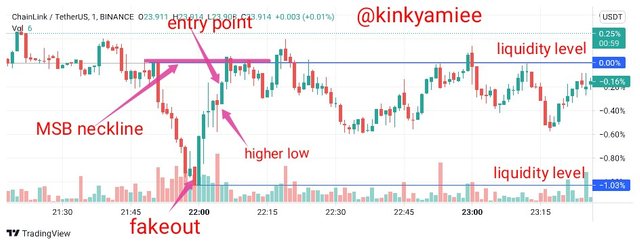
LINk/USDT chart
Break Retest Break (BRB)
In this case, the price movement is allowed to break the liquidity level and continue with the trend. Below are the criteria for that would enable us confirm.
After the breakout done by the price movement through the liquidity level, there is a new resistance or support level created, this shows the readiness of the price to continue in its current direction.
As the price continues in that direction, it should retest and continue with that same trend.
Finally, an entry or exit point can be marked above or below the new trend after the break.
Criteria For Entry and Exit Points.
Immediately after the break at the point where the new trend is formed, we can place our entry point for trade.
Following that, we have to set two exit point for our trade which is the Stoploss and the Take-Profit.
The Stoploss should be marked in the opposite direction of the trend (above or below the liquidity level) so as to ensure that there wouldnt be continuous loss if eventually price continues in its previous direction.
The take-profit ensures that profits generated from the price movement is secured and as such the ratio of reward to risk should be set at 1:1.
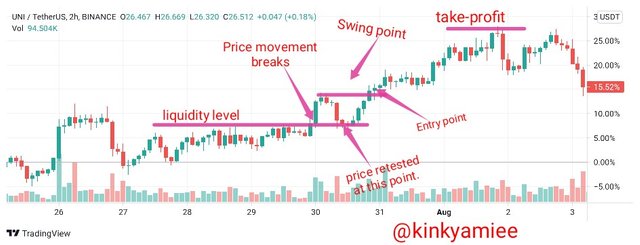
UNI/USDT Chart
4. Draw Liquidity Levels of trade setups on 4 Crypto Assets.
In this task, i will using both the Market Strategy Break and the Break Retest Break strategy to show the Liquidity level of trade for the 4 crypto Assets.
Chart 1: Using MSB setup for LTC/USD Buy Setup
The MSB setup was used to trade around the liquidity level.
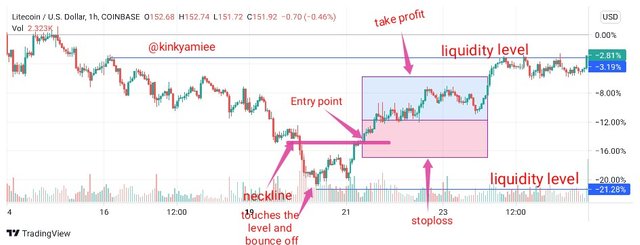
Chart 2: Using MSB strategy for sell setup.
The chart below shows the Sell Setup for TRX/USDT using the MSB strategy to trade the liquidity level.
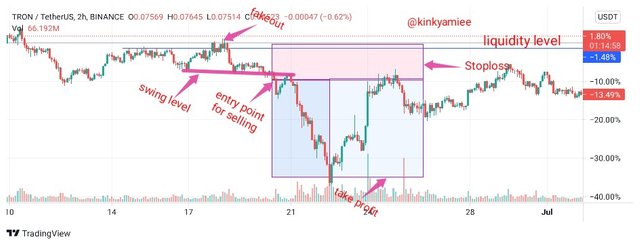
Chart 3: Using BRB strategy for Buy setup.
The chart below shows the Buy Setup for AXS/USD using BRB strategy.
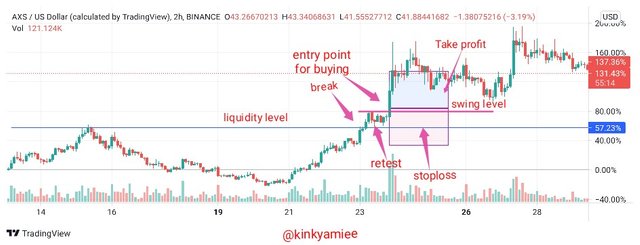
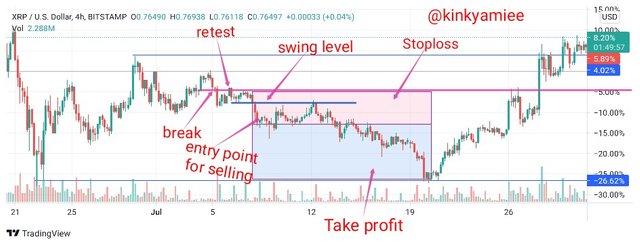
Chart 4: Using BRB strategy for Sell Setup.
The chart below shows the Sell Setup for XRP/USD pair using BRB strategy.
Thanks for reading.
This post has been rewarded by @bright-obias from @steemcurator04 Account with support from the Steem Community Curation Project."
Keep posting good content and follow @steemitblog for more updates. Thank you.