Crypto Academy Season 4 [ Advanced course ] week 6: Crypto Trading With Chaikin Money Flow Indicator
Continuing the series of introductory articles on indicators used in cryptocurrency trading, this time will be a volume indicator which is considered to be the best in the system of all volume indicators available in the market today Chaikin Money Flow (CMF)
Why is this important? Because a change in the movement of flows in a certain direction anticipates that of prices, and can therefore help the trader to apprehend trend reversals more quickly.
Let's follow the characteristics of this indicator as well as how to exchange it in the article below.

Before we start diving into the Chaikin Money Flow indicator, we want you to understand the volume of cash(money)flow, a concept that is directly related to this indicator.
Cash flow volume is the amount of money traded on assets (buying and selling) during a given time period. Specifically, the volume of cash flow shows how much money has been poured into the market over a certain period of time.
The volume of cash flow shows investor interest in asset trading. A large volume of cash flow shows that investors are very interested in the asset, on the contrary, when investors are less interested or hesitate between decisions, the volume of cash flow decreases.
The role of the study of cash flow volume in crypto trading:
Measuring the volume of cash flow will help traders determine the momentum of the current trend, thus predicting the next trend movement in the near future.
The volume of cash flow determines the strength of the trend.
The volume of cash flow measures the liquidity of the market.

This technical indicator was developed by Marc Chaikin, the Chaikin Money Flow is calculated from the Accumulation / Distribution indicator.
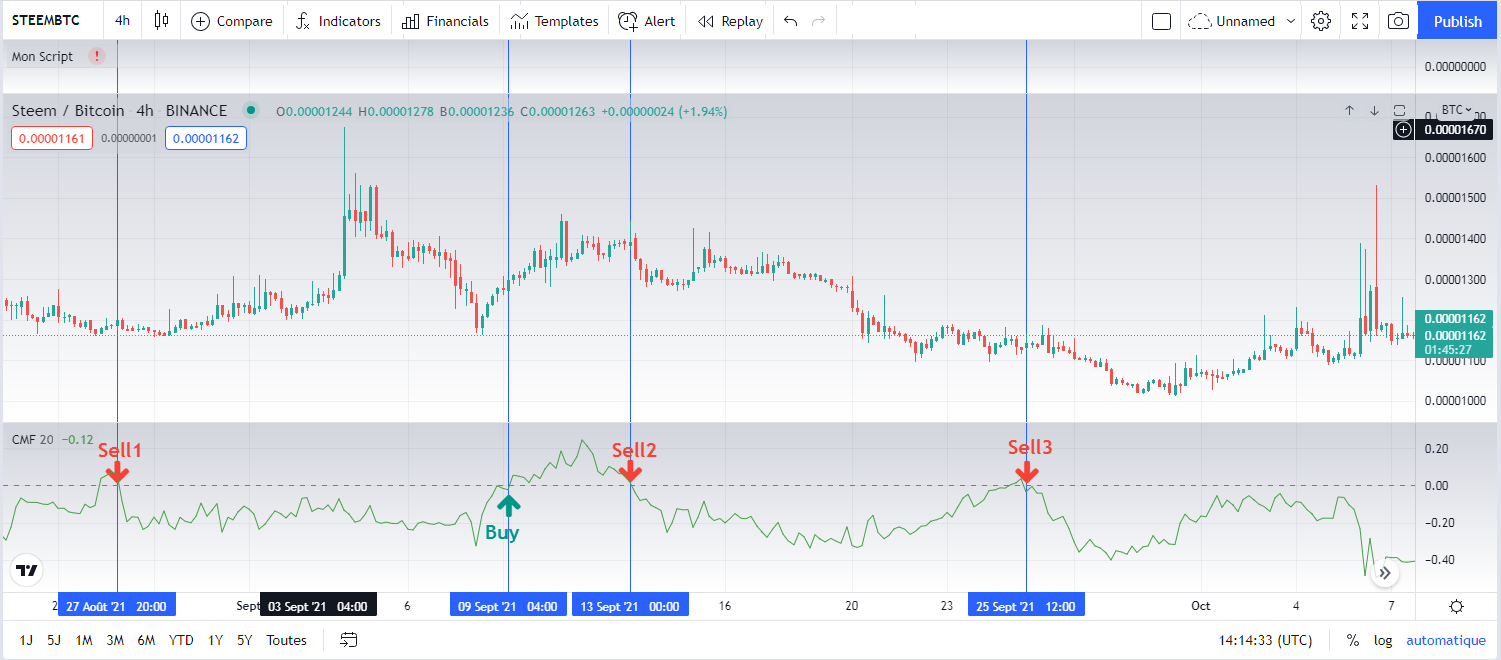
The Chaikin Money Flow is a technical analysis indicator that measures the buying or selling pressure of a security over a given period.
This stock market pressure also called "volume of cash flow" is a concept created by Marc Chaikin, it allows you to measure the pressure to buy and sell a crypto pair for a single period.
The Chaikin Money Flow is based on the assumption that a market's strength is usually accompanied by prices that close on the high half of their daily range and on rising volumes.
Symmetrically, market weakness is usually accompanied by prices closing on the lower half of their daily range on rising volumes.
If prices close on the upper half of their daily range on rising volumes then the indicator will give a positive value, this indicates that the market is strong.
Conversely, if prices close on their lower half of the daily range on rising volumes, then the indicator will give a negative value, indicating that the market is weak.

The Chaikin Money Flow technical indicator is presented as a volume-weighted average of accumulation (uptrend) and distribution (downtrend) over a period determined by traders.
We mainly use the following formula to determine its value:
Money Flow = [Sum over period (((Closing price - Low price) - (High price - Closing price)) / (High price - Low price) x Volume)] / (Total volume over the period)
There is an alternative method to calculate the Chaikin Money Flow technical indicator then comprising 3 distinct steps generally based on a periodicity of 20 or 21:
Calculating the cash flow multiplier:
Cash Flow Multiplier = [(Close - Low) - (High - Close)] / (High - Low)
Calculation of the volume of cash flows:
Cash flow volume = cash flow multiplier x volume for the period
Calculation of Chakin Money Flow:
Chaikin Money Flow = sum of 21/20 periods of cash flow volume / sum of 21/20 periods of volume

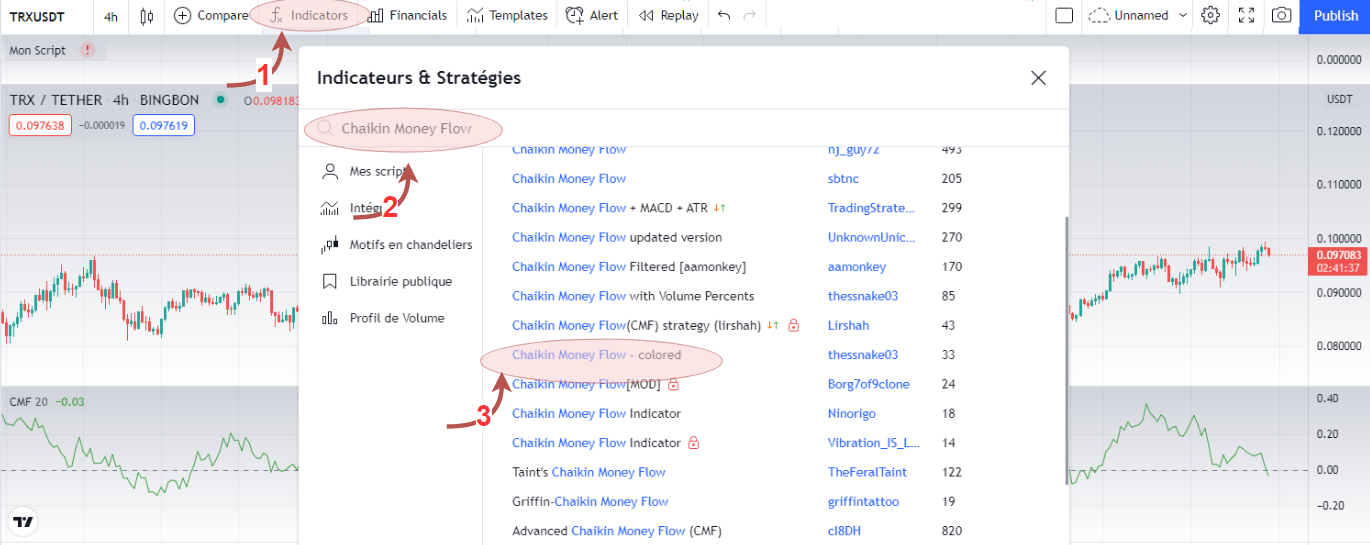
To insert the CMF indicator into the chart, please follow the following link: Insert ? Indicators ?Custom ? Chaikin Money Flow Indicator, as shown below:
1 - Select the "fx Indicators" button
2 - Type chaikin in the search field
3 - Then choose "Chaikin Money Flow colored" if you want the areas be colored. Otherwise, simply choose "Chaikin Money Flow" .
- To configure it:
It will appear below the price chart. To see the custom window click on the corresponding Settings icon (highlighted with the arrow shown in the screenshot below).
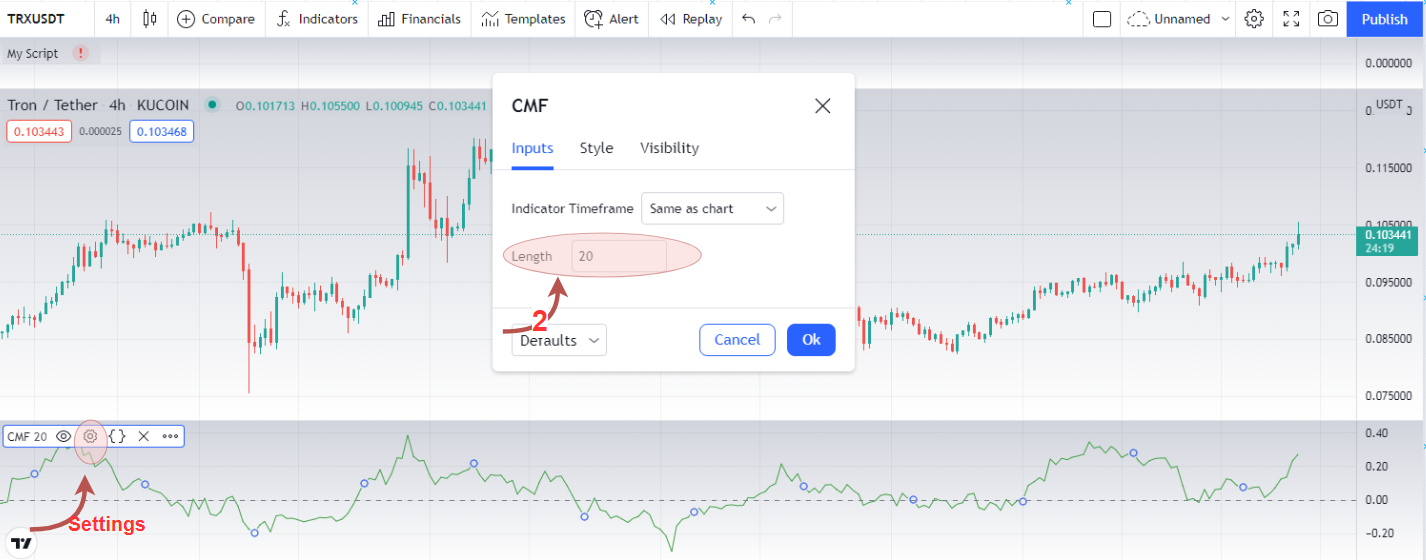
The indicator should ideally be used to cover a period relevant to your trading period.
The period generally used for the Chaikin Money Flow is 21 days. However, any look back period can be used, but the settings most used by traders are 20 or 21 days, this will not be optimal for day traders who wish to trade on the chart in 5 minute data. .
Indeed, for traders wishing to use a 5 minute chart, it is advisable to use a Chaikin Money flow of 36 periods in order to study the trend of the previous three hours.
In this case, a 24-period Chaikin Money flow will allow you to study the trend of the past day (for 24/5 markets), and a CMF of 120 periods will allow you to study the trend over the past week.
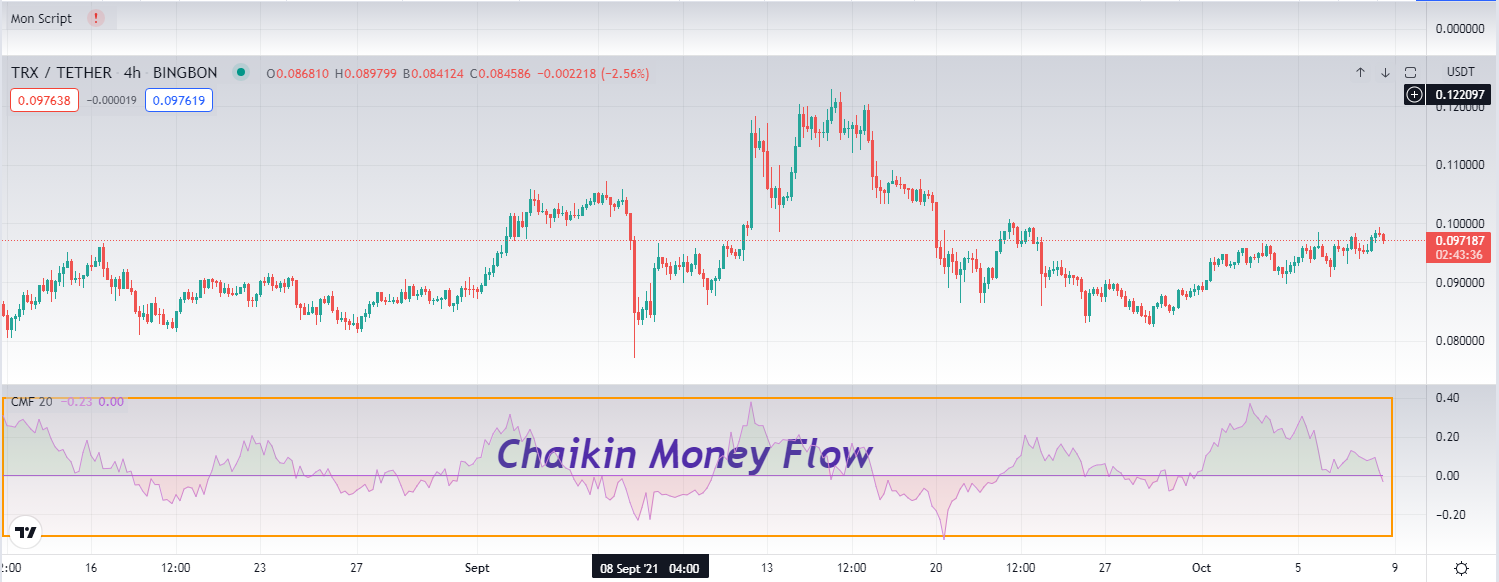
As shown in the chart below, the Chaikin Money Flow is displayed as a oscillator around a 0 line, with regions representing buy pressure (green) and regions representing sell pressure (red).

Chaikin Money Flow measures the buying and selling pressure over a given period of time.
A movement in the positive zone of the indicator shows buying pressure, while a movement in negative territory indicates selling pressure.
Investors can use the absolute value of the Chaikin Money Flow to confirm or question the price action of the underlying.
When the Chaikin is positive it would confirm an uptrend, but if it is negative it would question the force behind an uptrend. The opposite is true for downtrends.

The Chaikin Money Flow indicator is based on the following principle, namely that the closer the closing price is to the higher, the more accumulation has taken place.
Conversely, the closer the closing price is to the low, the more the distribution has taken place.
If the price of a security regularly closes near their highest (buying pressure) the Chaikin Money Flow will be positive.
Conversely, the price of a security regularly closes near its lowest (selling pressure), the Chaikin Money Flow will be a negative value.
Usually, the Chaikin Money Flow gives a bullish signal when it turns positive and becomes bearish when it turns negative.

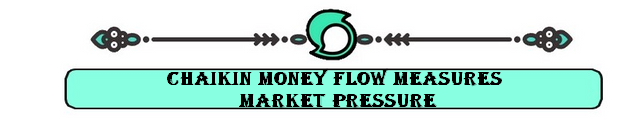
We can trade with a signal of a crossover between CMF and wider lines like +/- 0.1 or +/- 0.15 or it can also be +/-0.2, depending on the volatility of the market that you choose these lines accordingly. The wider the center area, the less interfering signal, but the "rare" frequency of occurrence of signals that cross those lines.
A special thing is that this strategy does not need to satisfy the condition of trading in favor of the trend. Since CMF increases one circuit from the bottom up or decreases one circuit from the top indicates a large flow of money, the market is accumulating to push the price up or distributing to pull the price down, starting a new trend.
Let's say you use the crossover signal between the CMF line and the +/-0.1 line. The way to enter the command is as follows:
Enter a Buy order when the CMF line crosses the 0.1 line from below the -0.1 line going up.
Enter a Sell order when the CMF line crosses the -0.1 line from above the 0.1 line going down.
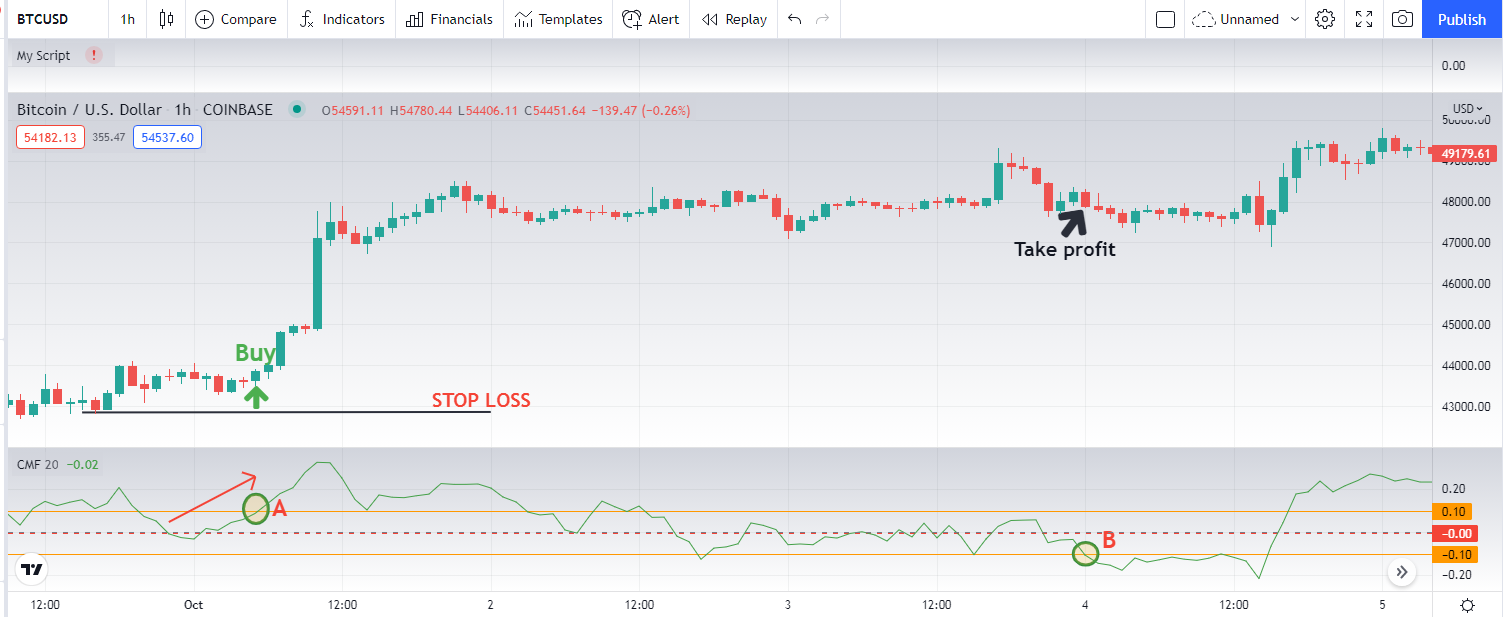
At position A, the CMF line increased sharply from below the 0 line to above and crossed to the 0.1 line. You can enter an order as soon as the CMF line has just crossed above the 0.1 line.
Place a stop loss one block away from the previous last low. Close the take profit order when the CMF line reverses sharply from above 0.1 to cut below the -0.1 line, at position B in the figure.
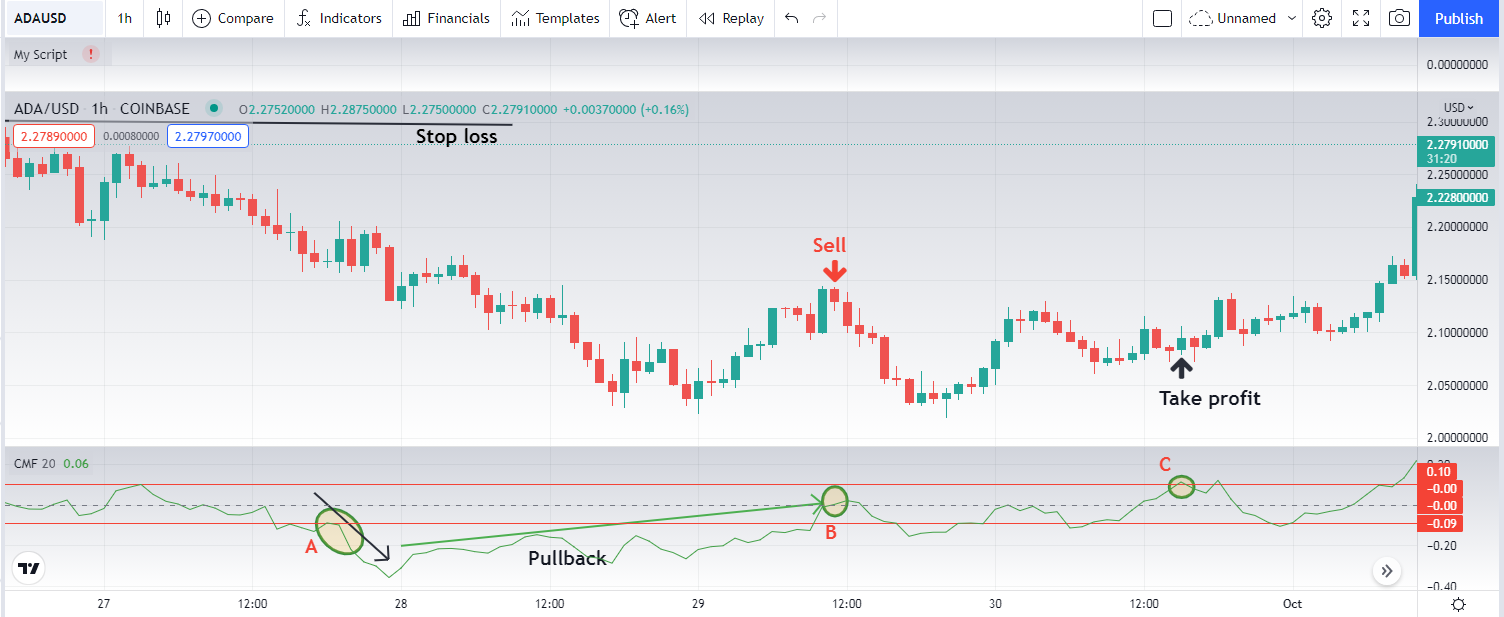
At position A, the CMF line dropped sharply from above 0.1 to below the -0.1 line, giving sell signal. You can immediately enter a Sell order after CMF crosses the -0.1 line from the top, similar to the trading method in example 1. However, most professional traders will not enter orders immediately, they often wait for a pullback from the market.
After the end of the pullback, the price breaks the 0.0 line down (position B), you can enter a Sell order. Place the stop loss a small distance from the nearest top. Close the take profit order when CMF reverses, rises sharply from below the -0.1 line to above and crosses above the 0.1 line (position C).
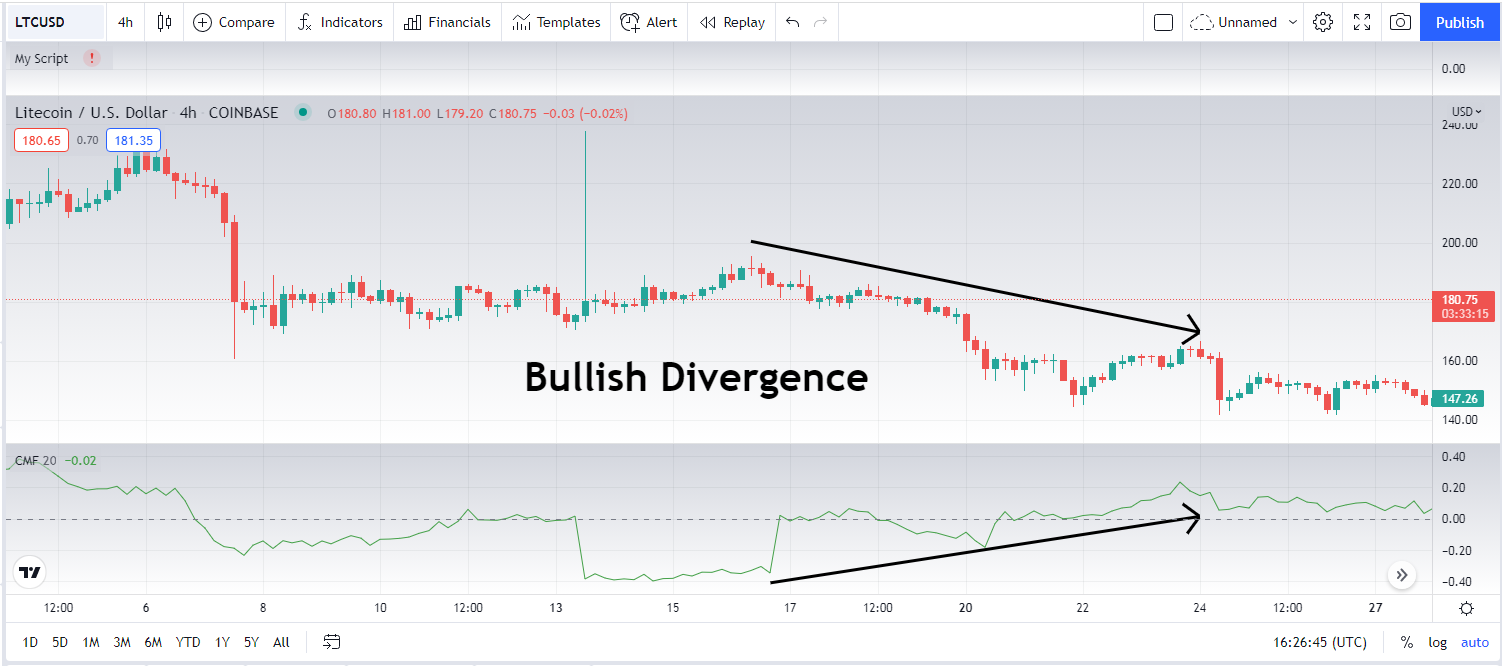
As with most oscillators, divergences can also be applied to the CMF. When the price action of the underlying crypto pairs a higher high or lower low that is not confirmed by a higher high or lower low on the Chaikin, it implies that the current trend of the price action is weakening and that a possible investment is imminent:
When the security price makes a lower low while the CMF hits a higher low, it indicates that the downtrend is losing momentum and an upward price reversal is likely.
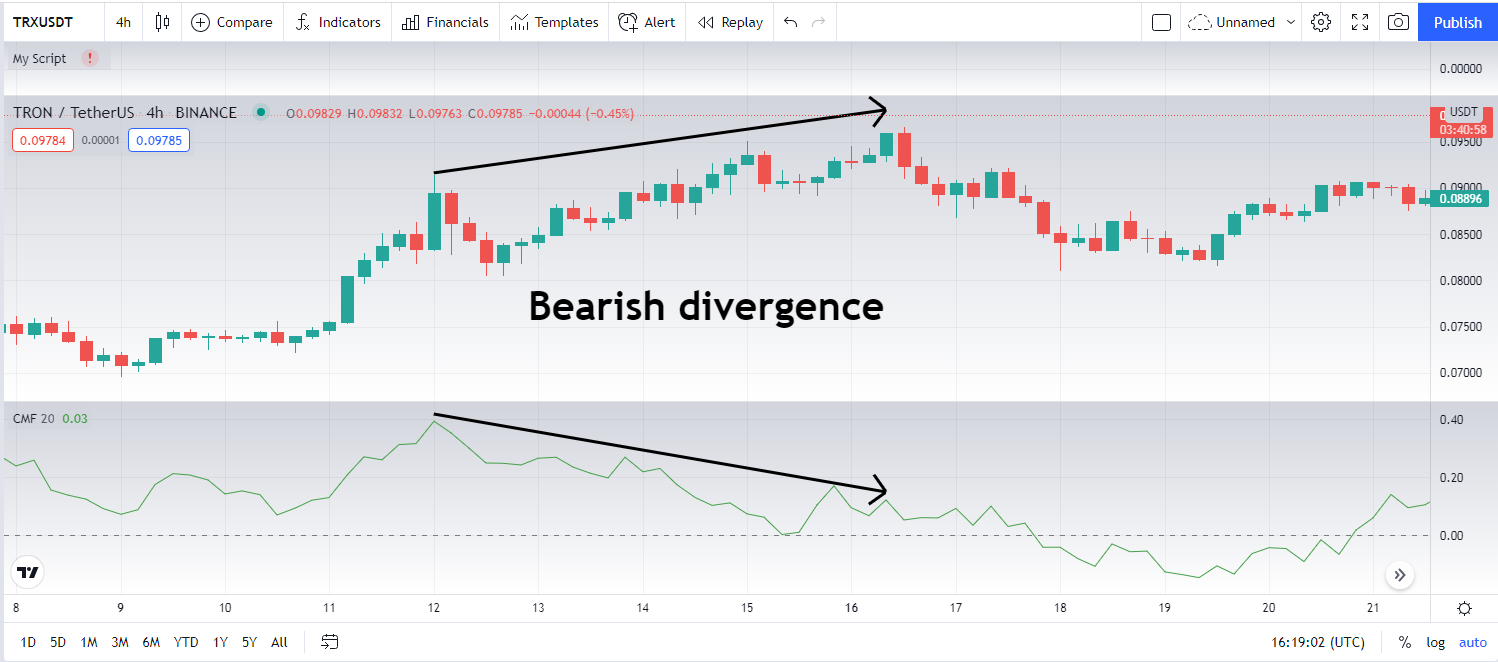
Similarly, when the price of the underlying crypto pairs hits a higher high while the CMF hits a lower high, it indicates that the uptrend is losing momentum and a price reversal is likely.
Trading with divergence is also a type of reversal trading, so it is much more difficult to approach than trend trading. Moreover, Chaikin Money Flow is not infallible, so it is unlikely that the signals generated by this indicator will always be correct. Therefore, when using CMF, it requires traders to combine other technical analysis tools such as indicators, candlestick patterns, price patterns, etc.

Pros:
- The Chaikin Money Flow differs from other momentum indicators by the fact that it uses volumes in its calculation method, which makes it a powerful indicator to anticipate a trend reversal.
Cons:
Chaikin Money Flow is not intended to be used as an isolated trading system, but rather as a tool to help traders identify trends based on other indicators.
Indeed, the single use of this indicator will lead to the identification of many false signals.
Chaikin Money Flow does not offer stop-loss and take-profit levels, they must be determined using additional indicators or according to the trader's own risk limits.
Exits can nevertheless be made when the sign of the CMF changes, such as a change in its value from positive to negative or vice versa.
The Chaikin Money flow is a trend strength indicator that is based on prices and volumes.
A positive value is meant to indicate an uptrend over the specified time period while a negative value is interpreted as a downtrend.
The Chaikin Money flow is a good indicator that gives the technical analyst another take on Chaikin's theories on buying and selling pressures.
It should not necessarily be used as the sole indicator to identify signals. This is because the Chaikin Money flow works well when paired with other indicators, especially those that have also been developed by Chaikin, Accumulation / Distribution and the Chaikin Oscillator or Chaikin Oscillator.

1. In your own words, give a simplified explanation of the CMF indicator with an example of how to calculate its value?
2. Demonstrate how to add the indicator to the chart on a platform other than the tradingview, highlighting how to modify the settings of the period(best setting).(screenshot required)
3. What is the indicator’s role in confirming the direction of trend and determining entry and exit points (buy/sell)؟(screenshot required)
4. Trade with a crossover signal between the CMF and wider lines such as +/- 0.1 or +/- 0.15 or it can also be +/- 0.2, identify the most important signals that can be extracted using several examples. (screenshot required)
5. How to trade with divergence between the CMF and the price line? Does this trading strategy produce false signals?(screenshot required)
6. Conclusion:

Try to read the lesson and the assignments carefully before you start editing.
You must write an essay that contains at least 600 words.
Make sure that you post your homework into the SteemitCryptoAcademy community.
Use copyright-free images with mention of its source, if possible, produce your own.
Plagiarism is forbidden in Steemit Crypto Academy, and its perpetrators may face serious penalties.
This homework assignment will run until 16th October'2021, Time- 11:59 PM UTC.
Include in your post among the first five hashtags #kouba-s4week6 and #cryptoacademy.
Users who are powering down will not be voted and considered excluded from participation.
Additionally, users with a reputation below 65 and/or haven't at least 600 SP in their wallet won't benefit from voting for their homework.


Cc:-
@steemitblog
@steemcurator01
@steemcurator02
Hola profesor @kouba01 Cometi un herror y quiero enmendarlo. La semana pasada publique mi tarea muy a tiempo, pero simplemente olvide colocar las etiquetas correctas, fue un mal entendido, solo pense que las habia colocado. Y espere que evaluara la tarea. Entoces decidi dar un paseo hoy por mi tarea y me di cuenta que no coloque las etiquetas. pero ahora las acabo de acomodar. por esta razon le pido disculpas y espero que pueda corregir mi tarea. Muchas gracias por su ayuda
https://steemit.com/hive-108451/@risedaniel/tarea-de-la-academia-de-criptoacademia-sobre-justswap-para-kouba01
Hola profesor mi publicacion no la ha evaluado
https://steemit.com/hive-108451/@risedaniel/justswap-crypto-academy-s4w5-publicacion-de-tareas-para-el-profesor-kouba01-republicacion
Hello teacher, my publication has not been evaluated
thank you for the information
[WhereIn Android] (http://www.wherein.io)
excellent👍👍
[WhereIn Android] (http://www.wherein.io)
Please professor Kouba01, I am okay to go with coinmarketcap fro my trading analysis?
OK no problem!
Professor can we use Tradingview in the other questions except question 2?
It is better to use another platform to diversify and discover the advantages of several tools of trading.
@kouba01 please visit my posthttps://steemit.com/hive-108451/@emmytexfrankline/crypto-academy-season-4-or-advanced-course-or-week-6-crypto-trading-with-chaikin-money-flow-indicator
Professor @kouba01, can we use Binance for the 02nd question? because that too run via tradingview chart, so I'm confused which one to look for.
Yes, it s possible.
Thank you for the clarification.
God bless you
Please any telegram or Whatsapp page for to join you?
My Homework Post:
https://steemit.com/hive-108451/@manuelgil64/crypto-trading-with-chaikin-money-flow-indicator-or-or-crypto-academy-s4w6-or-or-homework-post-for-kouba01
Hola profesor mi publicacion no la ha evaluado
https://steemit.com/hive-108451/@risedaniel/indicador-de-flujo-de-dinero-de-chaikin-crypto-academy-s4w6-publicacion-de-tareas-para-kouba01
Hello teacher, my publication has not been evaluated