Crypto Academy Season 5 [ Advanced course ] week 5: Crypto Trading With Linear Regression Indicator

Every trader has at least once in their life had an unfortunate trading experience by buying or selling a stock or token too early in the crypto market, only to then realize that in retrospect it was a phase. consolidation into a trend, or the opposite.
Maybe the trader that you are watched your profits evaporate when the consolidation phase turned into a great panic on the downside.
There is a wide range of techniques for describing price movement, ranging from trend lines to price analysis with the linear regression method.
As such, the linear regression indicator turns out to be an excellent confirmation tool, both for seeing active trends and for helping to spot trend reversals.
In this course we want to see, in a very practical way, how this element forms the basis of very effective and easy to learn trading strategies.

Linear regression is a simple concept in practice, but difficult in words. To calculate it you need a set of points on a graph. Once we have our points, linear regression is the straight line that minimizes the square of the distance of all points on the graph.
Understanding this concept is much easier if you consider the graph below.
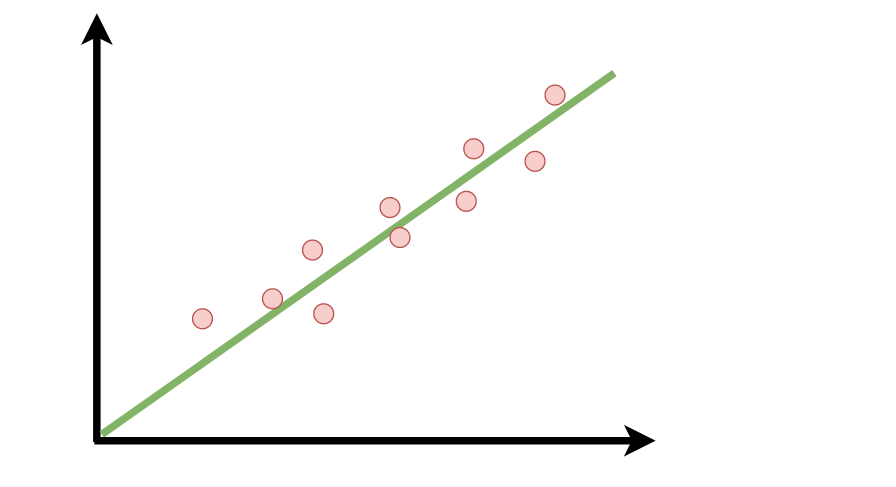
Take a good look at how the line is arranged with respect to all points on the graph. In any other way we had drawn it, by calculating the distance of each point from the line and squaring this distance, the sum of the various results would have been greater.
The fact of squaring each result ensures that it is not a simple average: the points far from the line, due to the squaring effect, have a greater weight on the final result.This is the main difference between a linear regression and a moving average.
Using the TradingView platform, we recommend that you try plotting a linear regression to see how it looks on the graph. Inside and outside of trading, this indicator is used to study the correlation between two dimensions. In trading, on the other hand, it is used to correlate time and the price of a pair: we will talk more about it in the next paragraph.
Now that you know what linear regression in statistics is, let's focus on its role in crypto trading strategies.
Let's start with the points on the graph. Which ones are they?
As you can easily imagine, the points that are examined represent the price of the pair at a certain time. We can, for example, decide to use all opening or closing prices between candles.
Once we have chosen which points to use, we can further select the amount of points we want to have on the graph.
As with many other trading indicators, TradingView platform will ask us how many candles to consider when calculating the regression. The “standard” value is 14, but you can customize it to your liking.
At this point we will see the result of the regression appear on our graph. Similar to an average, it is a line that is simply calculated in a different way.
As harmless as it may seem, as we will see shortly, this line is able to give us very precise and effective signals with which to build valid trading strategies.
In addition to placing the regression on the chart, try setting it to a different number of candles to see how its representation on the chart changes.

For this we will use, as usual, the dynamic graphical and technical analysis platform TradingView:
- Create a free account and access its various services.
- Click on the Chart tab and choose a pair to trade
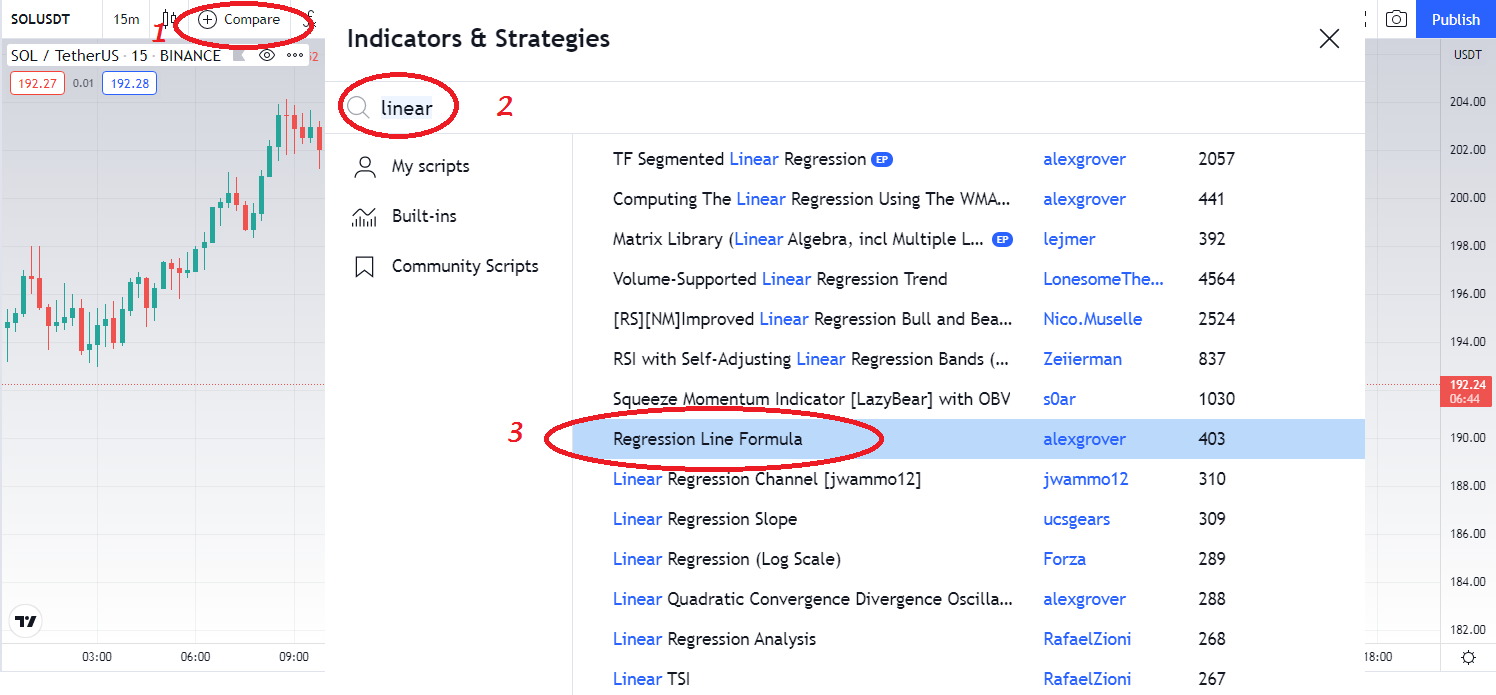
- To add the Linear regression indicator:
1-- Select the "fx" button
2-- Type Linear regression in the search box
3-- Then choose “ Regression Line Formula ”
• To configure it:
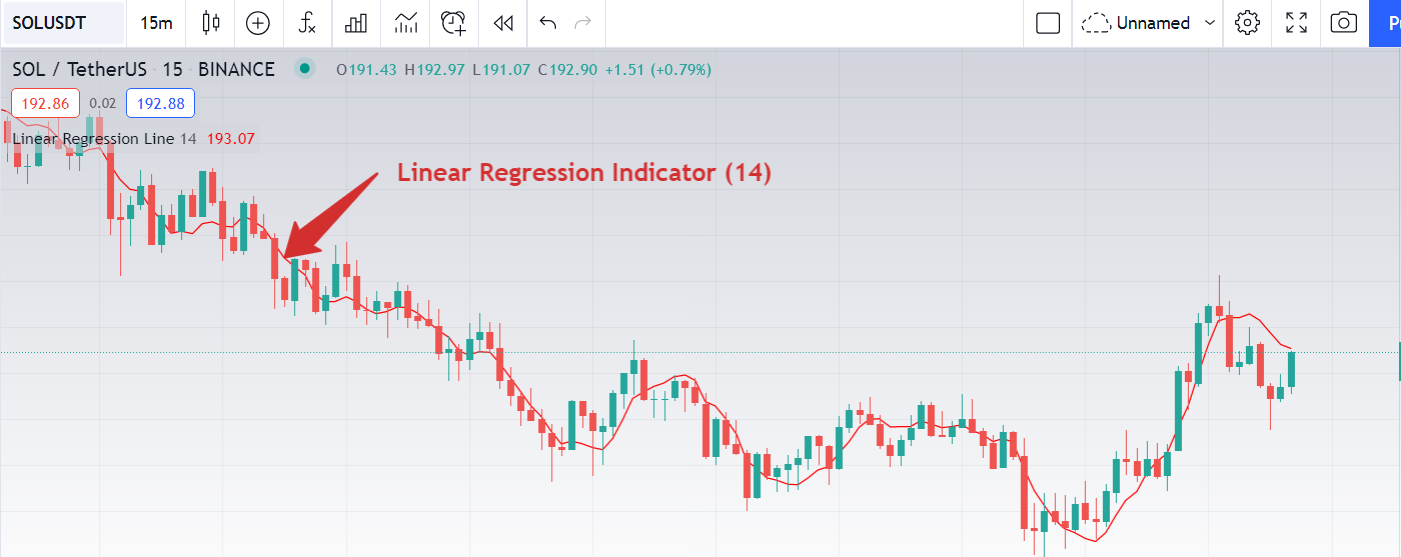
It will appear below the price chart. To see the custom window click on the corresponding Settings icon (highlighted with the arrow shown in the screenshot below).
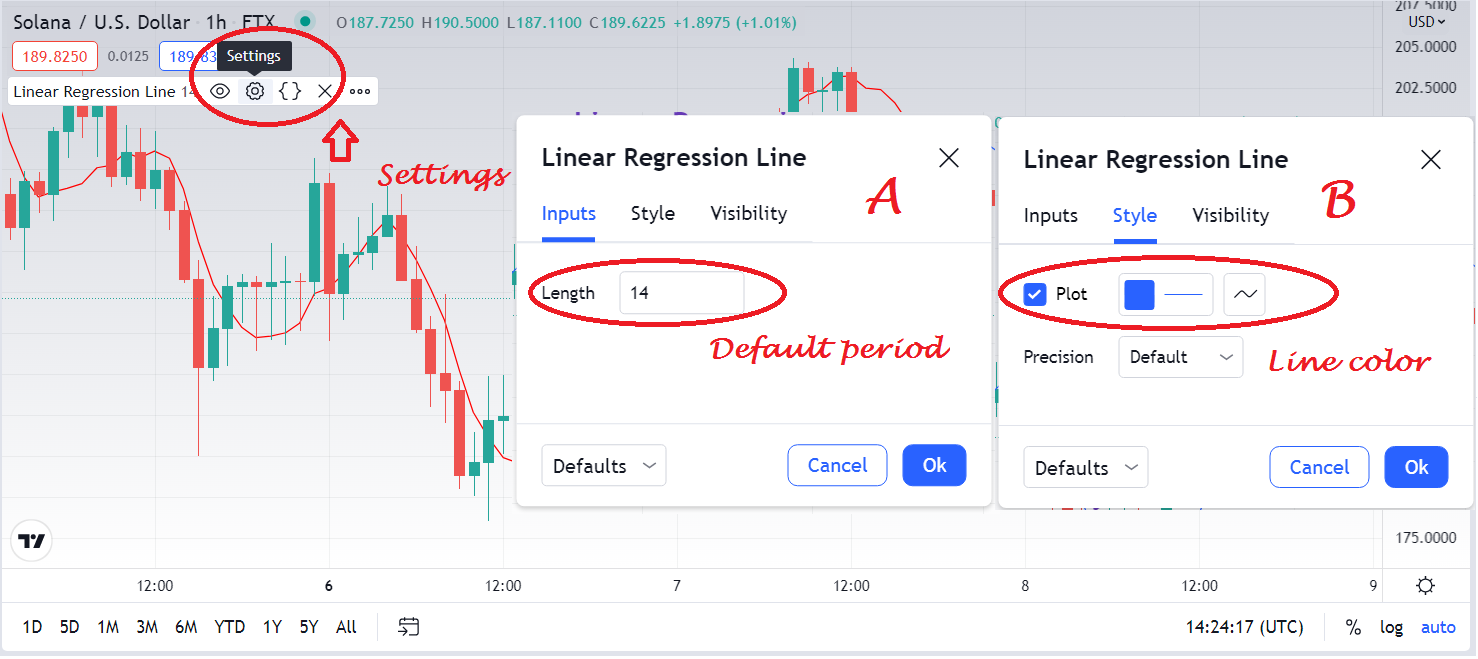
A. Inputs:
- Length (period): The number of bars that the indicator analyzes to indicate the average value. The default value for the period is 14. This means that the price change for the last 14 days is taken into account.
B. Style:
- Plot font (font color): You can choose the thickness and color of line.
Setting up the linear regression indicator is straightforward.
According to Colby and Meyers, this method will get good results using a period of 66 sessions (weeks, days, etc.).
It can also vary between 3 days and 300 days depending on the length of the trend period you are following.
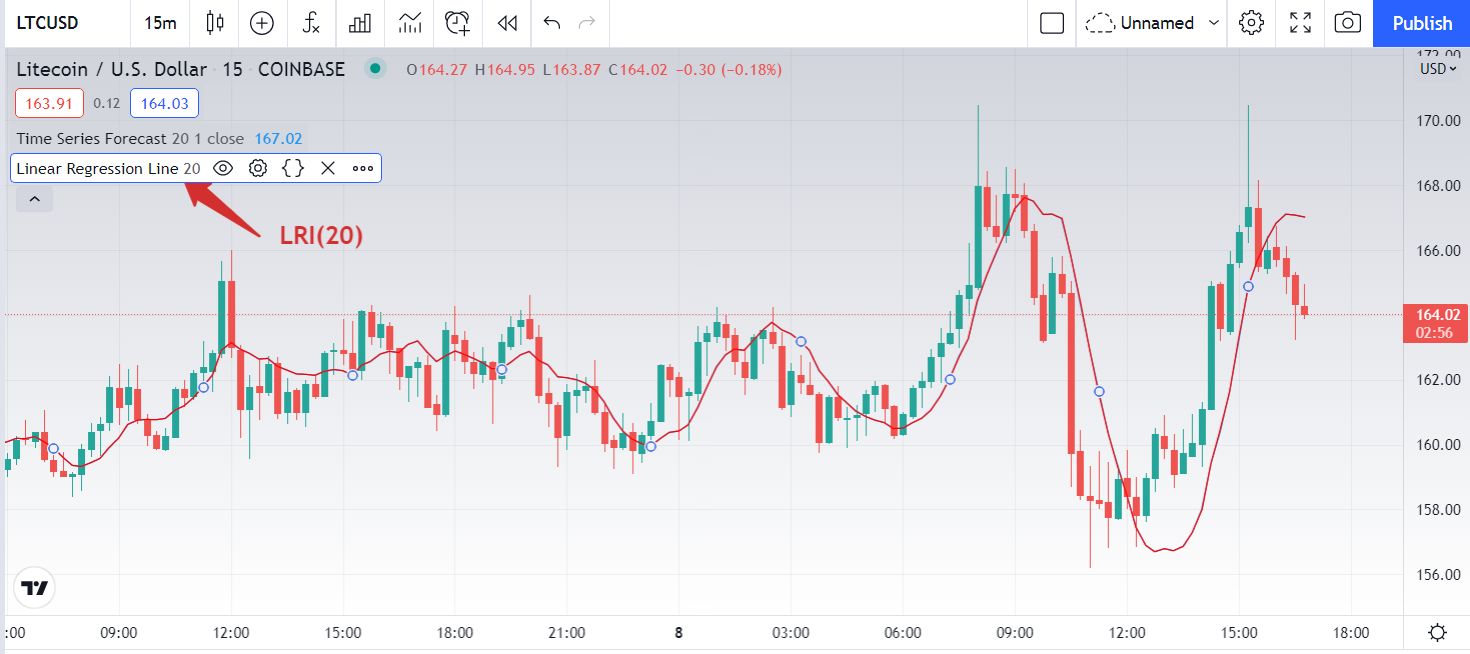
The linear regression line, which is calculated based on the price movements of a number of previous candles, will look like the one shown in the graph below:
Obviously, the slope of the regression curve will vary as the price curve changes, so it will differ depending on the period and the number of candles that will be considered. This is because it is advisable to use the direction of the linear regression indicator to enter and exit the market in addition to a longer term indicator as a filter.
In the same way as the moving average, the linear regression can be calculated on maximum and minimum prices, or only on maximums or minimums, on opening prices or on closing prices, which is also the most common method used.
The linear regression line can be understood as a kind of equilibrium price and can be used for both trend following and reversal strategies.
When prices cross the regression line and the regression line changes slope, we usually see a trend reversal; therefore, further price movement is expected in the direction indicated by the regression line.
Trend reversals occur when our linear regression line goes from a downward to an upward trend.
In this case, it doesn't matter where the price line is, but even here we can go looking for a reconfirmation of our signal; if there is a reversal coupled with a cut, the signal is even stronger.
We position our market entry when the reversal of the linear regression line is complete.
In this case, we have more flexibility regarding the positioning of stop losses and take profits. Here is a common strategy:
- Place the stop loss near the maximum reached by the regression line before going back;
- Let the position run until the regression line makes a new inversion.

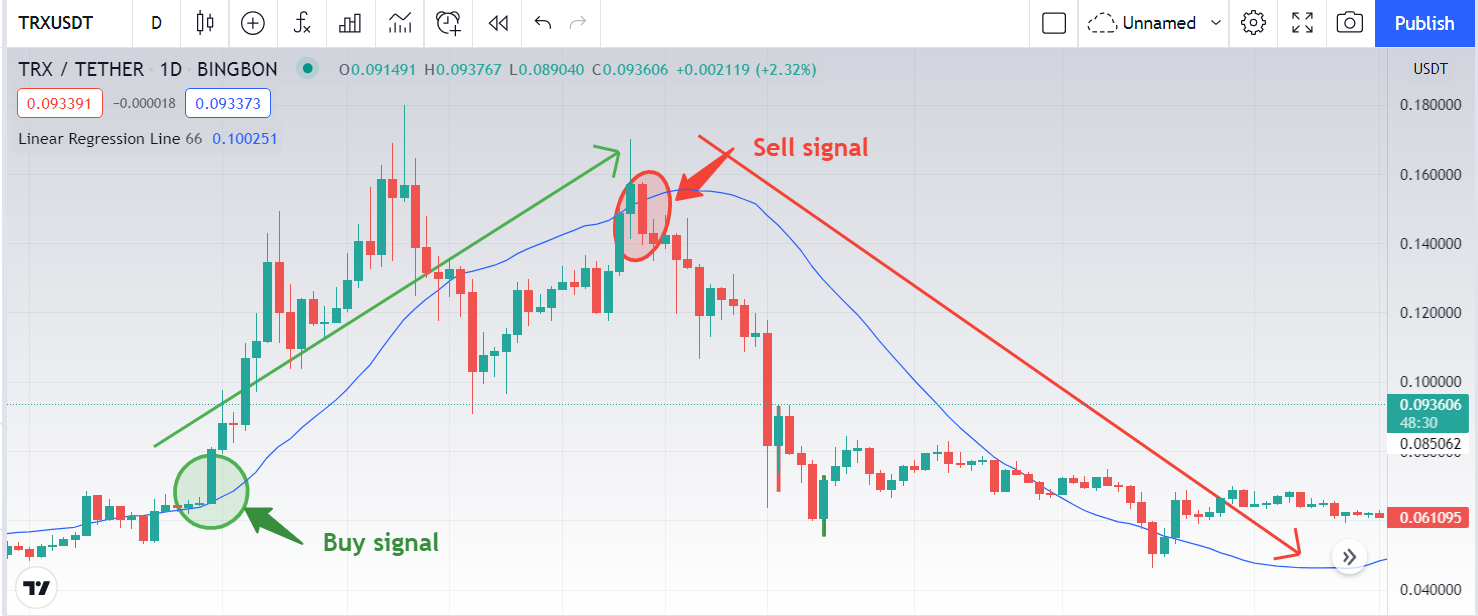
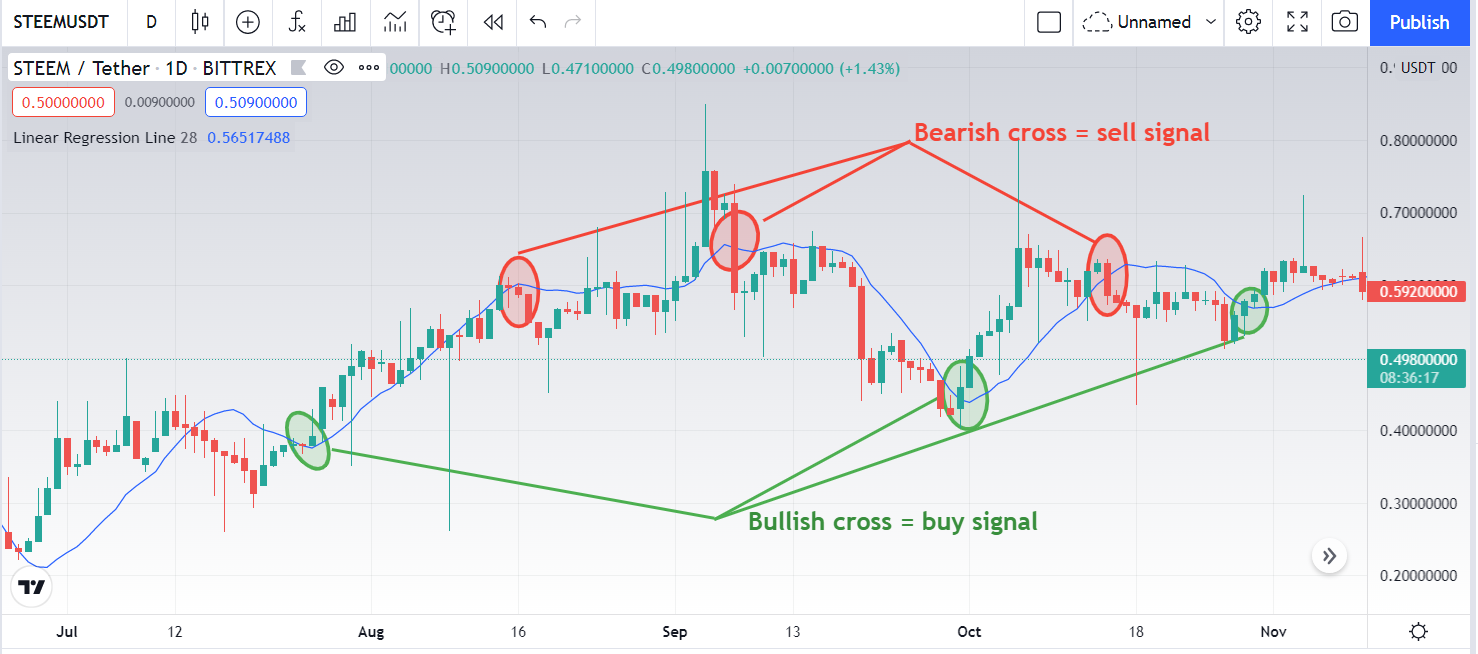
This strategy is to wait for the price and the linear regression line to touch. This event is called "cut":
- If a candle cuts higher or the regression line, a buy signal is generated;
- If, on the other hand, the candle cuts the regression line downwards, we are facing a sell signal.
It is not enough for the candle to cross the ascending or descending line. The closing price should actually be higher or lower, while the highs and lows of the period don't matter. Once the candle is closed with a full linear regression cut, we can consider opening the position. But first, it would also be the case to assess the length of the candle which lowers the price.
Normally, a stronger and safer signal is generated when the candle making the cut is particularly long.
At this point, we can open our position using these references:
- As a stop loss, we will define the price where the regression line and the candle of the chart touched;
- Instead of establishing a take profit, we will let the position slide until the candle crosses the line on the opposite side again.

As we have already mentioned during the guide, the linear regression line is very similar to a moving average.
More experienced readers will have noticed another important similarity; how to read trading signals from a regression line, in fact, is very similar to how to read signals from an average.
The substantial difference is that linear regression, using squared values, is more dynamic and tends to vary more with price differentials.
On the one hand this leads the regression line to generate signals with less delay, on the other hand it also leads it to generate more false positives.
Many traders prefer to combine the two indicators for an even more comprehensive strategy, entering the market when they receive a double signal from the linear regression and the moving average.
You can also test a mean and a regression line over two different time periods, for an even more different and detailed perspective.

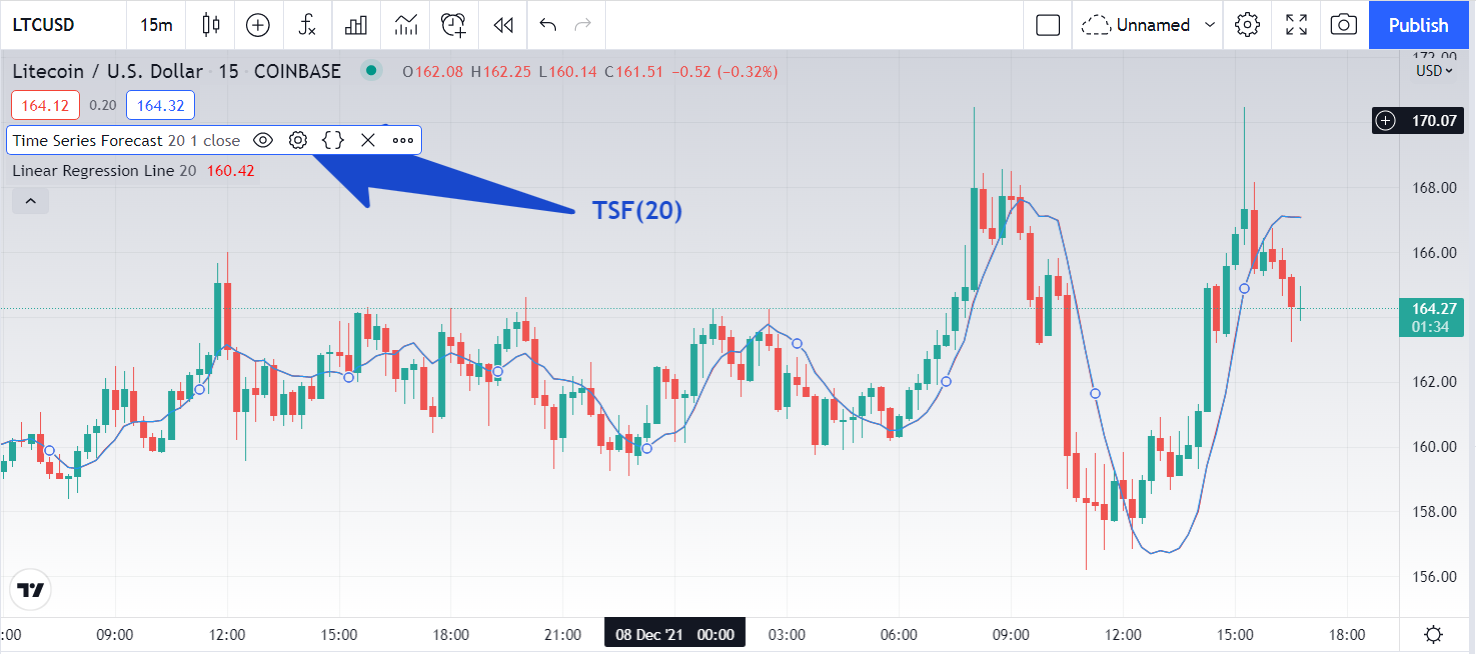
In the technical analysis of online CFD trading, the use of the TSF indicator is often very useful. Time Series Forecast Indicator, also known as Linear Regression Indicator, is actually one of the most useful tools for CFD trading because it is powerful and efficient.
The TSF or Linear Regression is a trend "follower" indicator, which to fulfill this function concentrates several linear regression models at one point (we'll see what this means later). All with the aim of forecasting prices in the short term.
Its effectiveness is mainly due to the natural temporal order that characterizes it. This is because the data points have a natural order, with days progressing according to a uniform and linear logic.
Although you can easily get lost in the theoretical explanations, in practice it is much easier. Below we see an example of a realtime chart to which a linear regression indicator has been applied (in blue).
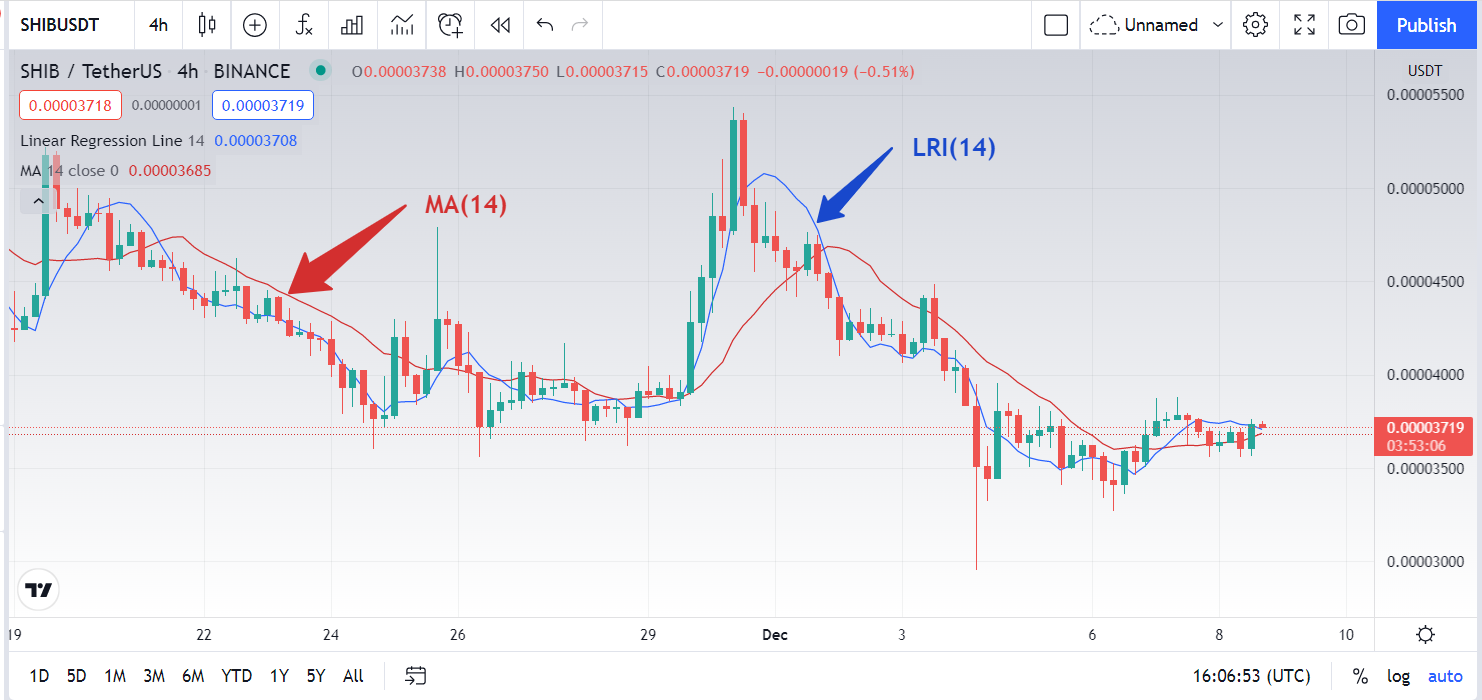
The TSF adds the slope of the line to the final value taken by the linear regression line. This characteristic makes TSF more sensitive to short-term changes than linear regression. For this, even if similar, the correct usage is as follows:
- TSF for the short term
- Linear regression for medium-long time horizons
Below is a graphic to clearly visualize this concept.
The most attentive will have noticed the similarity between the evolution of the TSF and that of the very short-term moving averages.
Not surprisingly, it is also known as the Moving Linear Regression Indicator. In practice, each point along the linear regression indicator is equal to the end value of the linear regression trend line. For this reason, the final value of a 20-day TSF trendline will have the same value as the 20-day TSF indicator.
As expected, the TSF should read similar to a moving average, if not exponential, except that the TSF is slightly more complex. In fact, the TSF takes multiple linear regression lines into account and combines them into a single moving average.
The TSF works very short term, much shorter than the moving average, so it can include tighter variations. To better understand the differences between the TSF and an exponential moving average, you can try applying them with the same chart and better observe this difference in practice.
In short, the TSF is basically a moving average which provides the following information to the trader:
- When the price crosses the TSF higher, it will be advisable to enter with a long position
- When the price crosses the TSF lower, it will be advisable to enter with a Short position
The TSF can be used to predict points of maximum, minimum, reversal zones. When a high or a low is evident within a given time frame, it means that there are good short term entry signals in even shorter time frames.

- Pros of the Linear regression indicator
The advantage of Linear Regression over a normal moving average is that it lags less behind the moving average, allowing it to react more quickly to changes in direction.
This is because, unlike moving averages, Linear Regression does not produce as much lag in its adaptation to changing prices because it fits a line to the point data, rather than averaging it, Linear Regression is more sensitive to price fluctuations.
Thus, any large deviation from the linear regression line should be of short duration.
- Cons of the Linear regression indicator
The disadvantage of Linear Regression is that it is not suited to violent price movements.
In addition, this trend indicator should not be used alone.
For a better success rate, it is necessary to have a confirmation signal using for example the Rsquare which will give you the power of the trend, as well as an oscillator such as the RSI, the MACD or the stochastic to have precise signals as point of entry or exit.

The Linear Regression Indicator is a trend following indicator that plots a dynamic version of the Linear Regression Indicator as a moving average.
Linear regression can be used as an alternate form of moving average because they are conceptually very close.
The concept of this type of indicator helps to provide assistance to traders who wish to identify the direction of the trend, its magnitude and the speed at which it is moving.
This indicator can also help a trader identify trend reversals by using the crosses of two linear regression lines.
As always, one should never use an indicator alone to make trading decisions.
Linear regression should be used as part of a larger system that includes other metrics, to help you make better decisions.

1. Discuss your understanding of the principle of linear regression and its use as a trading indicator and show how it is calculated?
2. Show how to add the indicator to the graph, How to configure the linear regression indicator and is it advisable to change its default settings? (Screenshot required)
3. How does this indicator allow us to highlight the direction of a trend and identify any signs of a change in the trend itself? (Screenshot required)
4. Based on the use of price crossing strategy with the indicator, how can one predict whether the trend will be bullish or bearish (screenshot required)
5. Explain how the moving average indicator helps strengthen the signals determined by the linear regression indicator. (screenshot required)
6. Do you see the effectiveness of using the linear regression indicator in the style of CFD trading? Show the main differences between this indicator and the TSF indicator (screenshot required)
7. List the advantages and disadvantages of the linear regression indicator:
8. Conclusion:

Try to read the lesson and the assignments carefully before you start editing.
You must write an essay that contains at least 600 words.
Make sure that you post your homework into the SteemitCryptoAcademy community, and your homework title format like this "[Title]- Crypto Academy /S5W5-Homework Post for kouba01
Please do not add the tag #club5050 if you do not interpolate all the conditions to participate in this initiative.
Use copyright-free images with mention of its source, if possible, produce your own.
Plagiarism is forbidden in Steemit Crypto Academy, and its perpetrators may face serious penalties.
This homework assignment will run until 18th December'2021, Time- 11:59 PM UTC.
Include in your post among the first five hashtags #kouba-s5week5 and #cryptoacademy.
Users who are powering down will not be voted and considered excluded from participation.
Additionally, users with a reputation below 65 and/or haven't at least 900 SP in their wallet won't benefit from voting for their homework.


Cc:-
@steemitblog
@steemcurator01
@steemcurator02
Hi bro plz help me
What a beautiful lesson on trading with the Linear regression indicator. Reading your work, I see this indicator is really useful to traders professor. Thanks so much for such an interesting lessons that will help most especially us traders alot
Thanks, Professor.
This sounds like the concept of Algebra in Math and very related to linear equations where the graph is a straight line. Wow! The idea of some indicators is from a wide range of subjects treated in school, especially economics and Mathematics. LOL. Great concept prof.
Thanks very much @kouba01 for another great Lecture. Looking forward to submitting my homework soon.
Thank you for this course