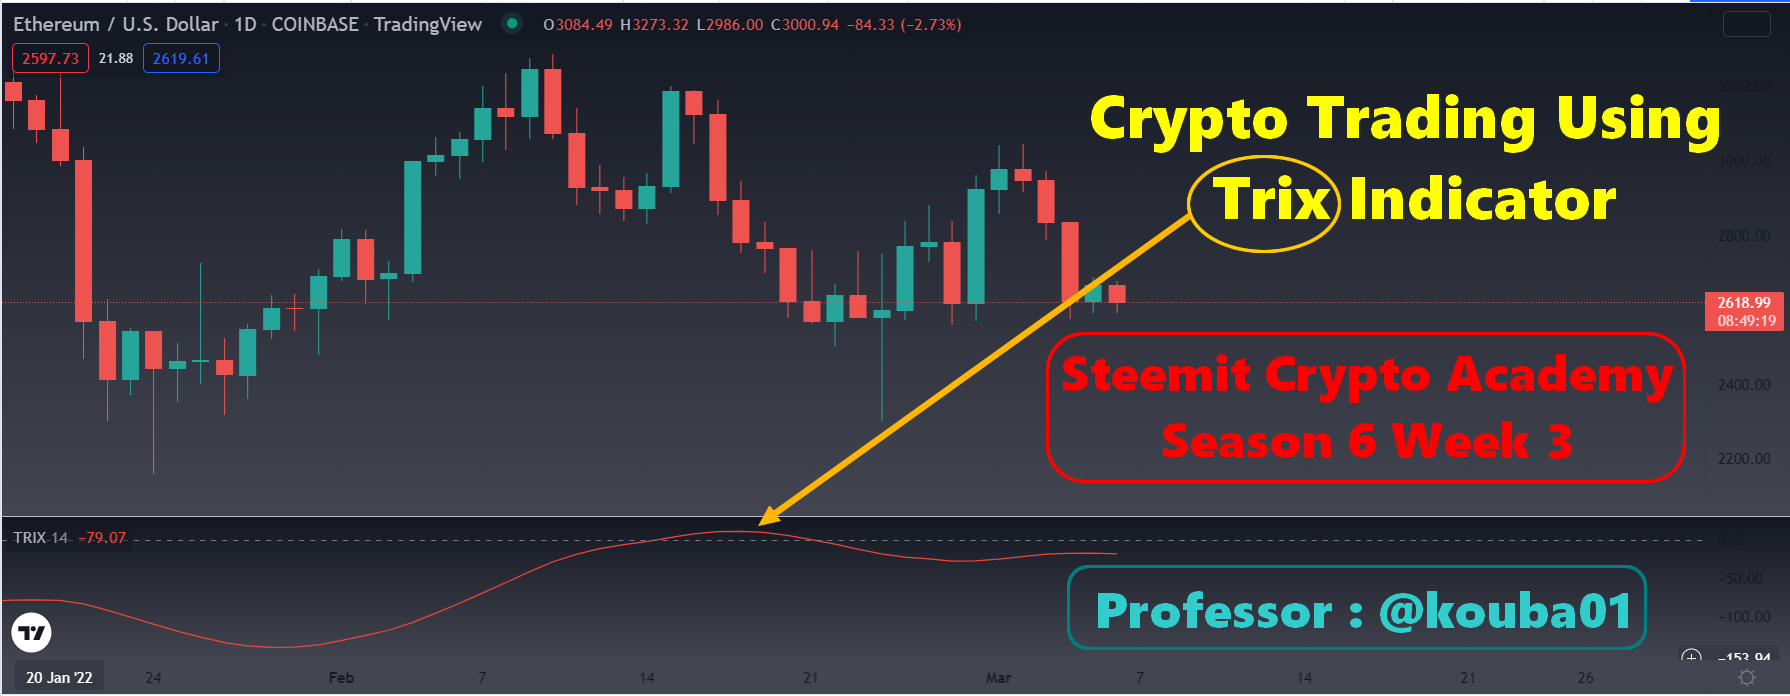
Crypto Academy Season 6 week 3: Crypto Trading Using Trix Indicator

Better not to approach crypto trading if you don't intend to learn how to do good technical analysis.
Opening any operation on any title without knowing anything about its history, without having analyzed its graph and without having developed a precise investment strategy is pure madness.
Technical analysis, since the world began, is based on trading indicators. Today, we know them in graphical form, as a line added to that drawn by the historical price of a stock.
Before the invention of modern PCs and calculation software, trading indicators were developed solely on the basis of data disclosed by exchanges.
In this in-depth study we will talk about the Trix indicator, a technical indicator that is particularly useful for studying a stock, especially when used in combination with trend indicators.

The full name of the Trix indicator is Triple Exponential Average. It is a name that directly refers to the formula used to calculate it, which takes into account a triple exponential average.
Using a triple exponential averaging allows the Trix to avoid all those background noises that produce false signals. The complexity of the calculation that takes into account a matryoshka of exponential moving averages (EMA) actually completely filters out insignificant price movements.
The Trix is one of the technical indicators. Like most of them, its usefulness does not consist so much in giving precise signals of entry into the market (there are trend indicators for this), but in correcting forecasts and signals, in order to avoid be mistaken.
We report the Trix formula not because you have to calculate it manually but rather to better understand how this very particular indicator works.

The operation of the TRIX indicator is closely related to that of exponential moving averages. An EMA usually has the job of drawing a trend on the chart that is easier to interpret than what is indicated by the candles. While candles are easily affected by momentary fluctuations, especially sharp ones, averages trace a more linear path.
The problem with individual exponential moving averages, however, is how they are calculated. On the one hand, compared to simple moving averages, they give more weight to recent values assumed by the price. This helps avoid lagging signals, as is often the case with simple averages. In part, however, this is also their weakness. Since recent values are more influential on the average, a misleading swing on a more recent candle ends up ruining the reliability of the average.
What Hutson understood was that this defect of exponential averages can be reduced by reiterating their method of calculation. In this way, the possibility of making the chart clearer is retained, while giving more importance to the most recent candles, and the two things are not mutually exclusive. The result is an indicator that does not lag price like a simple moving average, but does not generate the same amount of false signals as a pure exponential average.

Before looking at the formula, let's first see what the TRIX trading indicator looks like on the Tradingview platform.
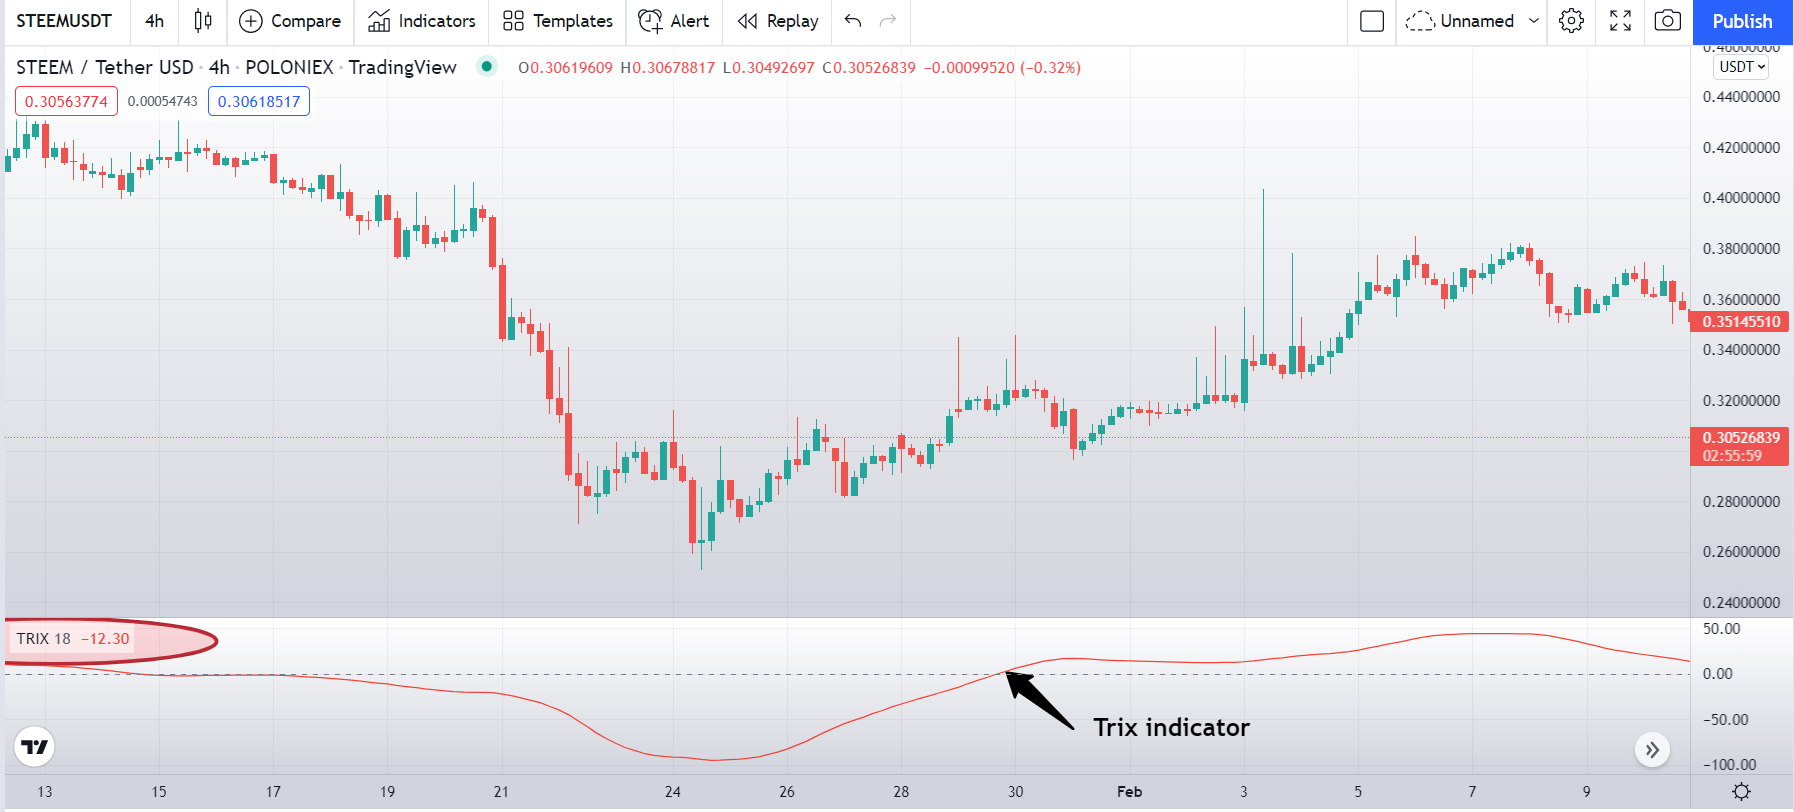
As you can see, this is an oscillating line, which dances around the ZERO line depending on whether it takes on positive or negative values.
The formula is rather the following (don't be afraid, the calculation is done automatically by the platform):
TRIX = (EMA3 t - EMA3 t-1) / EMA3 t-1
Basically, the formula is based on the triple exponential moving average (EMA3) calculated on the closing price of our asset.
The reason it is used is that in this way our oscillator is less affected by the volatility of the average, and is therefore less affected by sudden price movements.
The consequence is that when the oscillator moves a lot, this movement becomes even more important. 14 or 15 are generally used as the period of the EMA. It depends on the type of use you want to make of it: the larger the reference time horizon, the longer the EMA period should be.
The main parameter is the "EMA Period" element, which is responsible for the value of the period of the TRIX triple moving average.
The higher this value, the more the MA will be smoothed and the fewer signals will arrive. This is because the indicator will analyze data over a longer time frame, therefore, the average will be stronger. And vice versa, with a low period, the signals will arrive quite often, which can affect their quality.

TRIX is normally considered to generate a buy signal when the oscillator value crosses the zero level line upwards. This happens, for example, in correspondence with an uptrend that moves the three exponential moving averages with which the indicator is calculated upwards.
The TRIX indicator generates sell signals that mirror buy signals. A sell signal is generated whenever the value of the indicator crosses the zero level. This can be used either as a close signal for long positions that have already been opened, or as an entry signal for a short sell trade. A practical example obtained again with the pair TRX/USDT is shown below.
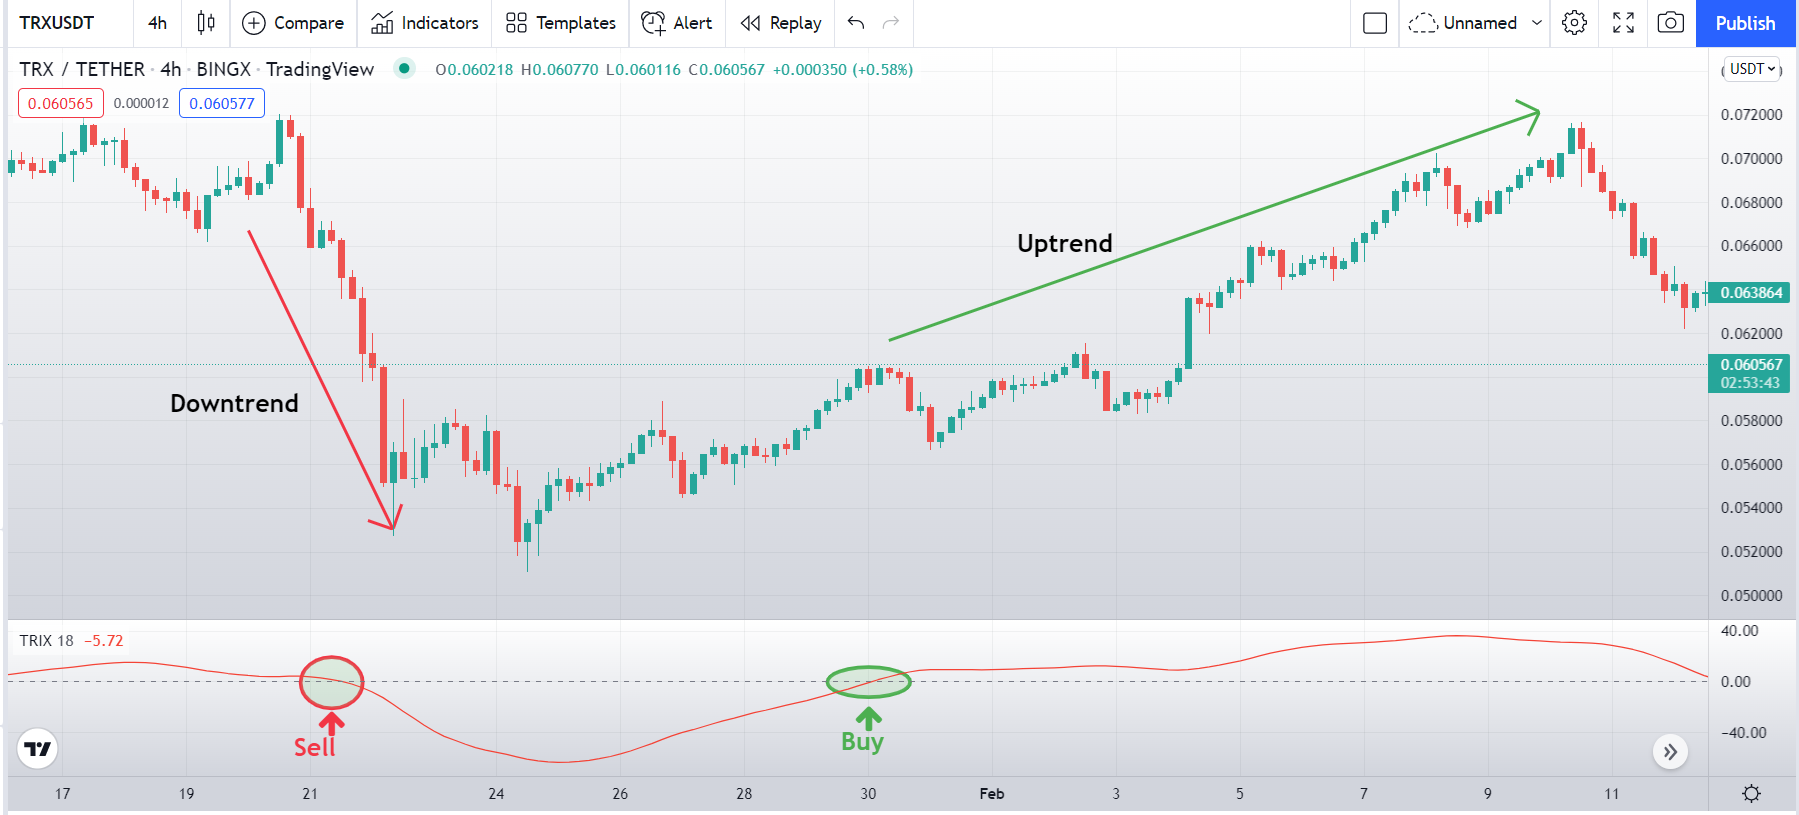
Indeed, looking at the examples given, we see that immediately after or shortly after these crossings, the prices continue to follow the upward or downward trend.
The Trix indicator, in fact, filters prices far too much to be considered a valid trend indicator. This may be good if you want to open long term positions, but in the short term it shows all its limits.
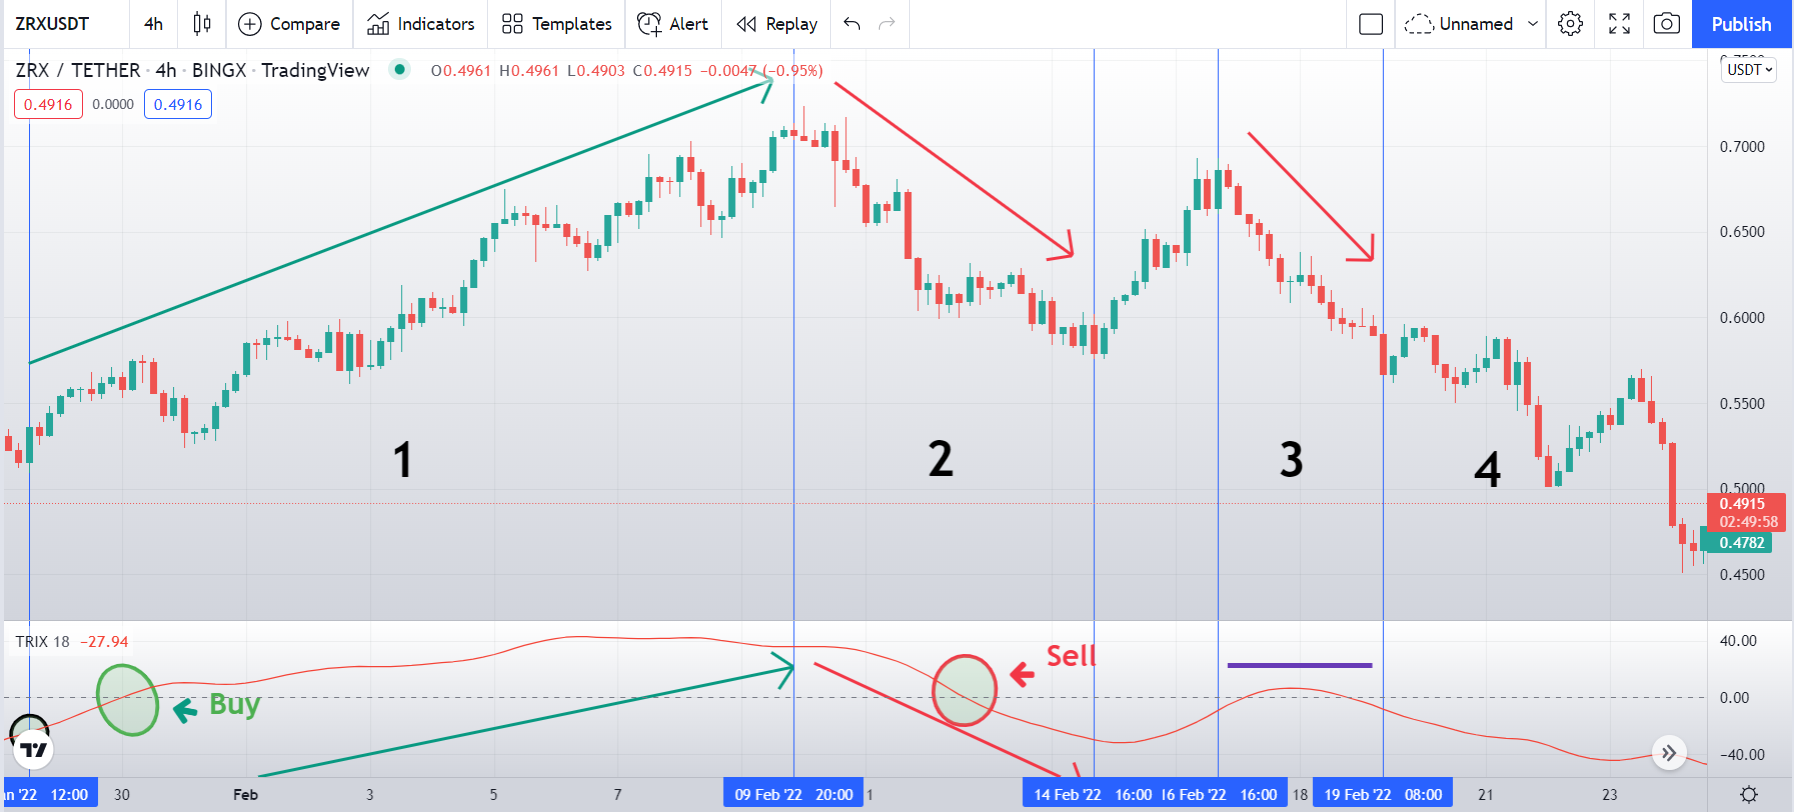
As can be seen at first glance, the Trix indicator is by no means a reliable tool for obtaining market entry signals.
Indeed, in part 1, the signal to buy the Trix indicator comes two days after the start of the rise, while, similarly, in part 2, the indicator does not allow to predict the movement at all. subsequent bearish correction.
However, we understand the usefulness of the Trix in part 3 . While the trend is bearish, the Trix line remains mostly flat, indicating that volumes (measured by the exponential moving average) are stable and not supporting the trend.
The Trix, in this case (part 4), anticipates the subsequent bearish movement, and it is in this case that it shows all its usefulness. Going, in fact, to filter out insignificant price movements, it gets the better of all the apparent movements that characterize the phases of contraction.

A trade can be placed when the indicator simply changes direction after touching extreme levels and to do this an exponential moving average, for example 9 period, of the TRIX itself can be used as a filter, which can allow the creation of a line signal similar to that used in the MACD; in practice, you enter long when the TRIX crosses the moving average from bottom to top and short otherwise when the TRIX crosses the exponential moving average from top to bottom.
Let's start from this last point by comparing the MACD and the TRIX to understand how these indicators differ.
Let's take a 15-period TRIX with a signal line represented by a moving average of 9 and see its chart behavior against the classic MACD (12,26,9). These two momentum oscillators gravitate around the zero line and both have an identical signal line, the 9-day EMA. As the STEEM/BTC chart shows, the TRIX has a much smoother trend than the more erratic MACD in its movements.
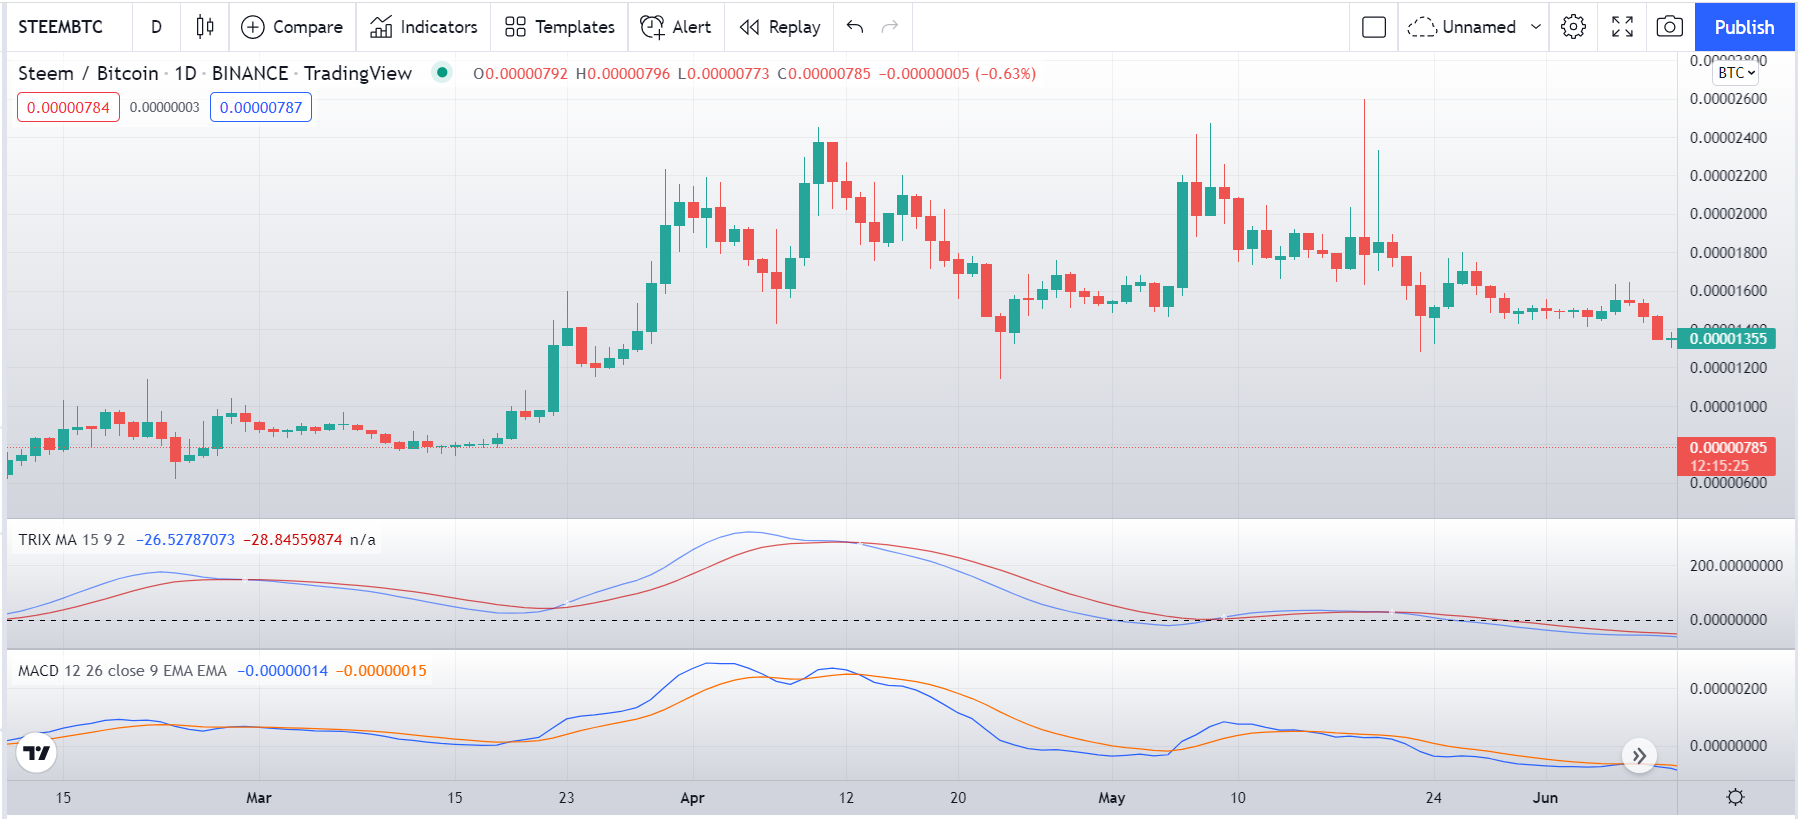
This peculiarity of the TRIX of a greater regularity in its trend, makes it possible to avoid a greater number of false trading signals than the MACD.
From this first chart, however, we can already identify the three main trading signals that the TRIX is able to offer the trader and to which we will return later.
- The break of the signal line by the TRIX is a first indication of the future directionality of prices;
- The cross of the central zero line represents a second confirmation of the previous indication confirming a bullish/bearish trend;
- TRIX divergences provide an important warning of a future trend change.

The methodology most used by short-term traders is one that involves a reduction by the TRIX of the so-called signal line, or a 9-period exponential moving average of the TRIX itself. When the TRIX crosses (crosses) the signal line from high to low we have a bearish indication, conversely when the TRIX crosses the signal line from low to high we have a bullish signal.
In practice, you enter long when the TRIX crosses the moving average from bottom to top and short otherwise when the TRIX crosses the exponential moving average from top to bottom.
Let's see a chart example applied to the BTC/USDT pair.
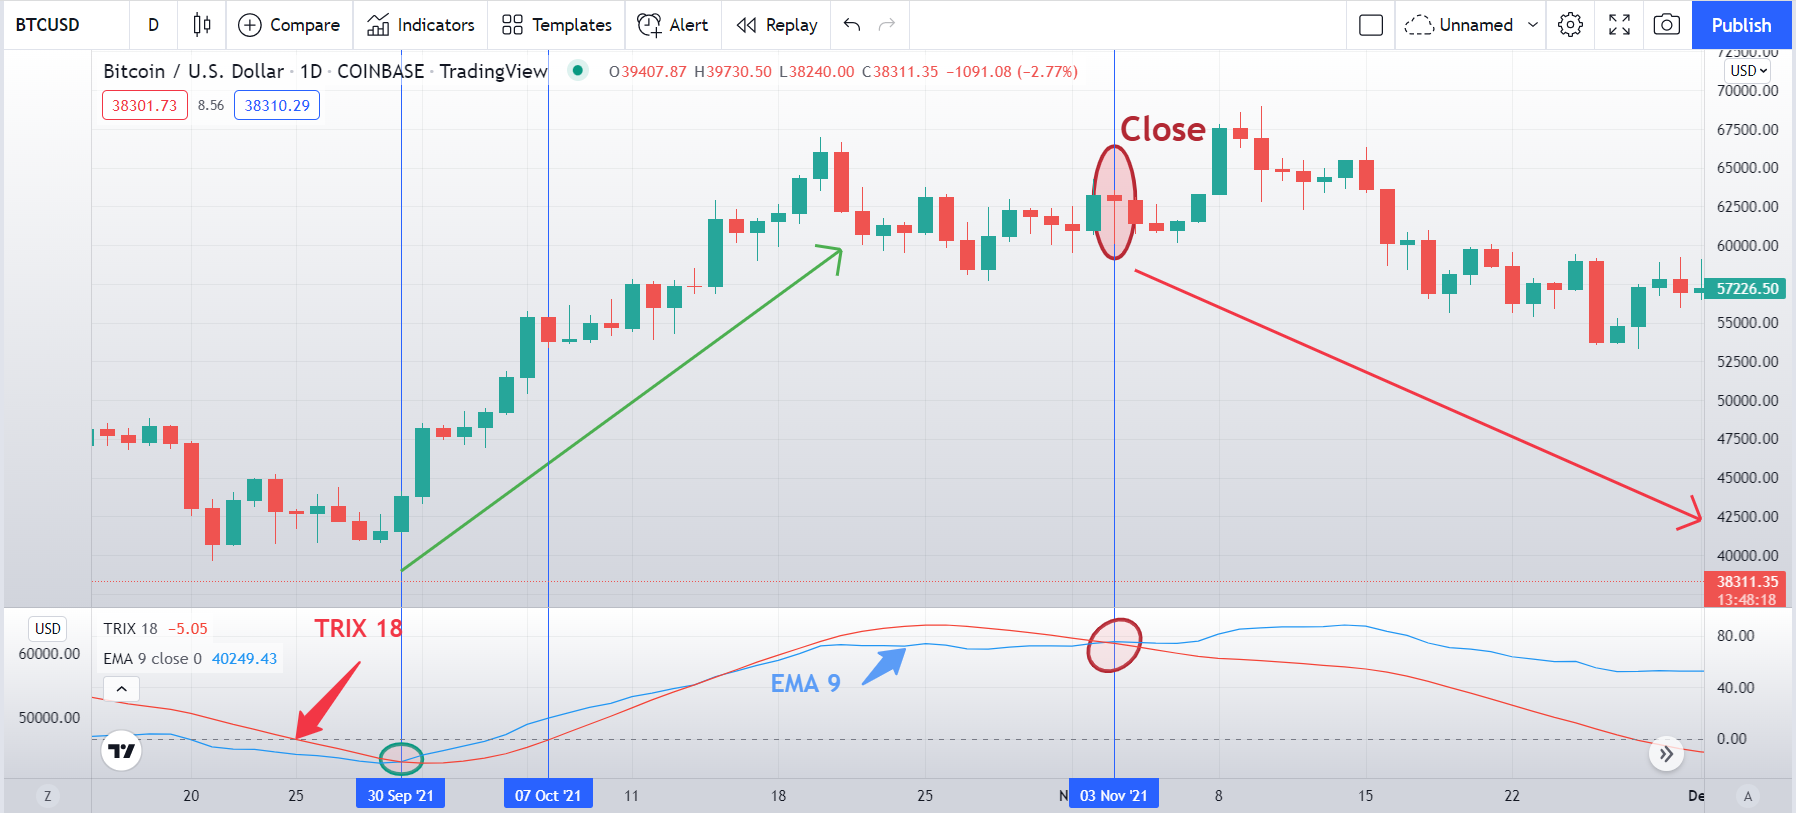
At the end of September 2021, the market provides a first bullish signal on BTC with the TRIX crossing the signal line (red line) (blue line) from bottom to top. The prices rise for a few sessions (8 days), confirming the new trend with the crossing of the zero line.
The TRIX and the moving average are getting closer, confirming the uncertainty of market prices, but the TRIX never falls below the moving average, confirming the continuity of a trend that, in fact, will only fail at the beginning November.
In this period, the indicator reaches high levels, but above all it turns downwards, cutting through the moving average. By formalizing the bearish signal, the trader can close long positions by taking profits.
Obviously, this technique is not exempt from false signals but also in this case a judicious money management based on a rigorous stop loss always allows to minimize the damage deriving from any and inevitable false signals of trading.

The zero line cut by the TRIX represents another very useful indication for the trader to accompany the signal line cut commented on above. This second indication probably represents a more usable signal for investors with a medium to long-term time horizon.
When the TRIX crosses the zero line from bottom to top, we can say that we have theoretically moved into an uptrend, while when the opposite occurs, i.e. the cross from top to bottom of the zero line, we entered a downtrend.
Very often, this indication becomes operationally very strong if it is supported by significant technical breakdowns of static and/or dynamic supports and resistances, or by substantial increases in traded volumes. Even better if it comes with a price divergence.
Divergence represents a classic market alert that momentum indicators such as the TRIX are able to offer investors.
We have taken the example of the TRX/USDT pair.
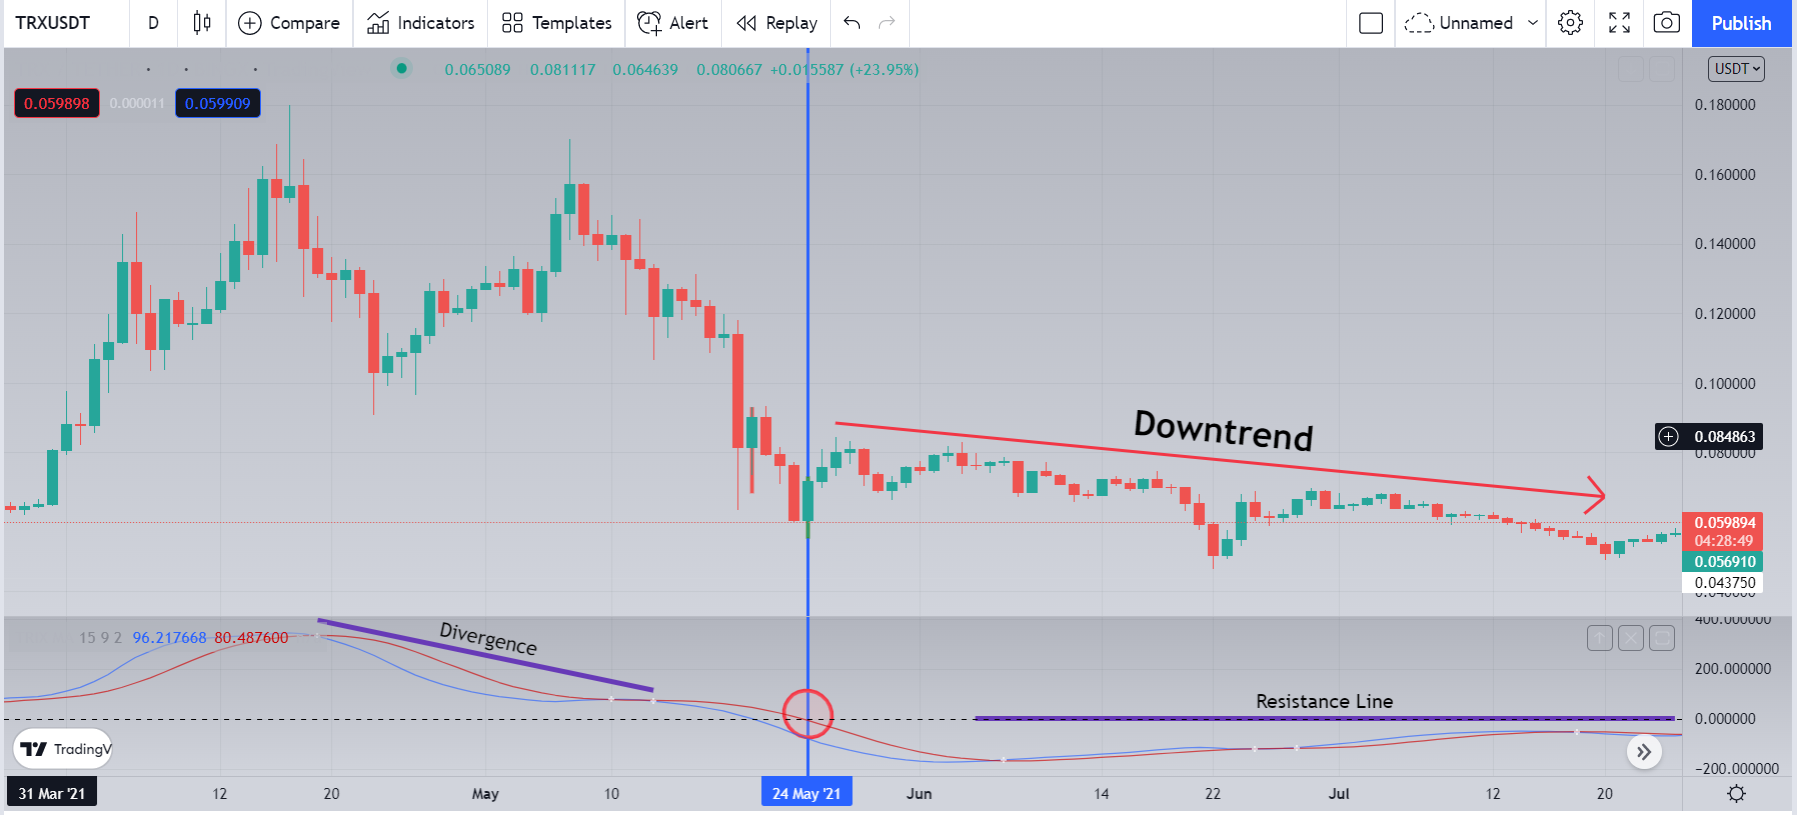
After a clear divergence between the TRIX and the prices between April and May 2021 and, after a drop in the TRIX compared to the moving average 9 (blue line), on May 21 the TRIX (red line) falls below the zero line .
This was clearly a strong bearish signal that anticipated a broader bearish move. Interestingly, in the following months, the same zero line acts as resistance for the TRIX, keeping it compressed below the watershed in tune with the price bear market.

Despite the great ability of the Trix indicator to filter price movements, it is advisable to be combined with other indicators capable of providing more accurate signals. It is seen that among the best indicators that best lends itself to serve with the Trix indicator is the Aroon indicator. Let's see the graph:
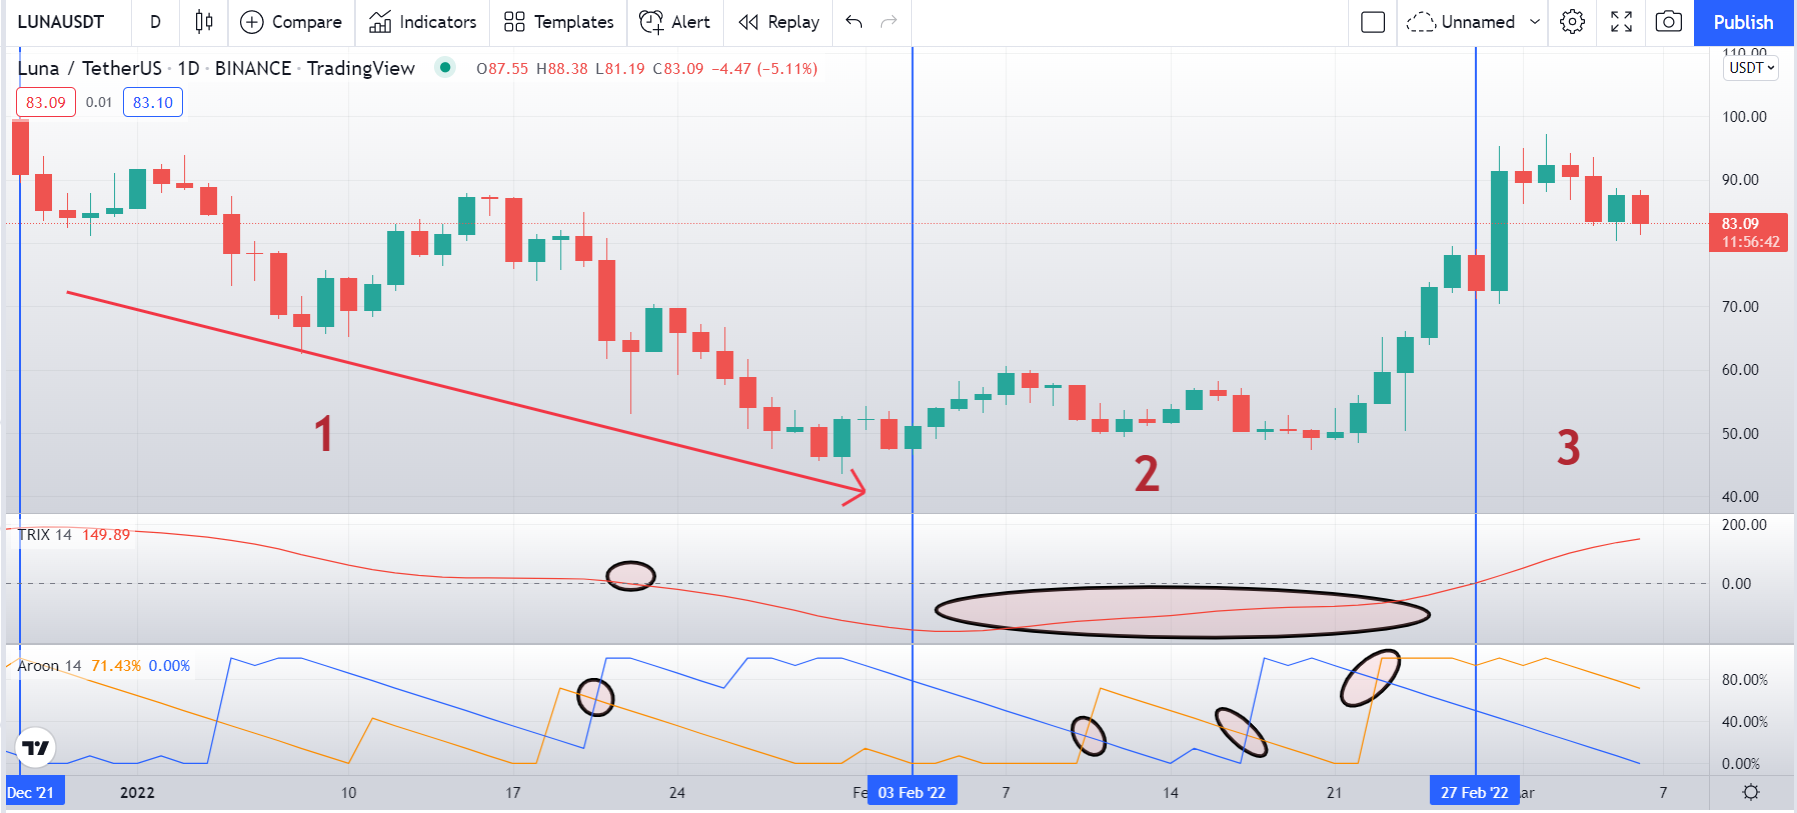
As you can see, the Aroon indicator gives you three clear signals to enter and exit the first downtrend(1), where the Trix enters the sell zone one day late and gives no signal to exit.
Over the entire period considered, in fact, volumes remain down and the price is about to face the most significant rise of period 3.
If you were planning to invest a few weeks in the LUNA/USDT pair, you could have relied solely on the Trix indicator.
We do know, however, that leaving a position open for several days can lead to particularly high overnight rates, so especially if you're just starting out, we recommend that you focus your energies exclusively on intraday trading.
The Trix, in this perspective, completely fails in zone 2, as it continues to give the downward movement even if significant oscillations occur which, according to the Aroon indicator, would have allowed you to collect interesting profits in a few hours.

The TRIX indicator has its pros and cons. Based on the feedback from traders on online platforms, we have identified the following positive qualities of the tool:
- TRIX is able to filter out market noise, including on low timeframe charts.
- The indicator determines the direction of the main trend on the chart with high accuracy and shows the price reversal in a timely manner.
- Can display divergence signals.
The disadvantages include the fact that the indicator lags the price on the chart a bit. This is due to the peculiarities of its calculation formula, which is based on exponential average lines. And such movements, as you know, always give signals with a slight delay, since they work on the principle of data averaging.

In conclusion, we can say that the TRIX, like the other momentum oscillators, helps the investor to understand the direction and the strength of a trend by identifying at the same time any sign of exhaustion if not of a real reversal of trend of the trend itself. Its particularity of being less "nervous" than the MACD makes it less prone to false trading signals and therefore more reliable in interpreting the future direction of the market.
With the information we have given you, we have no doubt that you will know how to use this indicator correctly: at first you will need a little practice, but then you will be fine.

1. Discuss in your own words Trix as a trading indicator and how it works
2. Show how one can calculate the value of this indicator by giving a graphically justified example? how to configure it and is it advisable to change its default setting? (Screenshot required)
3. Based on the use of the Trix indicator, how can one predict whether the trend will be bullish or bearish and determine the buy/sell points in the short term and show its limits in the medium and long term. (screenshot required)
4. By comparing the Trix indicator with the MACD indicator, show the usefulness of pairing it with the EMA indicator by highlighting the different signals of this combination. (screenshot required)
5. Interpret how the combination of zero line cutoff and divergences makes Trix operationally very strong.(screenshot required)
6. Is it necessary to pair another indicator for this indicator to work better as a filter and help eliminate false signals? Give an example (indicator) to support your answer. (screenshot required)
7. List the pros and cons of the Trix indicator:
8. Conclusion:

Try to read the lesson and the assignments carefully before you start editing.
You must write an essay that contains at least 600 words.
Make sure that you post your homework into the SteemitCryptoAcademy community, and your homework title format like this "[Title]- Crypto Academy /S6W3-Homework Post for kouba01
Please do not add the tag #club5050 if you do not interpolate all the conditions to participate in this initiative.
Use copyright-free images with mention of its source, if possible, produce your own.
Plagiarism is forbidden in Steemit Crypto Academy, and its perpetrators may face serious penalties.
This homework assignment will run until 12th March'2022, Time- 11:59 PM UTC.
Include in your post among the first five hashtags #kouba-s6week3 and #cryptoacademy.
Users who are powering down will not be voted and considered excluded from participation.
Additionally, users with a reputation below 60 and/or haven't at least 400 SP in their wallet won't benefit from voting for their homework.


Cc:-
@steemitblog
@steemcurator01
@steemcurator02
Hello prof @kouba01 my homework post has been more than 48 hours and is yet to be graded please help me out @kouba01
https://steemit.com/hive-108451/@favrite/crypto-academy-s6w3-home-work-post-for-kouba01
Been experiencing this these last 2 days. Is something wrong?
The link you are trying to use is not existing anymore
thanks, @b-naj. That explains it.
How can I insert the EMA line with the Trix indicator in Trading View instead over the candles? Best Regards. As always this is such an excellent article to learn another tool for analysis. #venezuela #affable
Isn't it week 3, Professor?
That s True, it s 3r week.
Y apenas ayer se me descuadró mi 5050 por necesitar el dinero .... Sera para la próxima...
Professor, thank you for sharing such an interesting topic with great values. I will be part of it
I want to be cleared of something prof, does club5050 still require 150 monthly powerup ? Please reply
Not anymore according to the new rules published by Steemit team. Just stay closed to the clubs. ☺️ #venezuela #affable
Hy @kouba01
Professor i want to ask in the 3rd question you said that define the limitations in medium and long term please elaborate me the context of medium isn't it short term period?
Medium term is closer to long term than short term.
Hello professor @kouba01 please review this one.
https://steemit.com/hive-108451/@kingcent/trading-using-trix-indicator-crypto-academy-s6w5-home-work-post-for-kouba01
Hello professor @kouba01, hope you are doing well. Respected Sir, I had forgotten that my last powerup had expired, but I successfully power up the steem at the very moment when you mentioned while grading. Please check and add the marks of club5050 so that I can receive a vote. Thankyou
https://steemit.com/hive-108451/@samizuberi/trix-indicator-crypto-academy-s6w3-homework-post-for-kouba01