Steemit Crypto Academy Season 2-Week6 | Cryptocurrency Trading with MACD indicator


Introduction :
When thinking about starting trading in the cryptocurrency market, you will have to learn how to analyze the performance of the market to reach the best levels of trading, whether it is buying or selling, and the analysis is economic or technical. And now we are talking about the second type of technical analysis, which is the use of technical indicators, which are very many, but some are better and simple, and on which experienced or novice traders rely.
Now we are talking about the most popular MACD indicator. This easy-to-use tool is often part of successful trading systems. Today, we will learn the use of this indicator to trade cryptocurrencies based on its calculation formula, its settings, and the different types of signals it emits. We will also look at concrete examples of trading in the cryptocurrency markets. Good reading!!
What is the MACD indicator?
The MACD indicator whose acronym is Moving Average Convergence Divergence is a tool based on the divergence and convergence of several moving averages, which is part of the family of technical indicators of oscillators.
It was designed to measure the direction and strength of a trend as well as the phases of reversals and potential entry and exit points.
This multitude of functionalities makes it a fairly complete indicator, as it can be used for its qualities as an oscillator allowing trend following and it also allows to identify the price reversal.
MACD is one of the most popular calculation instruments for determining stock market trends, the MACD indicator is inevitable for any investor who wishes to invest in the stock market using technical analysis and has been used with representation and methods of Easy to learn, MACD instruments have been used by a large number of traders and investors since the late 1970s to identify moving averages that indicate a new trend, whether bullish or bearish.
MACD Formula, how to Calculate MACD?
To calculate the MACD we must differentiate between two exponential moving averages (EMA) with different periods.
The MACD formula is Short EMA - Long EMA To calculate the signal line, you need to take an exponential moving average over x days of the MACD line.
The histogram is calculated by making the difference between the signal line and that of the MACD.
MACD calculation formula most used in trading platforms: MACD (12, 26, 9)
- MACD Line Calculation Formula
- MACD Signal Line Calculation Formula
The signal line is calculated from an EMA of 9 days with respect to the mainline and thus gives additional information on its previous movements.
Interpretation of the MACD Indicator in trading :
The MACD indicator is built from three curves moving around the zero line, see the graph below.
In this chart of the ETH / USD pair, we have added the MACD indicator. This is the blue line that oscillates following price fluctuations.
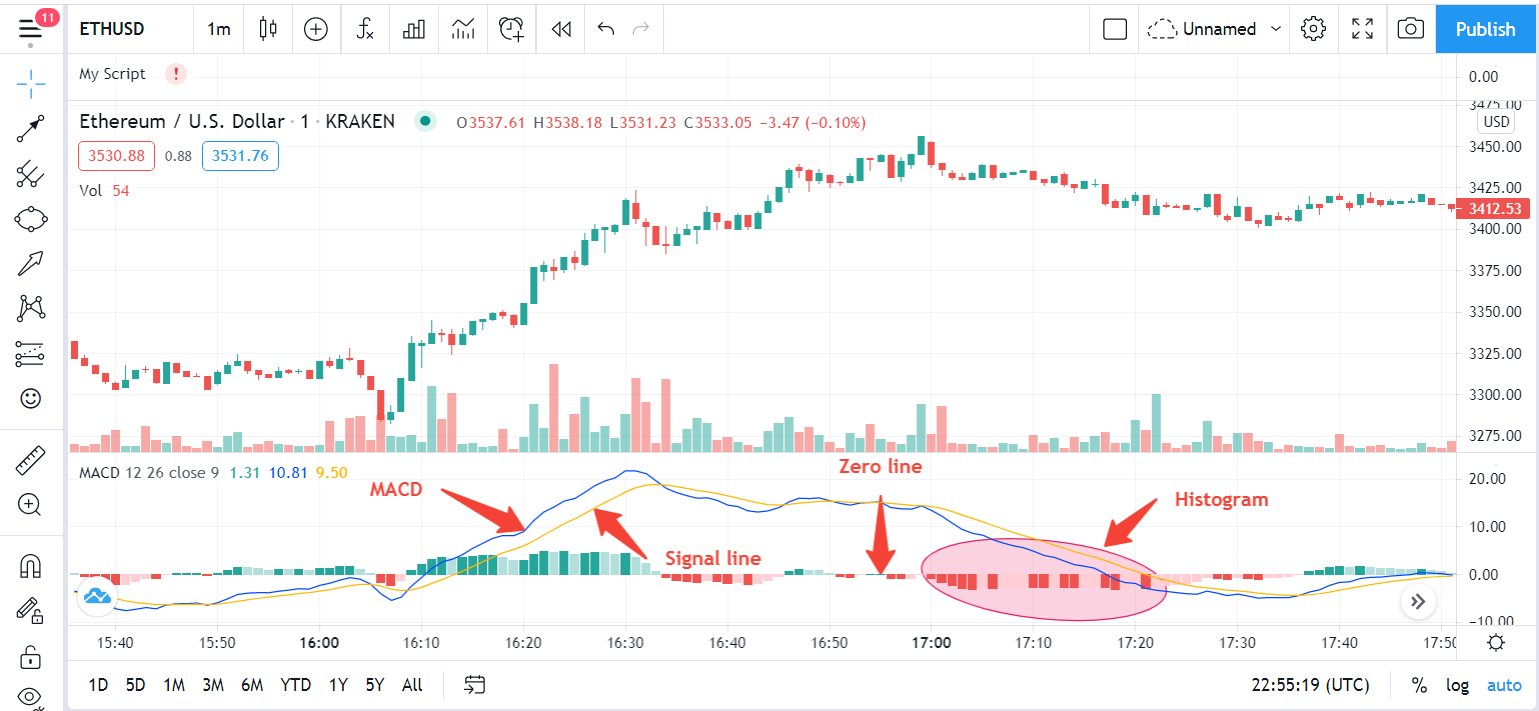
As you can see, the MACD is not alone, but it is an indicator made up of indicators. In addition to the MACD itself, there are also two other indicators: the signal line (in yellow) and the histogram (in green and red).
- The signal line :
The MACD signal line oscillates around the MACD line, when they cross, then these crosses are considered to be trend reversal signals, especially if the cross is at the ends of the MACD chart, i.e. far below or far above the zero line.
- Histogram :
To more closely trace the relationship between the MACD and the balance lines, traders can follow the histogram which is simply a bar chart located close to the zero line to indicate the relationship between the MACD and the balance lines.
When the MACD crosses the equilibrium line, the histogram will cross the zero line. When the MACD crosses the equilibrium line, the histogram will rise above the zero line - and when the MACD falls below the equilibrium, the histogram will fall below the zero line.
- The zero line :
The zero line represents the middle line of the histogram. It represents the zero value of it. When the histogram is zero, it means the signal line crosses the MACD, so their difference is zero.
MACD Crypto Trading Strategies :
MACD is a very versatile indicator that can be used in different ways to analyze and trade cryptocurrencies. We will see some of its uses. What's more, with a little imagination, you can create your own trading strategies with the MACD.
- Crossing of MACD and signal line
Usually when the MACD line crosses above the signal line traders interpret it as a buy signal, conversely when the MACD line crosses below the signal line traders tend to consider this. as a sell signal.
On the TRX / USD pair chart below, we see how a crossing of the signal line is followed by a fall in the price of TRON, an upward cross was followed by a fall in the price of the cryptocurrency.
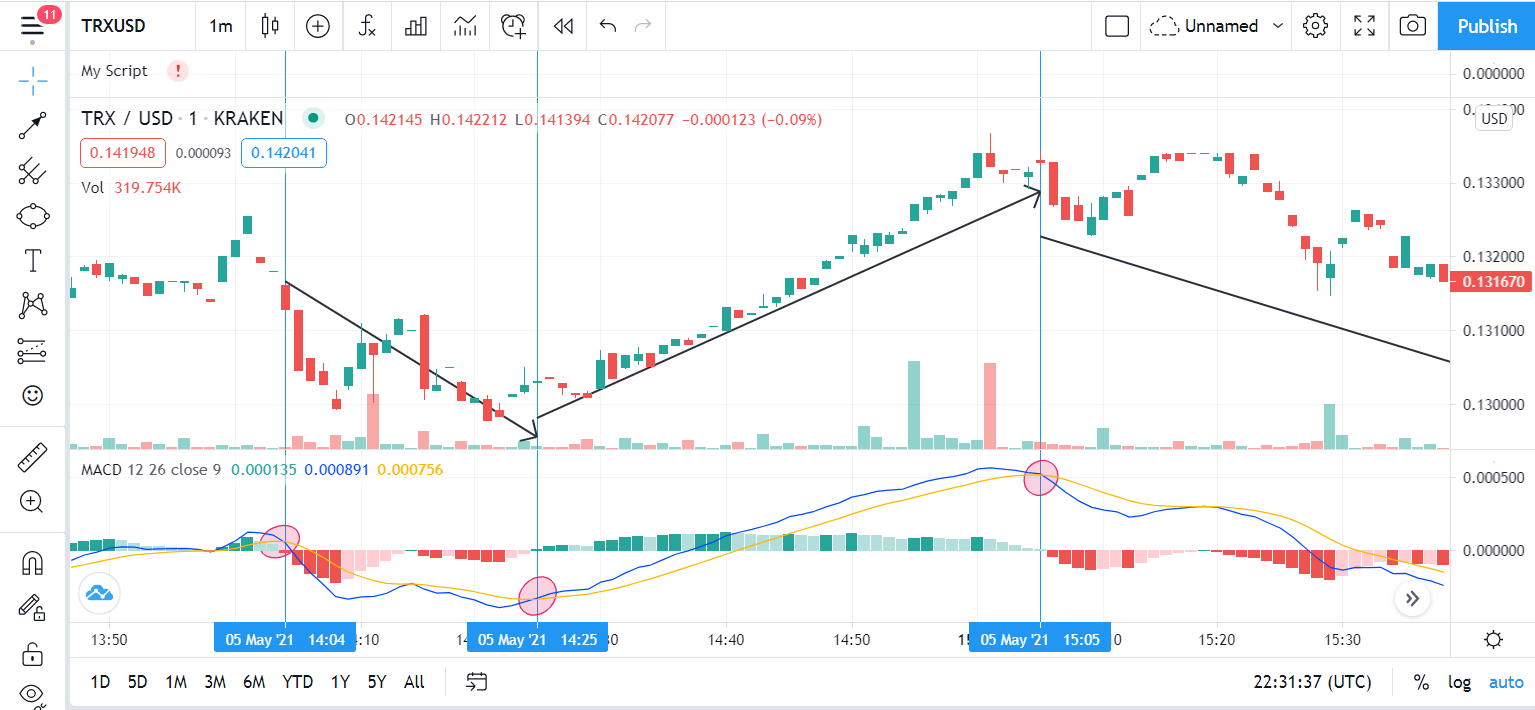
Of course, not all crosses result in real reversals, but by taking those crosses that are in the direction of the trend (bearish in this case), we increase the probability of success.
Graphically, these crossings also correspond to the moment when the histogram changes poles. This is because when the signal line crosses the MACD line on the upside, the histogram changes from the negative side to the positive side. Likewise, when the signal line crosses the MACD downwards, the histogram changes from the positive side to the negative side. Therefore, instead of monitoring this crossing, you can just rely on the histogram itself, which is easier to follow.
- Crossing of MACD and zero line
Another interesting signal to watch is the crossing of the MACD and the zero line. However, it manifests after crossing the MACD and the signal line, so it lags further.
When the MACD crosses the zero line on the upside, there is potentially a buy signal. Conversely, when the MACD crosses the zero line on the downside, there is potentially a sell signal.
Recall that the MACD is the difference between the moving average of period 26 and that of period 12. So the bullish crossing of the MACD and the zero line corresponds to the crossing of the moving average 12 and the moving average 26 on the rise. Likewise, the bearish cross of the MACD and the zero line is the crossing of the 12 moving average and the 26 moving average on the downside.
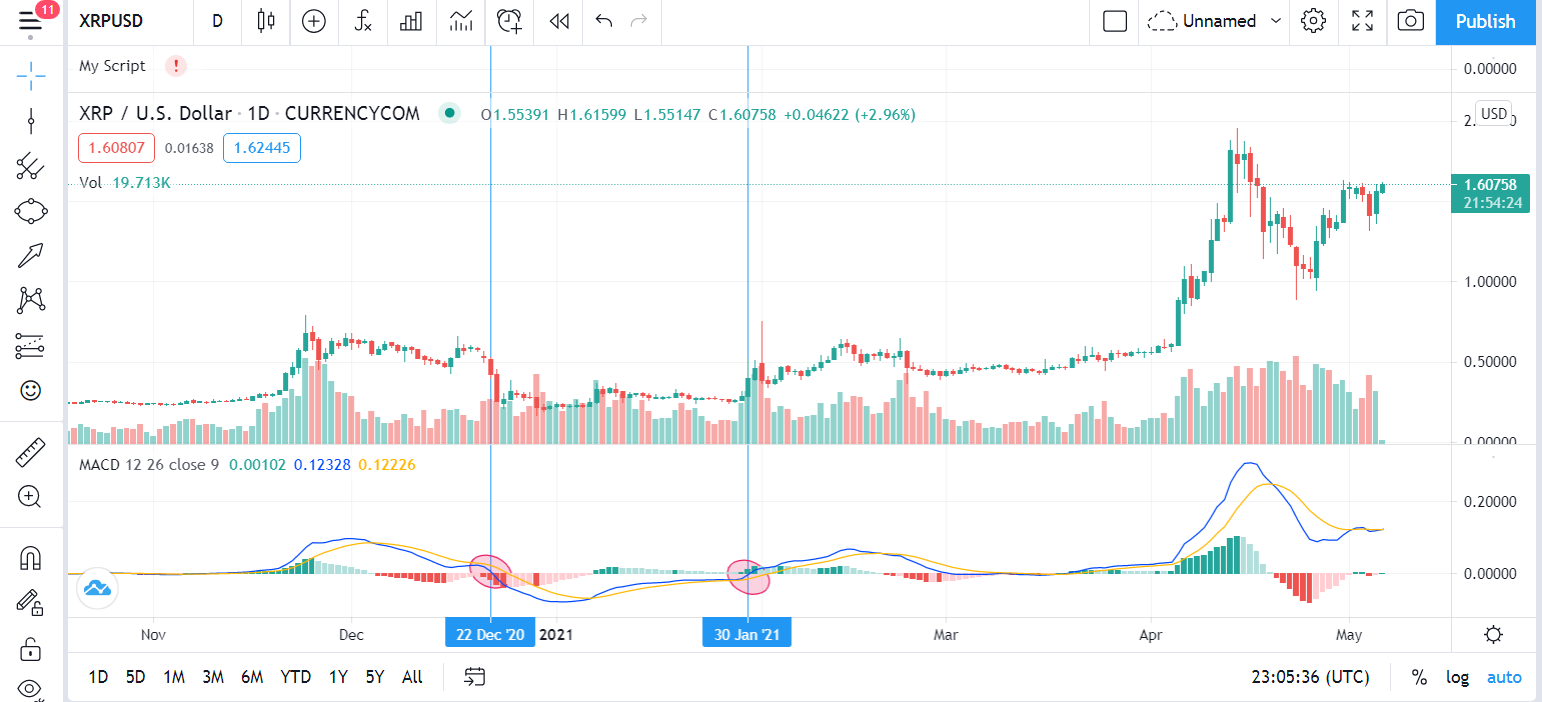
On the chart above, we see that the bearish crosses (in the direction of the trend) of the MACD beyond the zero line are followed by declines in the price of the Ripple.
- Reversal with the histogram
The MACD histogram can allow you to anticipate a trend reversal well before the signal line or MACD does. Instead of waiting for the histogram to go above or below the zero line, we can rely on the change in the slope of the histogram, let's see how.
As the market accelerates to the upside, the bullish bars on the histogram get longer and longer, this shows that the trend is strong. As soon as the market slows you will see the histogram stabilize before marking lower and lower bars from the top. The indicator signals a potential reversal of the uptrend.
Conversely, when the market is in a strong downtrend, the bearish bars on the histogram get longer and longer towards the bottom. As soon as this trend slows down, we observe that the histogram stabilizes before starting to mark shorter bars. This is a signal that signals a potential market turnaround.
In summary, when the histogram starts to converge towards the zero line after a strong bullish or bearish trend, we have a signal for a trend reversal.
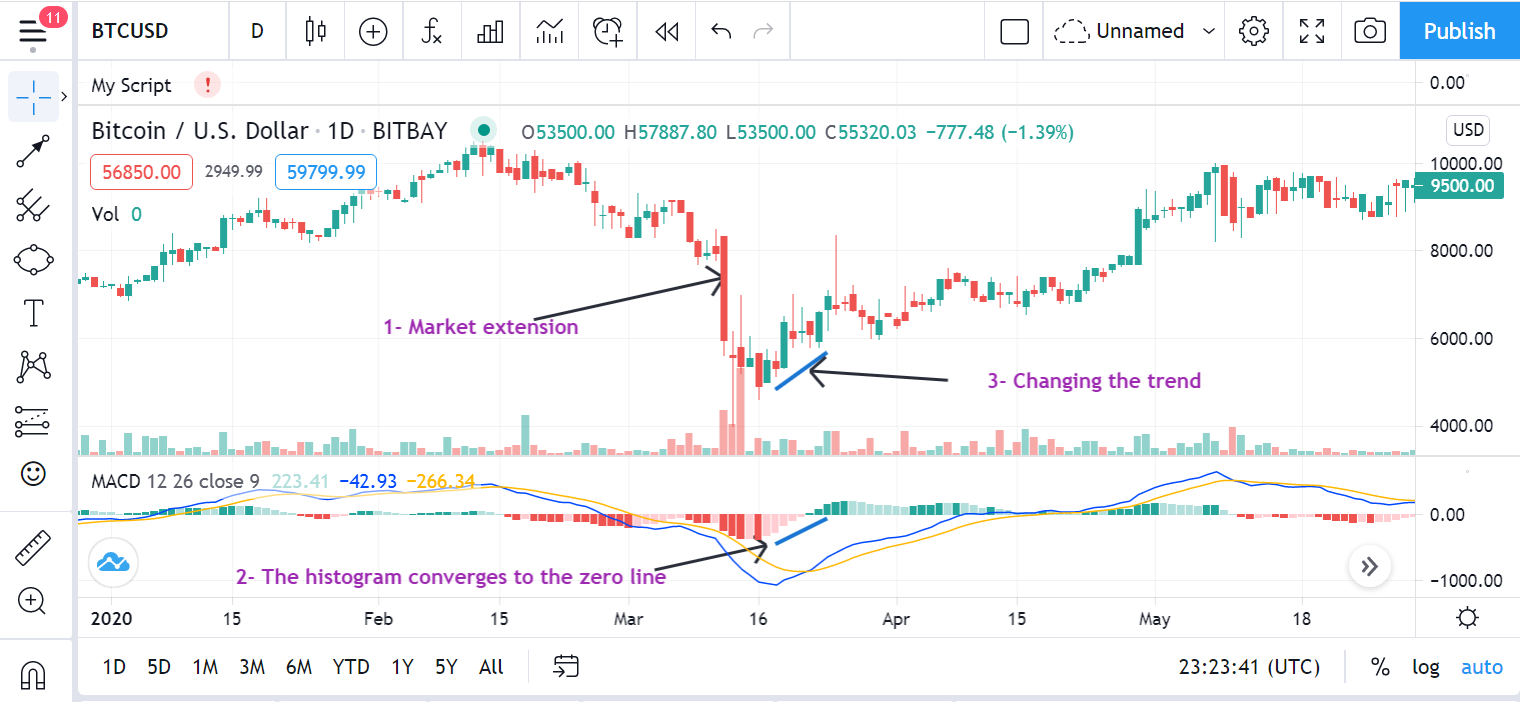
The BTC / USD pair chart above shows us the relevance of the histogram when it comes to anticipating trend reversals. The indicator indeed begins to converge towards the zero line even before the signal line crosses the MACD.
MACD indicator and divergences:
The MACD line usually follows the slightest fluctuation in price, so when the price reaches its peak, the MACD does too. When the price sets the first high and then the second high, the MACD should do the same. We talk about divergence when price points to a higher high or lower low, but the MACD line does not follow the pattern.
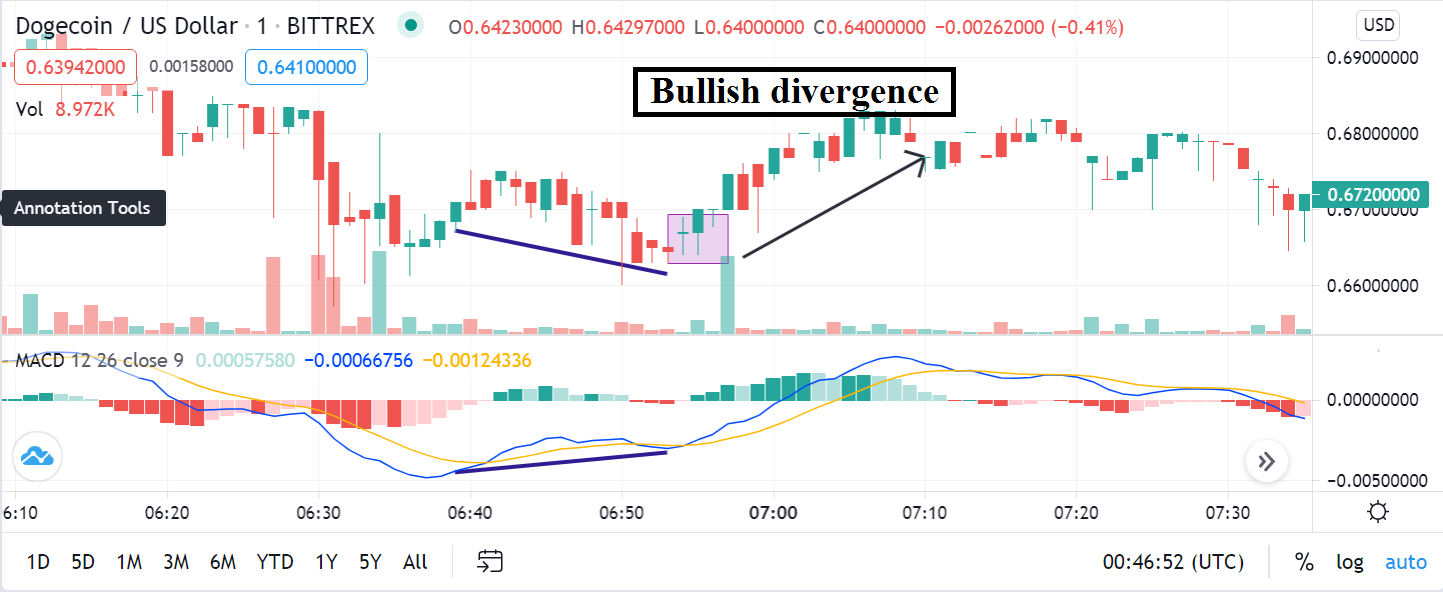
- Bullish divergence :
A bullish divergence is materialized when the price trend is bearish and the indicator indicates a rise from its lows.
To identify a bullish divergence, simply compare the low points of the price curve with those of the indicator.
If the price of the asset under study falls (Lower and lower) and the indicator progresses (Lower and higher), then we are in the presence of a bullish divergence, there is a probability strong so that the trend is reversed.
Below we see a bullish divergence on the DOGE / USD (DogeCoin) chart. While the price action marks a clear second low, the MACD meanwhile is lower than its first low. This divergence is then followed by a sharp rise in the price of DogeCoin.
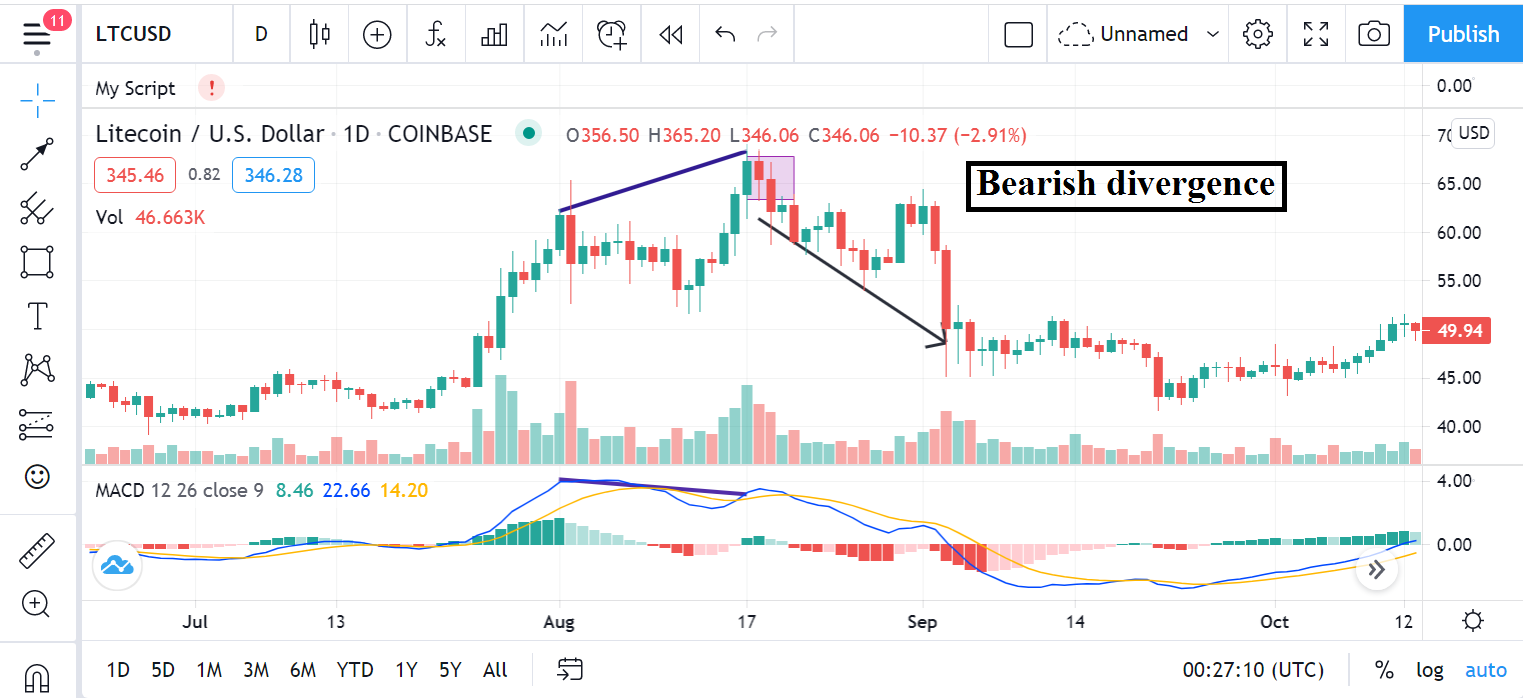
- Bearish divergence :
A bearish divergence is materialized when the price trend is bullish while the indicator indicates the opposite.
The indicator no longer achieves new highs while prices still have them.
To identify a bearish divergence, simply compare the high points of the price curve with those of the indicator.
If the price of the analyzed security progress (Higher higher and higher) and the indicator falls (Higher lower and lower), then we are in the presence of a bearish divergence, there is a strong probability that the trend turns around, as you can see in the example below:
Stop Loss Using MACD Indicator
When using the MACD indicator to open a trade, you must maintain your position using the stop-loss order. For this process to be effective, you need to know the previous price movements in the chart.
If you want to open a long position, you need to put your stop-loss order below the previous low on the chart. Otherwise (a short position), you must place this stop order above the previous high. This way if the price reaches one of these levels, the trade will be closed automatically, which protects your account.
An example of a MACD crypto trading strategy :
Let's take the 4 hour chart for the pair Litecoin / Bitcoin, which contains MACD lines and histogram :
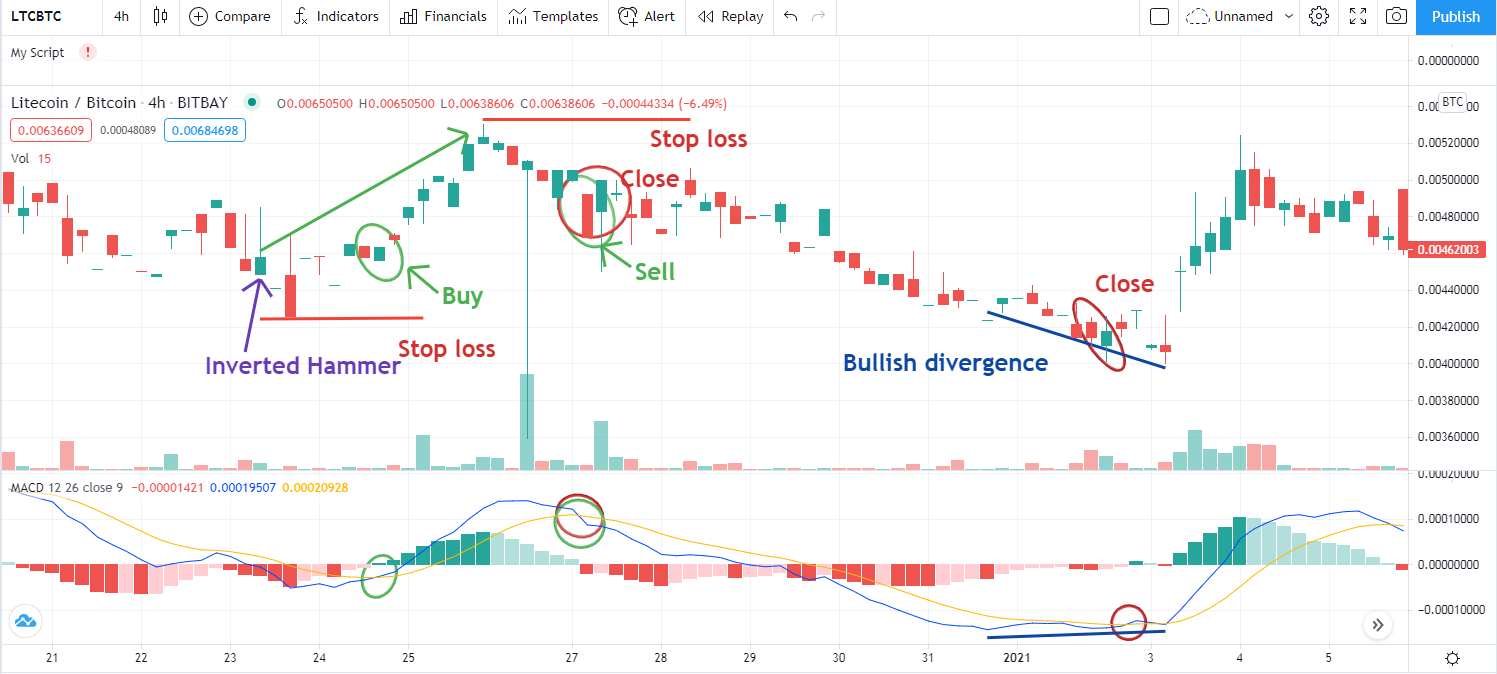
The first signals to trade with the price action started the inverted hammer candle pattern following the downward movement. Let's see a bullish crossover of the MACD lines after a few candles. Consequently, the presence of these two converging signals confirms an excellent opportunity to enter a long position(buy) on the LTC / BTC currency pair, as we explained in the first green circle on the price chart, and the stop-loss order must be placed below the bottom that the price formed at the moment of reversal.
After that, we notice the rise in the price movement of the pair, which would be the best exit point. We are witnessing a reversal downward movement followed by a breakout of the trend line. In parallel, the MACD lines are crossing in a downtrend. This can be considered as two separate exit signals, albeit a little late. Despite that, we find that the deal, in the end, will remain profitable despite the lack of it.
Eventually, a new downtrend is formed with the MACD lines also decreasing. After a few days of decline, both MACD lines form a lower high, while the price action is still down which forms a bullish MACD divergence on the chart. For this, it is wrong to quit while the MACD lines have crossed above. This happens after just a few candles, confirming the bullish divergence pattern.
Conclusion :
The MACD is suitable for all types of traders. Whether you are an aggressive trader wanting to anticipate trend reversals, or a conservative trader waiting for confirmations, you will always find your account with this indicator. Traders waiting for confirmation of the reversal will be able to rely on signal line crossings, while those who want to enter the market earlier at a better price can anticipate the reversal with the histogram.
Divergences, even if they are less easily spotted, should also be taken into account, as they can give powerful reversal signals. Finally, it is important to note that MACD signals are, on the whole, more relevant in long-time unit charts such as 4 hour and daily charts.
Homework Task 6 :
- What is the MACD indicator simply? Is the MACD Indicator Good for Trading Cryptocurrencies? Which is better, MACD or RSI?
- How to add the MACD indicator to the chart, what are its settings, and ways to benefit from them? (Screenshot required)
- How to use MACD with crossing MACD line and signal line? And How to use the MACD with the crossing of the zero line?
- How to detect a trend using the MACD? And how to filter out false signals? (Screenshot required)
- How can the MACD indicator be used to extract points or support and resistance levels on the chart? Use an example to explain the strategy. (Screenshot required)
- Review the chart of any pair and present the various signals from the MACD. (Screenshot required)
Rules :
Try to read the lesson and the assignments carefully before you start editing.
You must write an essay that contains at least 300 words.
Make sure that you post your homework into the SteemitCryptoAcademy community.
Use copyright-free images with mention of its source, if possible, produce your own.
Plagiarism is forbidden in Steemit Crypto Academy, and its perpetrators may face serious penalties.
This homework assignment will run until 22th May'2021, Time- 11:59 PM UTC.
Include in your post among the first five hashtags #kouba-s2week6 and #cryptoacademy.
For users who are powering down, they will not be voted and considered excluded from participation.
Additionally, users with a reputation below 50 and/or haven't at least 100 SP in their wallet won't benefit from voting for their homework.

Cc:-
@steemitblog
@steemcurator01
@steemcurator02
Hello professor @kouba01, please here's my homework.
https://steemit.com/hive-108451/@bountyking5/steemit-crypto-academy-or-trading-with-the-macd-indicator-homework-task-for-kouba01
Thank you professor this is my homework post.
https://steemit.com/hive-108451/@loveth01/crypto-academy-week-14-or-homework-post-for-kouba-or-macd-indicator-or-by-loveth01
Hello prof. @Kouba01,
I want to participate on the task contest. But there is no chance for participating for me because my reputation is below 50 and my sp is below 100. I am new user on this plateform. So please tell me the way of increasing sp or reputation. And also tell me another way to participate in these task.
Try to join the newcomer community and complete execution tasks to learn more about the platform and build your reputation before joining the academy.
Excellent homework Professor @kouba01. I will do my best to excel in this assignment. Excellent content and explanation of one of the most complete indicators of technical analysis.
Financial Markets Analyst.
@lenonmc21
Here is my homework professor
https://steemit.com/hive-108451/@erode/steemit-crypto-academy-season-2-week6-homework-post-for-kouba01-cryptocurrency-trading-with-macd-indicator
Hola profesor @kouba01, gracias por su excelente conferencia.
Buenas dias profesor @kouba01 saludos por aquí estoy nuevamente cumpliendo con su asignación espero estar acertado.
https://steemit.com/hive-108451/@adriancabrera/steemit-crypto-academy-temporada-2-semana6-or-comercio-de-criptomonedas-con-indicador-macd-por-kouba01-participante
Hello my homework task
https://steemit.com/hive-108451/@fombae/crypto-academy-week-14-homework-post-for-crypto-professor-kouba01
Saludos estimado Profesor @kouba01 aquí dejo mi tarea esperando contar con su Evaluación
https://steemit.com/hive-108451/@decuartae/steemit-crypto-academy-temporada-2-semana6-kouba01-or-comercio-de-criptomonedas-con-indicador-macd-pot-decuartae
Penyerahan tugas pekerjaan rumah untuk professor @kouba01
https://steemit.com/hive-108451/@cbkkeken/steemit-cryptoacademy-homework-task-for-kouba01-or-or-macd-crypto-trading