Steemit Crypto Academy Season 3-Week 1 | Trading Crypto With Ichimoku-kinko-hyo Indicator - Part 1
In its third season, our academy SteemitCryptoAcademy welcomes all participants wishing to develop their knowledge in the field of cryptocurrency and blockchain, and researchers to excel in writing high-quality content. After we achieved success in the past two seasons, our team is always looking for development and research to benefit the largest possible number of members of our platform Steemit, so you find many radical changes that will enable you to participate through stages and without exclusion. Now the ball is in your court, and all you have to do is diligence and perseverance to reach what you aspire to. So Be unique..Be creative!!
After covering several technical analysis indicators, namely the RSI, MACD and Bollinger bands in the previous 2nd season topics, and explaining how important they are in cryptocurrency trading, we are back in the first week of Season 3 with a new indicator called Ichimoku Kinko Hyo, which is a very important indicator due to its unique characteristics compared to other indicators, so it needs to focus on understanding it and how to use it, that's why it will be presented in three consecutive lessons so that we can analyze and in-depth all its components and uses when trading appropriately. So I wish everyone a good reading and excellent work.

Indicator overview:
You will not believe when you learn that this wonderful indicator was invented by a Japanese journalist named Hosoda Goichi, and that this man started working on developing this indicator before World War II when he gathered a number of students known for their talent in mathematics and equations to try out many time-dependent equations and arithmetic averages.
And you might be surprised that this system, despite the uproar over it in Asia, has been virtually non-existent in Europe for over twenty years. It did not begin to appear and be used in analysis and speculation in the West until 1990 and after, but there is certainly a rationale for this, the book that was published was in Japanese and there was no information on this indicator in English.
Now, in the twenty-first century, the indicator began to be used, understood and applied correctly in the West, because they began to understand its power, efficiency, flexibility and applicability to all different markets.
Explanation of the name of the indicator :
If we want to get the literal meaning of the indicator according to the Japanese language, it will be the balance chart from one look. The title may seem a little difficult to understand or a bit ambiguous.
The inventor of this Japanese indicator was very interested in the idea of balance. From following the actions of groups of people and human behaviors, he noticed that humans and groups of people in their normal life sometimes act some abnormal or out of the ordinary behavior, but soon they return to the normal situation, which is the state of balance, and thus it can be portrayed Human behavior is that it revolves within a circle, where the farther away from the equilibrium position, the origin of the circle attracts him to return to the equilibrium position, and so on.

What makes this indicator distinct from other indicators?
1 - The system is based on trading using the trend, and of course, everyone knows that the basis of success in any market is to trade with the general trend in order to profit from it and get out of it.
2 - The indicator gives us a complete picture of the evolution of prices on the market. It consists of several components, each of which provides us with specific market information. Therefore, when collecting the data of all the components of the indicator, we can see the general picture of the market that we are analyzing and just get the smallest details.
3 - The system is visual in the sense that you don't need to plot channels or trends or classic analysis or write numerical equations or anything. Once you take a look at the indicator, you will know if there is a trading opportunity or not and you will be able to extract a lot of information in just a few seconds.
4 - We also know that as some including technical analysts say, we should use a set of indicators as indicators to confirm exit and entry, trend indicator, extract support and resistance, etc., but one of the characteristics of this indicator is that it allows you to distinguish between high probability and low opportunities without the need for other indicators.
The Ichimoku indicator consists of five components, each with its own different characteristics, importance and data that we extract from it unlike any other component of the indicator. Thus, we cannot consider the limit of the content and neglect the rest; Otherwise, our point of view will be narrow. But if we collect the data that we have extracted from all the components of the indicator, we will have a complete and clear picture that is sufficient to know and interpret the price movement accurately and enjoy the benefits of the indicator.
Indicator components and their own formula:
The 5 lines that make up the indicator can be divided into 3 groups:
- The Tenkan-Sen and the Kijun-Sen
These are lines that correspond to the median level between the low and the high of a certain period, they may be related to moving averages but they are not. The calculation formula is as follows: (Higher + Lower) / 2. The division is done on 2 and not on the number of periods as for a moving average.
In addition to the mathematical difference, on the graph, they form levels (straight horizontal lines) if there are no new highs or lows over the period, which, as we will see later, represents levels. very useful supports and resistances.
Tenkan is calculated over 9 periods and Kijun over 26 periods.
- The Senkou Span A and the Senkou Span B
The particularity of these two lines is that they are projected into the future and like the Tenkan and the Kijun, they also form landings. They work together but their calculation methods are different.
Senkou Span A, known as SSA, is an average of the Tenkan and Kijun lines projected 26 periods ahead, in the form of an extension. The calculation formula is as follows: (Tenkan + Kijun) / 2.
Senkou Span B, known as SSB, is the median of the highest and lowest of the last 52 periods, and projected 26 periods into the future, as an extension.
The calculation formula is as follows: (Higher + Lower) / 2.
It is calculated like the Tenkan and the Kijun but over 52 periods and it is projected 26 periods ahead.
The area between these two lines represents what is called the cloud, which is usually colored on the graph.
- The Chikou Span
More commonly known as Lagging Span because it simply represents the 26 periods lagged price line (the price chart with 26 lagging periods, a “photo” of the past).
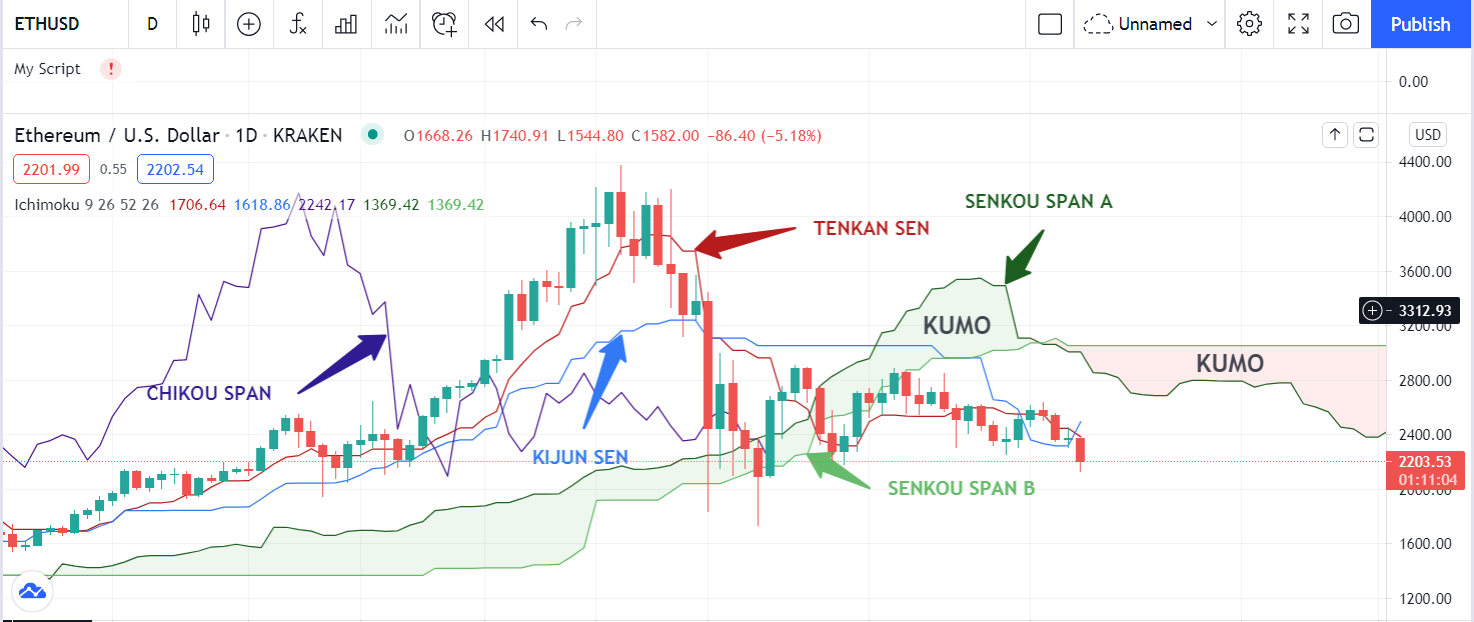
On the graph above, we have added the Ichimoku indicator, you can see that it consists of 5 curves of which 2 form a cloud called Kumo .
Ichimoku Kinko Hyo indicator Settings: :
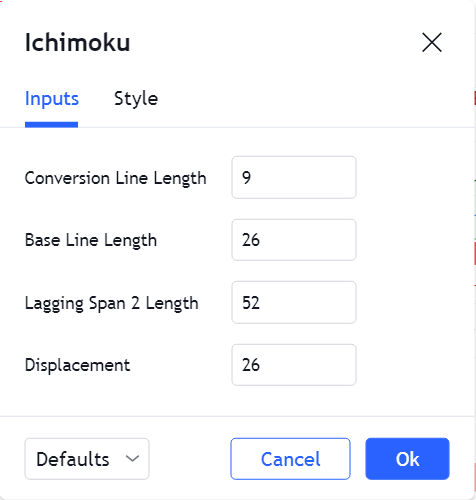
It is important to understand that the 9, 26 and 52 day periods are not final or fixed.
Indeed, many experienced traders have since adopted Goichi Hosoda's system by changing the periods as they see fit. Among the most popular are the basic settings (10, 30, 60) or (20, 60, 120).
Each of these versions aims to follow the evolution of a specific market so that the results are as relevant as possible. Remember, the initial basic settings of Ichimoku were not chosen by chance. Above all, they respond to a social reality, since at the time of its creation in Japan, Saturdays counted as a full working day of business.
Therefore, the 9 of the basic system symbolized the period of a week and a half (6 + 3), while the 26 signified the number of trading days per month (excluding Sundays), and the 52 the period of 2 months.
While all these characteristics seem logical in Japan, it also seems logical that European traders want to grab other parameters. Each market evolves according to its own composition, its local rhythm and under the global influence.
Handling the Tenkan Sen line (Conversion Line):
Although some may compare this line with the simple moving average 9 (SMA9) line, but there is a big difference between them because it measures the average of the highest and lowest candles, unlike the simple moving average line which measures the price average closing.
Below is an image showing the difference between them:
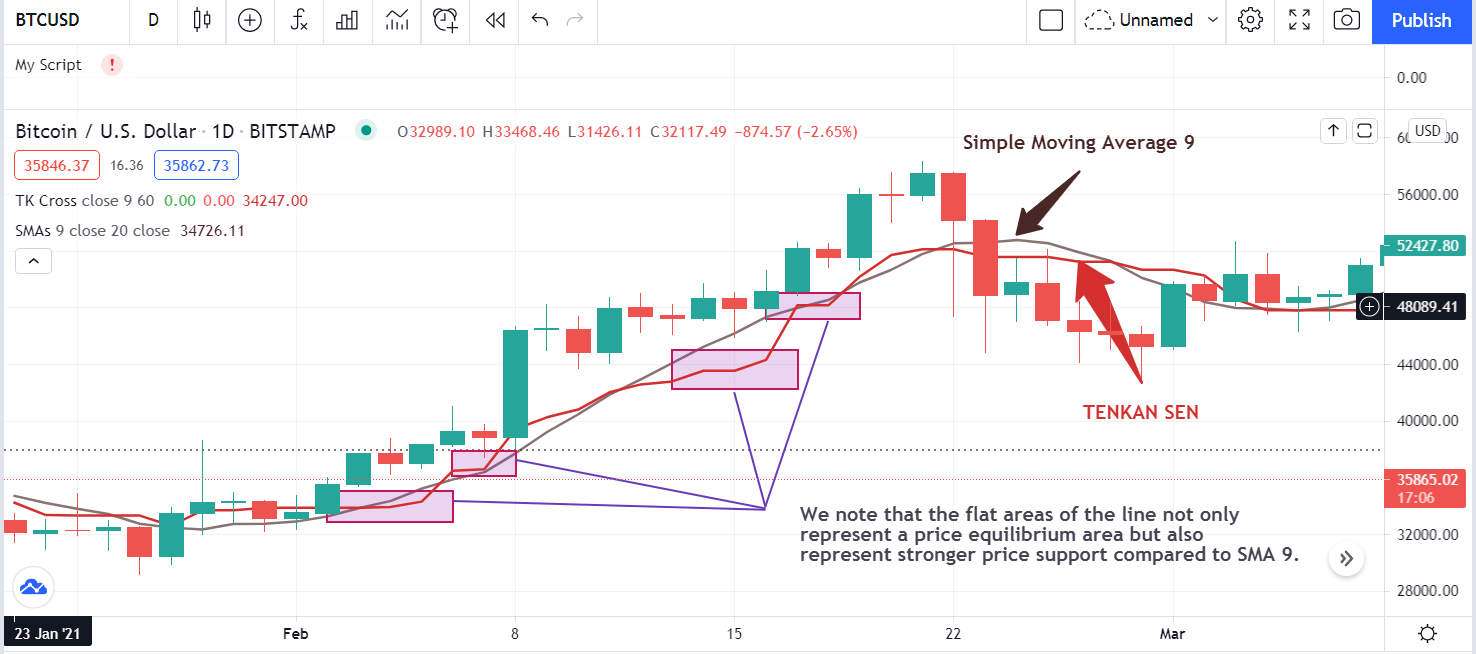
As we mentioned before, all the components of the indicator are concerned with the point of equilibrium, which is represented by this line in the flat spaces, and therefore we can make the following observations on the differences between the two lines as following :
First observation: While we sometimes see the Chimoku tenkan line appearing as a straight line, the simple moving average line does not. In this case, the Tenkan line does not express any clear trend over the past 9 candles, as it measures the average of the highest and lowest if the line is straight, and therefore is the midline between the highest and the lowest. lower, which gives us the impression of no trend, unlike the simple mobile version, as it depends on the closing price of the candle, and therefore the reservoir is more price sensitive.
Second observation: The tenkan line represents stronger support for the price compared to the simple moving average, because the price managed to penetrate the moving average more than it penetrated the tenkan line, due to the equation on which the line was built, which was carefully observed so that it was less likely to be affected by minor changes that occur in the price so that it represents support for the price in the event of a rise, and in If it falls, the line above the price will certainly represent resistance to that as well.
Third observation: The tilt angle of the Tenkan line gives us a special impression of the speed of the price movement or acceleration in what is called the moment, so we come back to the fact that the angle is very sharp in a simple time, and this is proof that the price has moved very quickly in that direction for a short period of time, while on the contrary if the angle is obtuse and the line is semi- right or right, this indicates that the price is moving slowly.
In the trend indicating slow speed or acceleration, while Tenkan line and Kijun line measure the lifetime of the trend or short-term price trend, but the difference is that the Tenkan is measured for the 9 previous candles, while the Kijun is the previous 26 candles, so it gives the impression that it cannot be definitively trusted to determine the direction of the price movement with the same force as the rest of the components of the Ichimoku indicator, but despite this, when the price gets closer to that line, it gives an indication of the start of a possible change in the direction of the price, but this should include the rest of the signals from the rest of the indicator components that will be mentioned so that we can look at the working image of his system to get a deep impression of the price action.
Although studying the relationship between the Kijun and Tenkan lines, when the Tenkan line intersects the Kijun line, it indicates a change in the direction of prices, and therefore there is a close relationship between them.
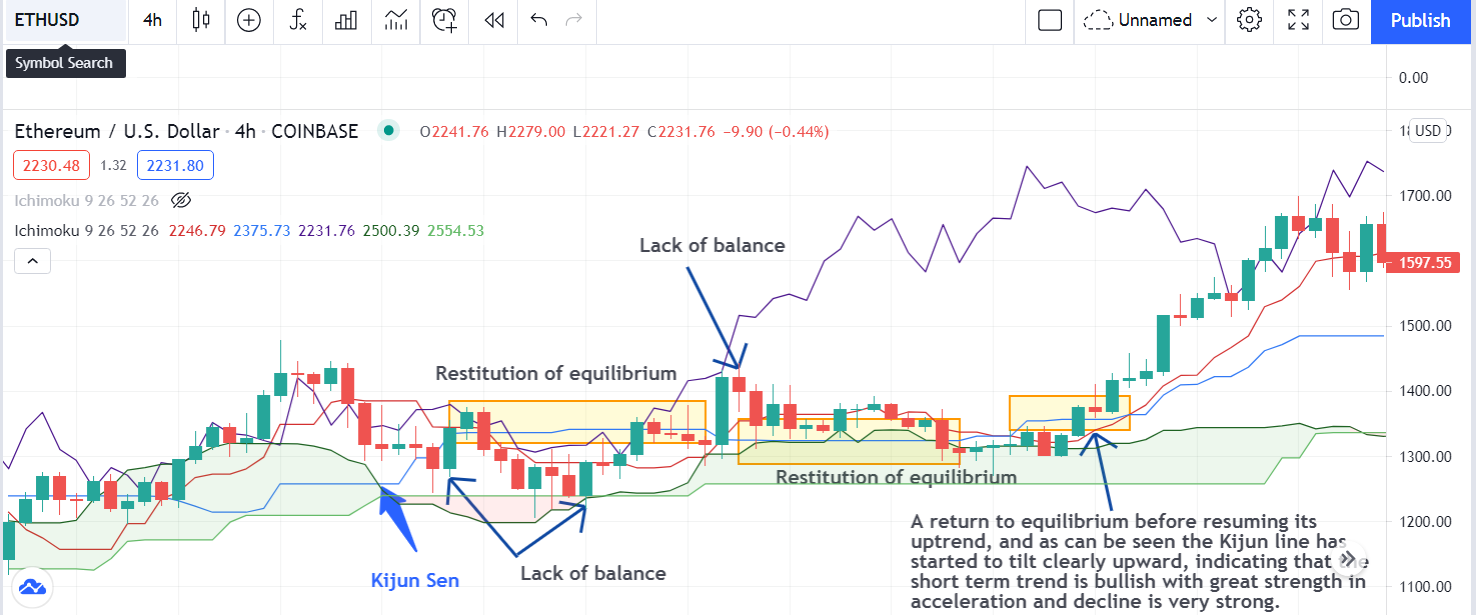
Handling the Kijun Sen line (Base Line):
And as I mentioned earlier, it is considered to be one of the strong aspects of the Ichimoku indicator, and as they call it in Japan, it is one of the strong horses of this indicator, and that depends on the same tenkan equation, but a longer period of time, which is 26 candles, and so this gives us the same tenkan data, but over a long period of time and more precisely, which makes it more reliable for determine the short term trend, and it expresses the equilibrium price more accurately and represents a support and resistance line with greater strength than the Tenkan also, and therefore, in short, stronger resistance and support and determines the trend more strongly by its slope and as before, it is a straight line in the absence of a trend.
It represents the midline and its slope angle, whether sharp or obtuse, because it indicates the acceleration of the price and therefore can be trusted and its data.
The following is a picture that shows the strength of the support or resistance that the Kijun line represents with the price movement:
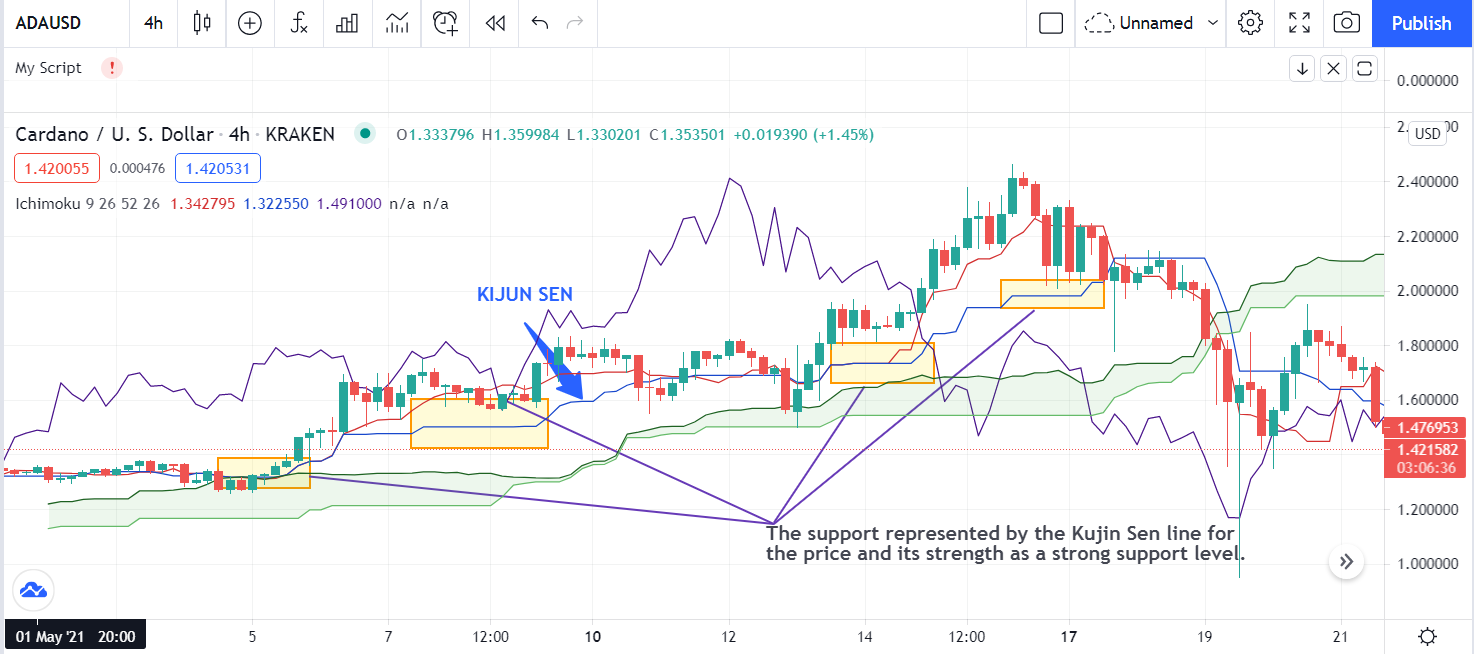
We notice that the price always tends to move away from the Kijun line for a while and then come back to it, which represents the balance as we mentioned before.
Therefore, we can notice that the price tends to fluctuate rapidly around the Kijun line moving away from it and approaching it, this is what can be called the eraser effect since when we use the eraser to erase all writing, we also move it back and forth.
This effect is specific to Kijun in particular, and it indicates that no matter how much the price goes up or down during its movement, it must return to the equilibrium position a bit before starting over, and the equilibrium position in which it attracts. a line kijun the price when the line is straight and then begins to fall so that one can know the direction of the short-term trend.
The following is a picture that shows the effect of the eraser and the price tendency to return to equilibrium from time to time.
It can also be taken below or above the Kijun line to place a stop loss for the transaction, as the Kijun represents strong support or resistance area for the price, so the deal can be taken after the Kijun begins to take a direction, whether up or down.
Handling the Chikou Span (Lagging Span):
The Chikou Span line is considered to be one of the most important features of the Ichimoku indicator, as it strongly supports decision making and knowing the direction of the price in a constant moment.
Maybe from the first moment, you see the line you say that it is unnecessary or confusing and meaningless, but when its usefulness becomes clear you will see that it is one of the very important lines and that that distinguishes this indicator.
As for the advantages of this line, they are as follows:
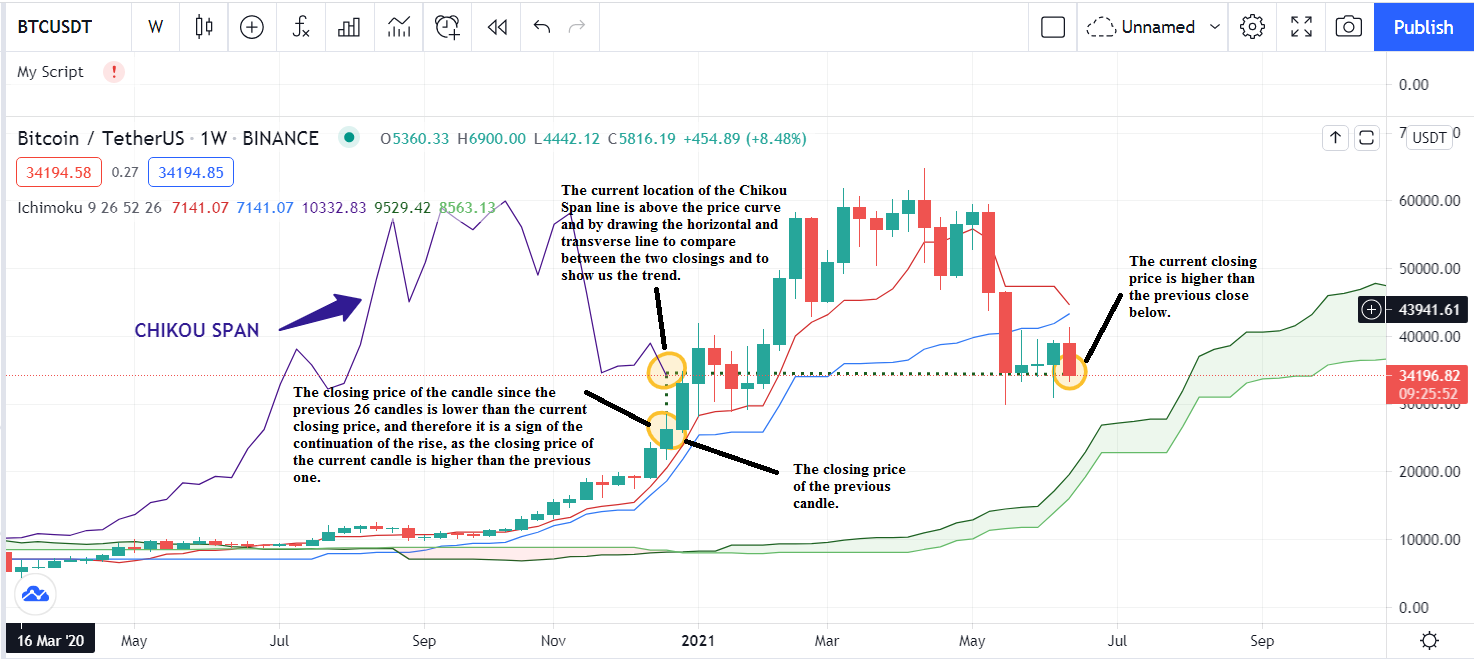
The First advantage:
By looking at this line and drawing two lines from its end, a horizontal line and a vertical line, we can tell if the current close of the current candle is higher or lower than the close of the 26th candle of the previous period, and by comparing them, one can know whether the trend is still upward or not.
As we note that the line has been retracted for 26 candles, and therefore we can compare the close of the current candle with the previous one, if the current close is above the close of this candle, it supports the upside and the the reverse is true even in the most volatile cases of price.
The following is an image that shows how to take advantage of this feature of the Chikou line knowing the trend and if there is a possibility of its continuation.
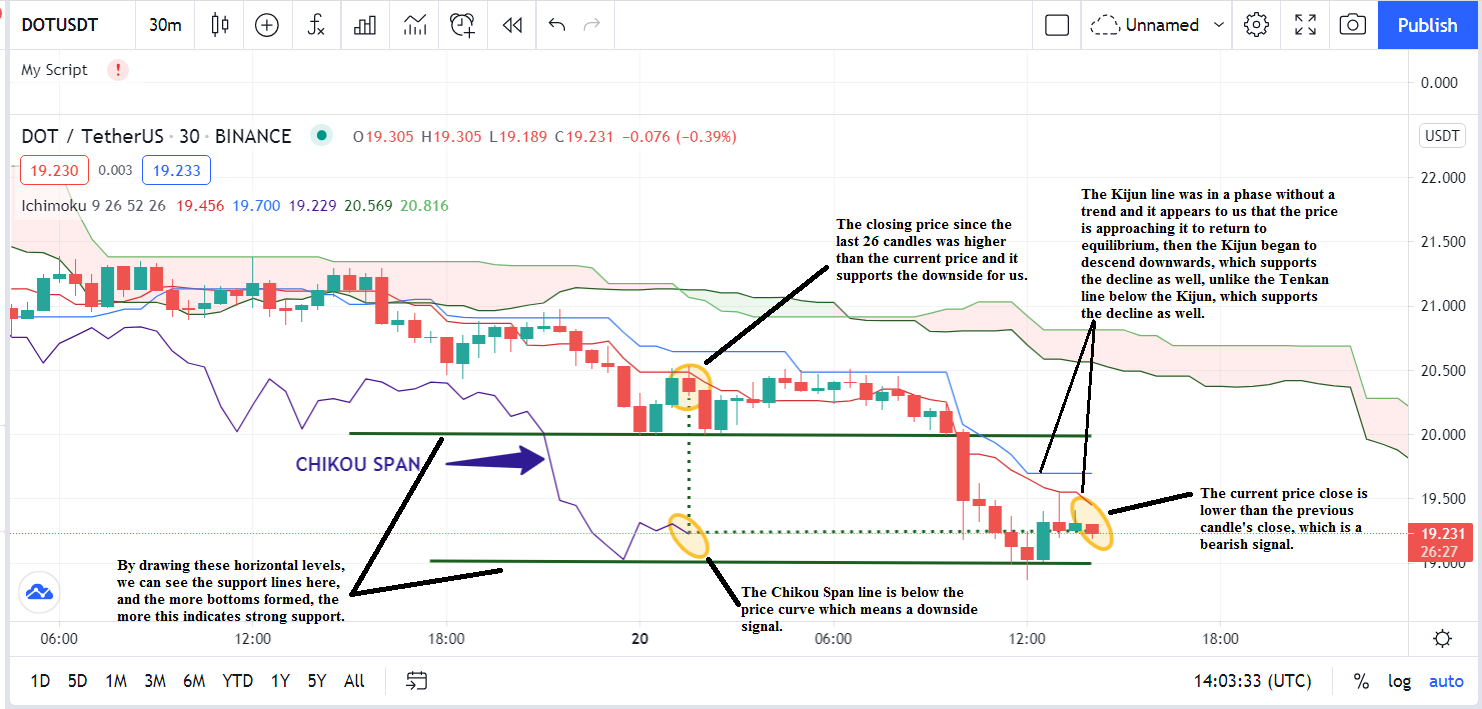
The second advantage:
Since this line depends on the closing of the current and previous candles during the price movement, it is affected by the price and follows it and shows us the areas, whether previous or current, in which the price has fluctuated and could not penetrate.
Thus, the Chikou line fluctuates and forms highs and lows, and cross lines can be drawn from these peaks to serve as support and resistance lines. The area is resistance or stronger support and therefore we can easily extract support and resistance lines and know the extent of their strength to help us make the decision when entering the trade.
The following is an image that shows how to use the Chikou Span line to know the trend, and the oscillation of the line at the bottom, it can be concluded that there is a support area.
The extent of the strength of the support or resistance line is determined by the number of peaks or troughs formed and also by what frame it formed, however, the price moved strongly from this area, which indicates greater strength.
Conclusion:
So far, and based on three of the five components, we have the following data:
- The moving support and resistance line with the price.
- Attractive areas for the price to return to the equilibrium position.
- The possibility of determining the stop-loss zone.
- Determination of the short-term trend from the slope of the Kijun line.
- Determination of the acceleration or speed of price movement in the direction by means of the slope of the kijun.
- Determine the direction, up or down, at the intersection of the Tenkan and Kijun lines.
- Determine the extent of the possibility of continuation of the trend and determine the intraday trend with the close of each candle.
- Extraction of supports and resistances and the extent of their force depending on the number of peaks and troughs formed in this area now or during the previous period and the severity of the bottom or top formed.
We now have the last two components of the indicator, that make up the cloud, which makes this indicator stand out a lot, and we will start talking about the two lines, and then we will talk about the cloud in detail in the second part.
Homework Task-1 :
1- What is the Ichimoku Kinko Hyo indicator? What are the different lines that make it up? (screenshots required)
2- How to add the Ichimoku indicator to the chart? What are its default settings? And should it be changed or not?(screenshots required)
3- How to use the Tenkan Sen line? How to use the Kijun Sen line? And How to use them simultaneously?(screenshots required)
4- What is the chikou span line? And how to use it? And Why is it often neglected? (screenshots required)
5- What's the best time frame to use Ichimoku? And what is the best indicator to use with it? (screenshots required)
6- Conclusion :
Rules :
Try to read the lesson and the assignments carefully before you start editing.
You must write an essay that contains at least 300 words.
Make sure that you post your homework into the SteemitCryptoAcademy community.
Use copyright-free images with mention of its source, if possible, produce your own.
Plagiarism is forbidden in Steemit Crypto Academy, and its perpetrators may face serious penalties.
This homework assignment will run until 3rd July'2021, Time- 11:59 PM UTC.
Include in your post among the first five hashtags #kouba-s3week1 and #cryptoacademy.
Users who are powering down will not be voted and considered excluded from participation.
Additionally, users with a reputation below 60 and/or haven't at least 500 SP in their wallet won't benefit from voting for their homework.

Cc:-
@steemitblog
@steemcurator01
@steemcurator02
Hola profesor @kouba, acá dejo el link de mi tarea
https://steemit.com/hive-108451/@clavel/steemit-crypto-academy-season-3-week-1-or-trading-crypto-with-ichimoku-kinko-hyo-indicator-part-1-tarea-1
Gracias por su atención
Mañana me pongo manos a las Obras con esta tarea, a parte son tareas con mucho probecho ya que no conocia este indicador tecnico
This is my first time hearing about this indicator. Your presentation and explanation is well understood. The Ichimoku-Kinko-Hyo Indicator seems to be a very strong indicator that looks complex to understand but once you pay attention to the lines, it comes easy. Nice one professor. I think I can shoot my shot.
Thank you.
Hello teacher @kouba01, can it be done in any language?
Yes of course.
A wonderful tool to learn that will help in your trading. Don't miss it guys.
Saludos execelente profesor tenerlo de regreso bendiciones ❤️
My homework
https://steemit.com/hive-108451/@chetanpadliya/steemit-crypto-academy-season-3-week-1-or-homework-post-for-kouba01-ichimoku-kinko-hyo-indicator-part-1
Hello professor @kouba01 here's the link to my assignment post.
Assignment
Hola Profesor @kouba01 que gusto volver a disfrutar de sus conferencias aquí dejo mi Participación de esta semana.
Esperando contar con su evaluación y comentarios.
https://steemit.com/hive-108451/@decuartae/steemit-crypto-academy-temporada-3-semana-1-or-comercio-de-criptomonedas-con-el-indicador-ichimoku-kinko-hyo-parte-1-profesor
https://twitter.com/editadecuarta/status/1409704118126403586?s=20
Saludos, estimados profesores @kouba01 @criptokraze deje mi enlace de mi Tarea el día de ayer y aun no recibo la evaluación. Agradezco mucho si pudieran revisar mi tarea. Gracias bendiciones.
https://steemit.com/hive-108451/@decuartae/steemit-crypto-academy-temporada-3-semana-1-or-comercio-de-criptomonedas-con-el-indicador-ichimoku-kinko-hyo-parte -1-profesor
Thanks for presenting this great lecture professor @kouba01. I have made my entry and I present the link to it below.
https://steemit.com/hive-108451/@fredquantum/crypto-academy-season-3-week-1-homework-post-for-kouba01-or-trading-crypto-with-ichimoku-kinko-hyo-indicator-part-1
Thank you.