Steemit Crypto Academy Season 3-Week 5 | Trading Crypto With Ichimoku-kinko-hyo Indicator - Part 2
Hello to all steemians, first of all, I would like to apologize for the long absence due to emergency health conditions, and also thank all my Academy supervisors for their understanding and support in these difficult times that allowed me to know the value of working within a community whose members are committed to helping each other so that lessons continue to be provided in the best conditions and benefit all students without interruption.
Today I come back to present the lessons and continue the second part of the explanation of the Ichimoku indicator, which we began to introduce in the first week of this season, its most important components and characteristics, to move to this second part to define the Kumo cloud and explain how to use it for cryptocurrency trading.
I wish everyone a good reading and successful work in answering the questions.

The Ichimoku cloud (KUMO):
The Kumo cloud is undoubtedly what gives all its originality to the Ichimoku Kinko Hyo indicator. Kumo plays a major role in reading and interpreting Ichimoku graphics. It allows us in the blink of an eye to have relevant information on the trend, whatever the Time Frame. Its projection in advance is a remarkable element. The lines that make up the cloud (Senkou span A and Senkou span B) indicate precise support and resistance levels.
The testing of each individual trade with Ichimoku is done through the cloud, and this is where you need to start. Tyler Yell, Forex Trading Instructor
The above quote perfectly sums up what to do in the first place when discovering an Ichimoku chart.
The cloud informs us at a glance about the market equilibrium.
In other words, the Ichimoku cloud immediately tells us whether the prices are in a trend phase or in a period of lateral drift (range).
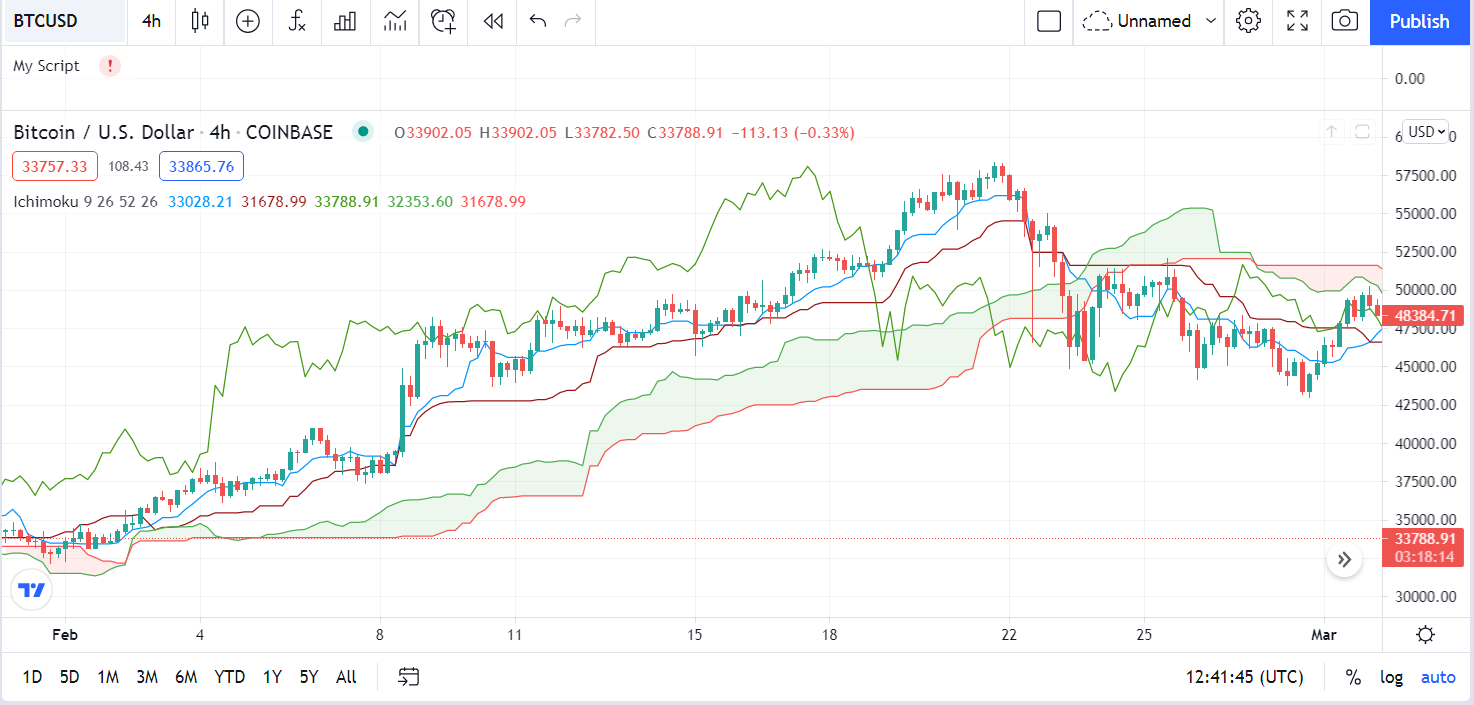
As the chart below shows, the cloud is perfectly trending upward. This indicates that the trend is unmistakably bullish. Based on this information the Ichimoku trader will look for buying opportunities.
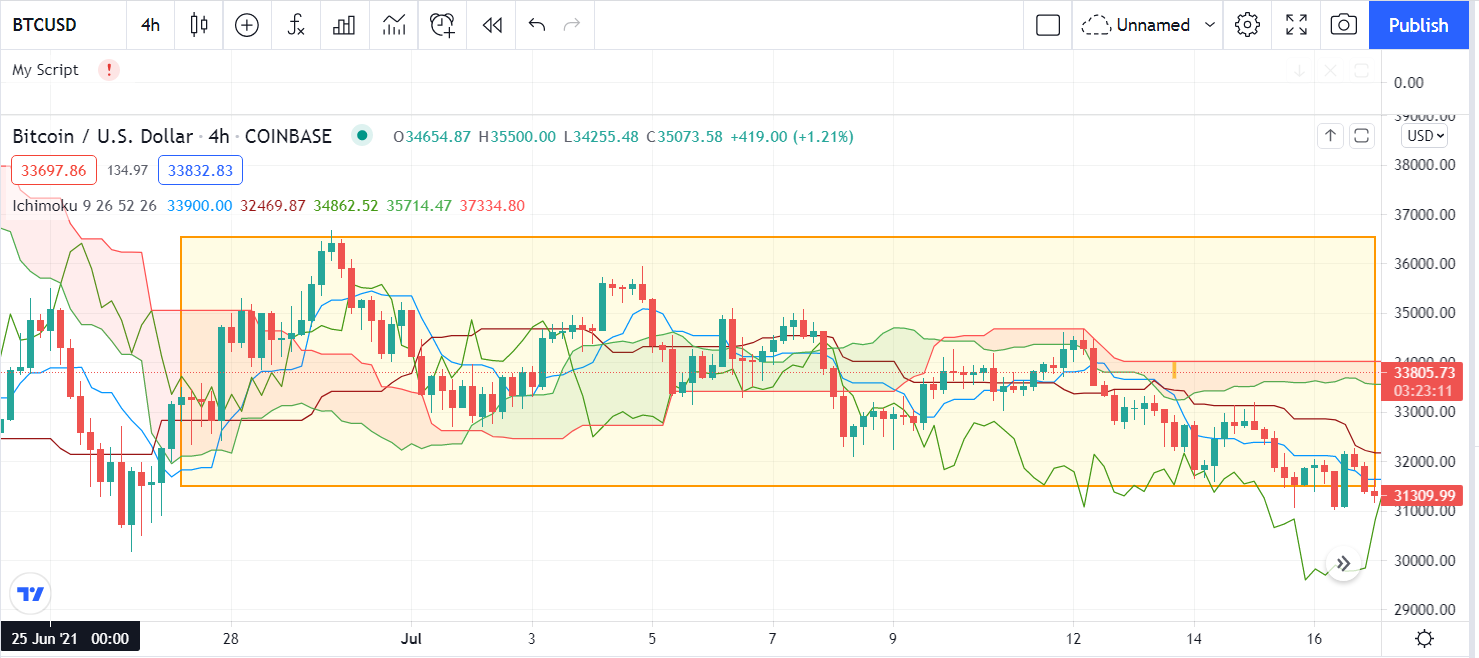
On the graph below the Ichimoku cloud (all the clouds) is flat and horizontal, this indicates that there is no trend, in other words, that the prices are drifting sideways (range). In range, Ichimoku is not used as in trend. The trader will seek to trade the range, the Ichimoku lines (in particular the SSB) will then be representative of the range equilibrium. They no longer play their role of support or resistance to prices and chikou span.
The Senkou Span A and the Senkou Span B:
In general, markets are bullish when the Senkou Span A curve is above the Senkou Span B line and vice versa for bear markets. The difference between the Senkou Span A and Senkou Span B curve is called the Ichimoku cloud.
Traders often watch Kumo's changes, when right-wing Senkou Span A and B trade their locations, as this foreshadows a signal for a trend reversal.
- The Senkou Span A (SSA):
It is one of the curves which materializes the Kumo point cloud making it possible to define the risk threshold.
Usually, the point cloud is used as support when the price is advancing above the cloud and resistance when the price is advancing below the cloud.
These curves can therefore be used alone to offer buy or sell signals in the same way as the crossing of a resistance or a support. This curve corresponds to the average distance between the Tenkan-sen line and the Kijun-sen line, represented over the medium-term period of the n periods back.
The value of the day of Senkou Span A corresponds to the distance which separates the curve Tenkan sen from Kijun sen over the medium term.
Formula of the graph Senkou Span A = (Tenkan sen + Kijun sen) / 2 over 26 periods backward, i.e. (Tenkan Line + Kijun Line) / 2 projected over a period of 26.
-The Senkou Span B (SSB):
This is one of the lines that form the “Kumo” scatter plot for determining the level of risk, this curve corresponds to the average distance over the long-term time interval 52 periods.
As for Senkou Span A, the indicator is plotted 26 periods back.
Formula of the Senkou Span B graph = (High Price of 52 periods + Low Price of 52 periods) / 2 there are 26 periods back, i.e. (the highest + the lowest) / 2 over the previous 52 periods, and extension of 26.
The twist:
Ichimoku is an analysis tool delivering immediate visual indications (see balance at a glance). As we have just seen in the previous definition, it is possible thanks to the simple observation of the global orientation of the clouds to know if the prices are in trend or range.
The twist also delivers crucial visual information that we will be able to use concretely in our trading.
The twist is the crossing of the two lines that form the cloud. In other words, the crossing of the SSB by the SSA. The appearance of a twist after a trend phase is the consequence of the weakening of the trend.
After a twist of the cloud, consider that the price is moving in a neutral trend as long as no directional trend is confirmed. To take advantage of a ranged market, a strategy of timeless success is to buy the low end and sell the high end.
You can do this by spotting the extremes of a range graphically, as soon as the twist occurs.
Determine the trend:
It is possible to distinguish the three trends with Ichimoku and more precisely by using only the cloud. Know then that if what you are looking for is a trend indicator and not a complete system, you can get rid of the other three curves.
You will notice that bullish and bearish price trends are often limited. For many seasoned traders, this represents an error that can endanger the capital of the trader who tries to enter at each trend reversal. It is estimated that the markets spend most of the time moving in a range, which means that trend trading should be limited to a third of the time to be optimal.
This is why it is recommended to also distinguish what is called a neutral trend. Ichimoku can be used to identify these three types of markets. Therefore, it makes it possible to take advantage of trending markets and those who wish to do so from ranging markets. So rather than wasting money most of the time trying to trade what is not a trend, you will be able to profit from all configurations: bullish, bearish and neutral.
A common mistake newbies new to Ichimoku make about this is to believe that only the relative position of SSA to SSB indicates the trend. In other words, the trend is bullish when the cloud is green and bearish when the cloud is red.
But let's think about it another way. At all times, the SSA is found above or below the SSB, rarely at the same level. However, neutral trends exist, so we cannot limit ourselves to this approach.
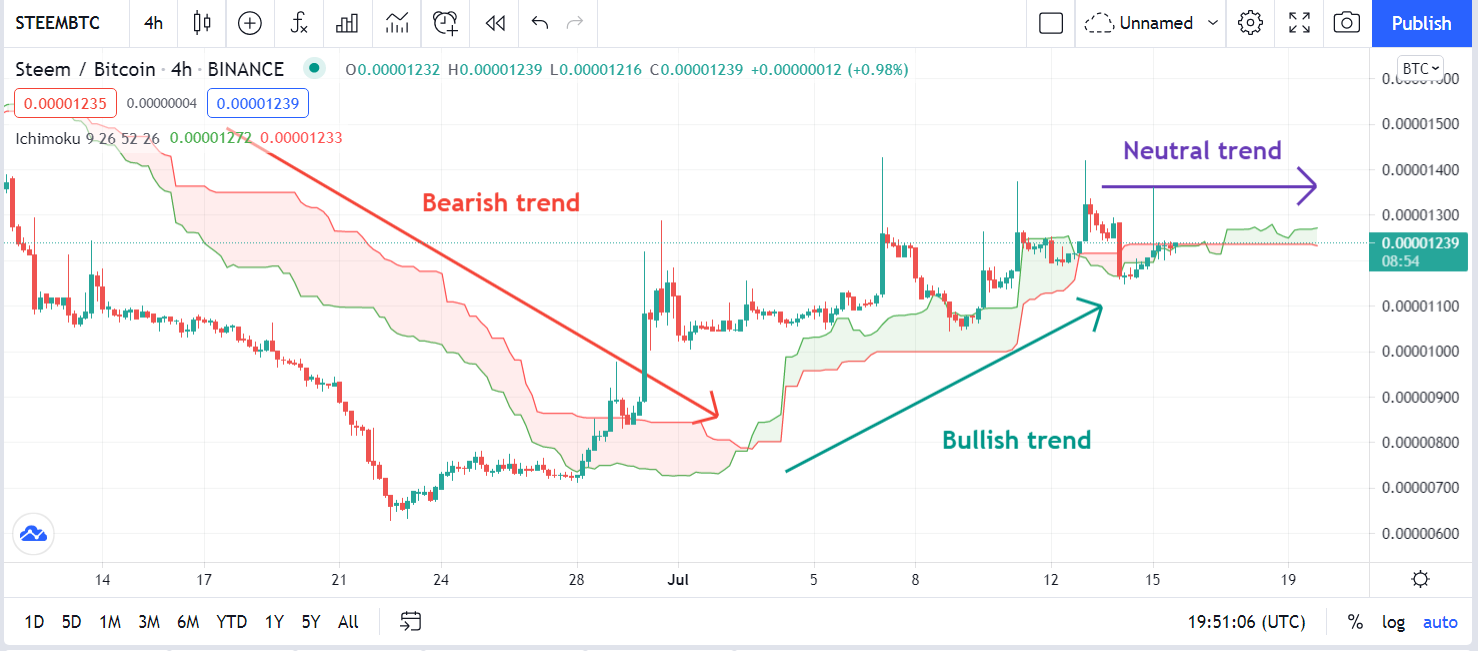
As shown in the graph above, the trends are distinguished by the orientation of the cloud or Kumo. When the cloud is trending upward, the trend is bullish. Conversely, when the cloud goes down, the market is bearish. And a neutral trend is seen by the presence of a relatively flat cloud.
Detect a trend reversal:
It is important to note that the cloud is drawn in real-time 26 periods ahead of the current price. So we should not equate the information of the past with the state of the cloud on the same date. Always take the lag into account or you might think the Kumo is way behind in detecting trend changes.
The first sign of a trend reversal is the twist. But as we have seen before this signal alone can often lead to a range or a correction of the previous trend. This is why other elements must confirm the trend.
There are also 3 additional signals that can really confirm the change in trend. Two examples of confirmed bearish trends are shown on the BTC/USD chart below.
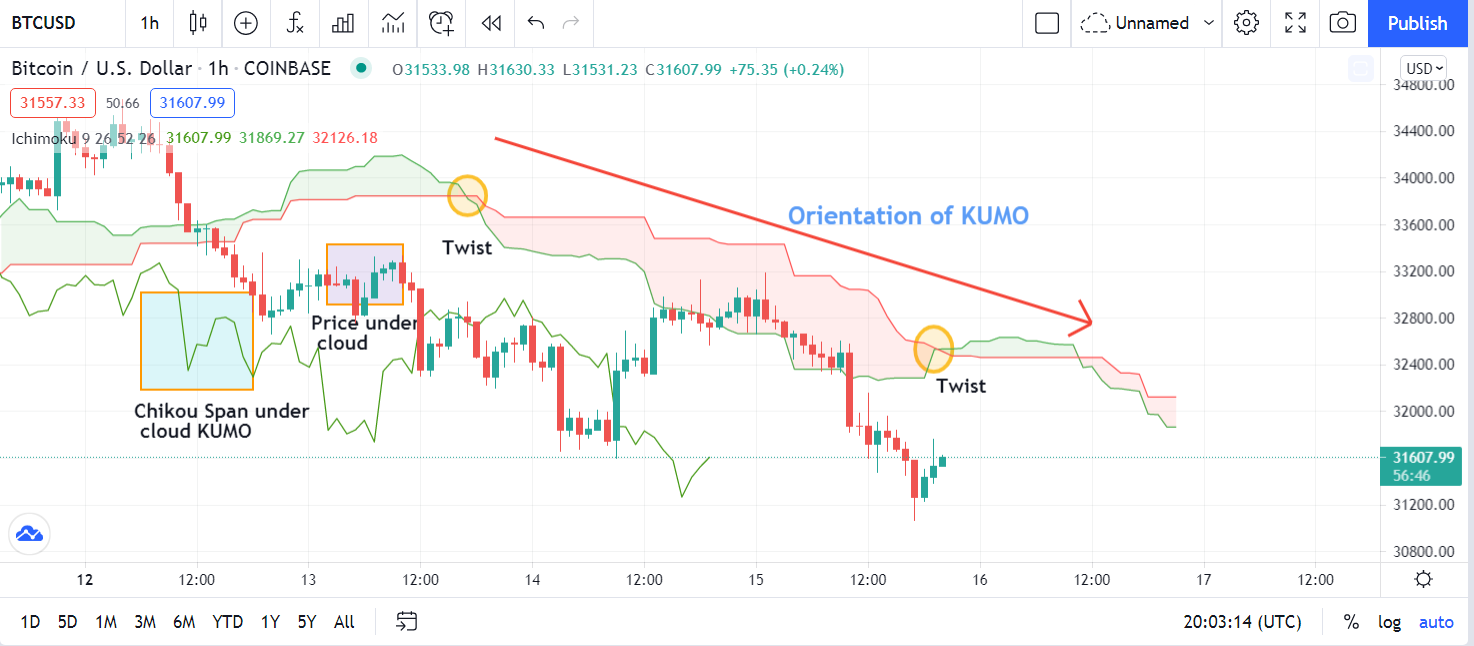
The first is the entry of price action into the cloud. If the price changes in the Kumo, he will have to wait until he decides to break it. Indeed, as we will see later, the plates formed by the Senkou Span often act as supports and resistances.
The second element of confirmation is the Chikou. It too must have broken the cloud in the direction of the trend. Ichimoku traders tend to view the Chikou-span as the ultimate confirmation as they notice that it often bounces off obstacles. They can be supports and resistances, but also dishes formed by Senkou Span or Kijun.
Finally, the last confirmation signal is the orientation of the cloud. The slower curve being the SSB, we have to wait for it to move in the direction of the trend. When all of these elements come together, we can expect a strong trend.
The cloud as a very strong indicator of support and resistance:
The cloud differs from the indicators and the traditional support and resistance lines, and thus it can be relied upon and trusted to a much greater extent, as it depends on the historical data for the previous 26 and 52 candles with displacement to the future and the presence of equilibrium areas for the price to which it is attracted.
The following is a picture that shows how the price, when it entered the cloud area, respected the Senkou-Span A and B lines as support and resistance lines several times in a row (range).
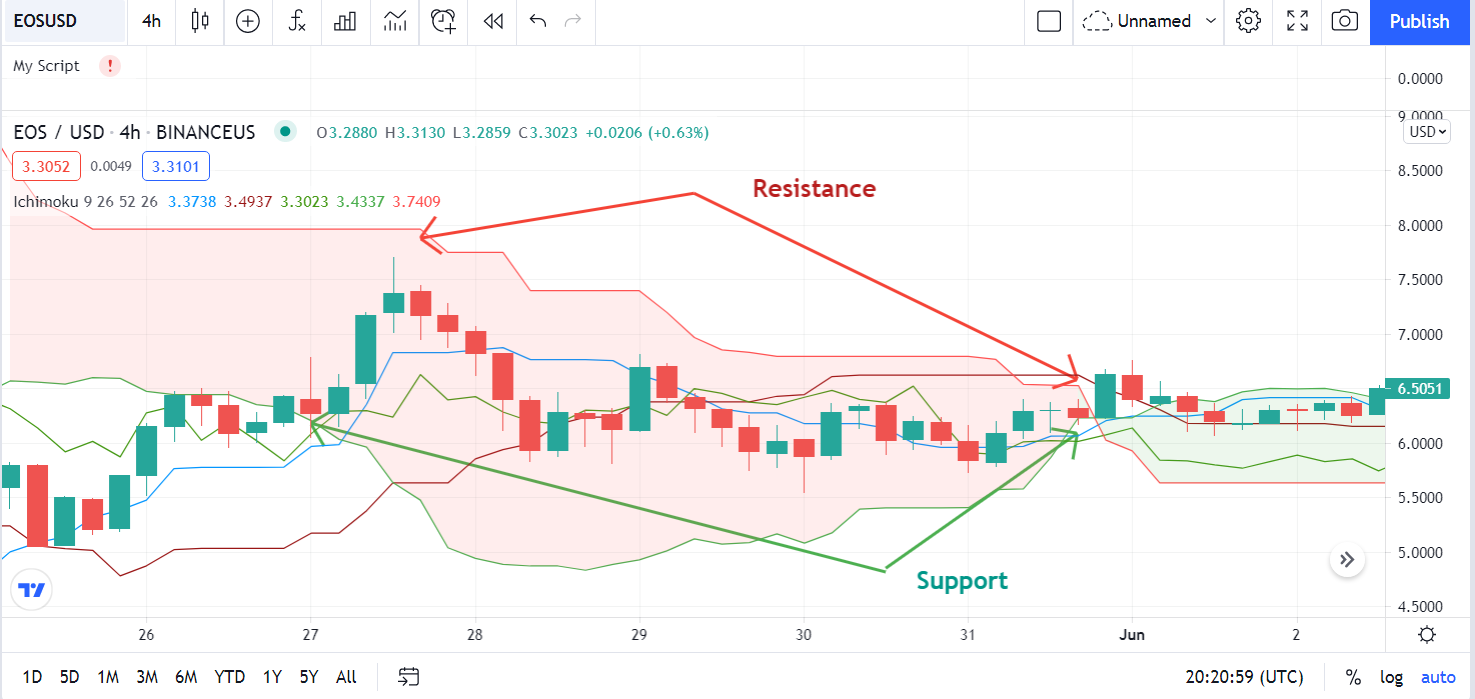
The strength of this indicator becomes clearer, especially when we compare this principle in supports and resistances compared to resistance with the classical analysis or the traditional view of supports and resistances.
Below is a picture to explain the difference more precisely.
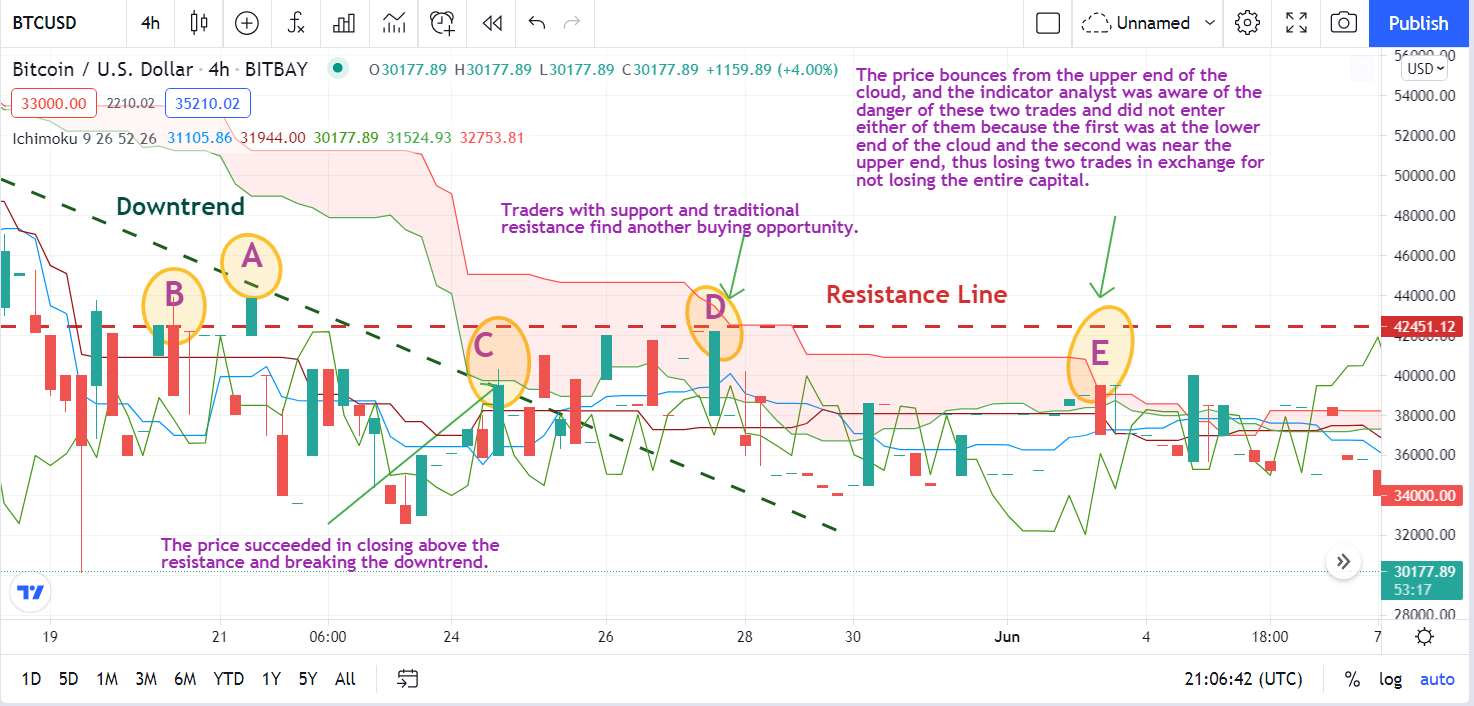
In the image shown above, a trend line or a descending trend line A was drawn, and there was price resistance at B, and the resistance line was drawn, and when the price reached point C, it broke the downtrend and succeeded in closing above the resistance and thus became support.
The trader who uses the traditional lines will think of entering a buy, and when he enters he will be surprised by the price drop immediately and the loss will take place, unlike the analyst who uses Ichimoku, who was clear in front of him that it is near the cloud area, whose ends are the Senkou Span A and B lines representing strong resistance and support, and within it an area Without a trend, he would have waited and would not enter the deal.
Hence, the difference between the classic view of support and resistance and the Ichimoku view is that support and resistance are defined as an area and not as lines.
The relationship between the magnitude of price movement and its volatility and the cloud:
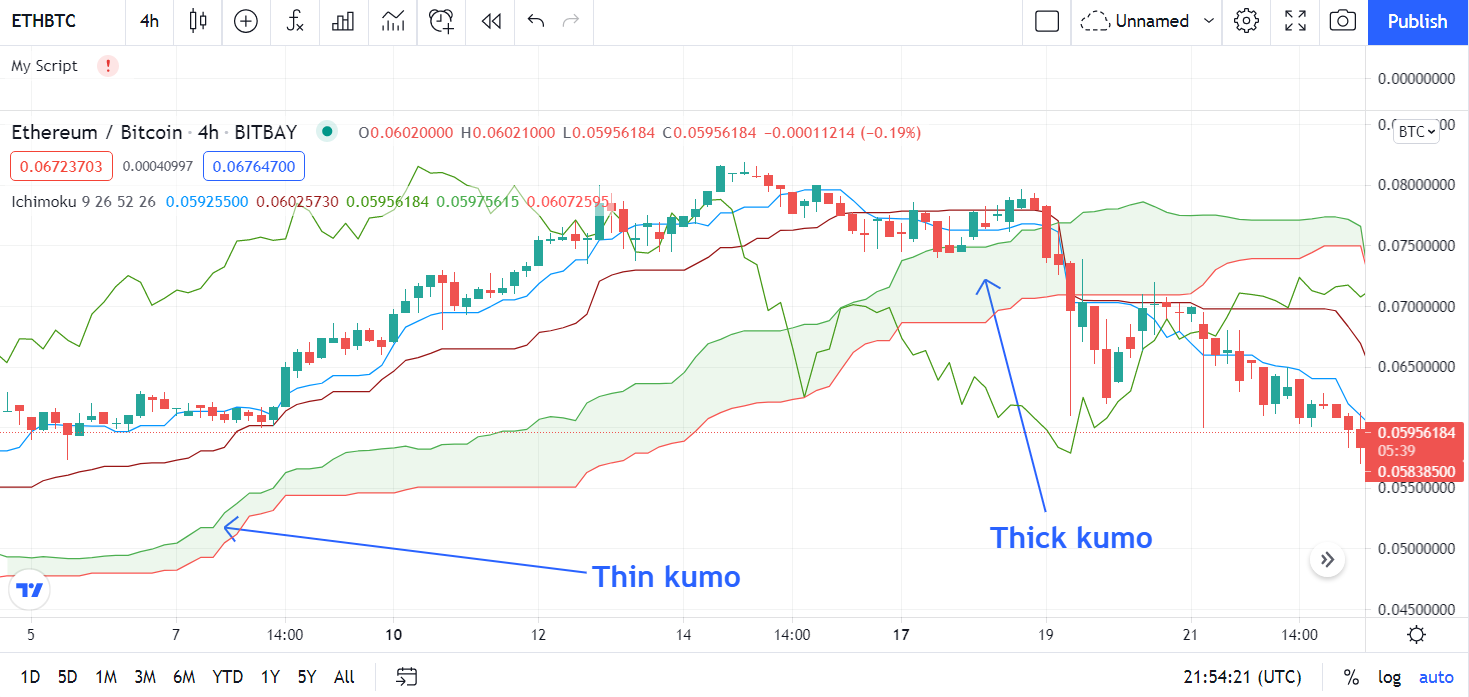
If you follow the Ichimoku indicator on the chart, you will notice that the density or the area of the cloud changes, sometimes it is wide and sometimes it is thin, which expresses that the price for previous periods and the average of the Kijun and Tenkan lines, which means the more price movement and its volatility will lead to the divergence of the two lines, which gives us the impression of stronger fluctuation in the movement of price, then, what will we benefit from knowing that:
The greater the thickness of the cloud, that is, the larger it is, the weaker the price’s ability to penetrate it or exit (the opposite is true) from it. For example, if we intend to enter into a transaction and there is a thick cloud in front of us, we must be careful if we enter the deal and enter with a lower percentage of the capital.
And also as a positive aspect, that if the price breaks through this cloud, it represents a strong price resistance area, stronger than the thick cloud, and therefore we will enter with greater confidence and maybe increase our capital income.
The cloud with tops or bottoms in the form of straight lines and its effect on the price:
This is a very special case of the cloud and it has its own effect on the price.
Here is a picture to clarify the shape of this type of cloud before we list its details and impact and the difference between it and the normal cloud.
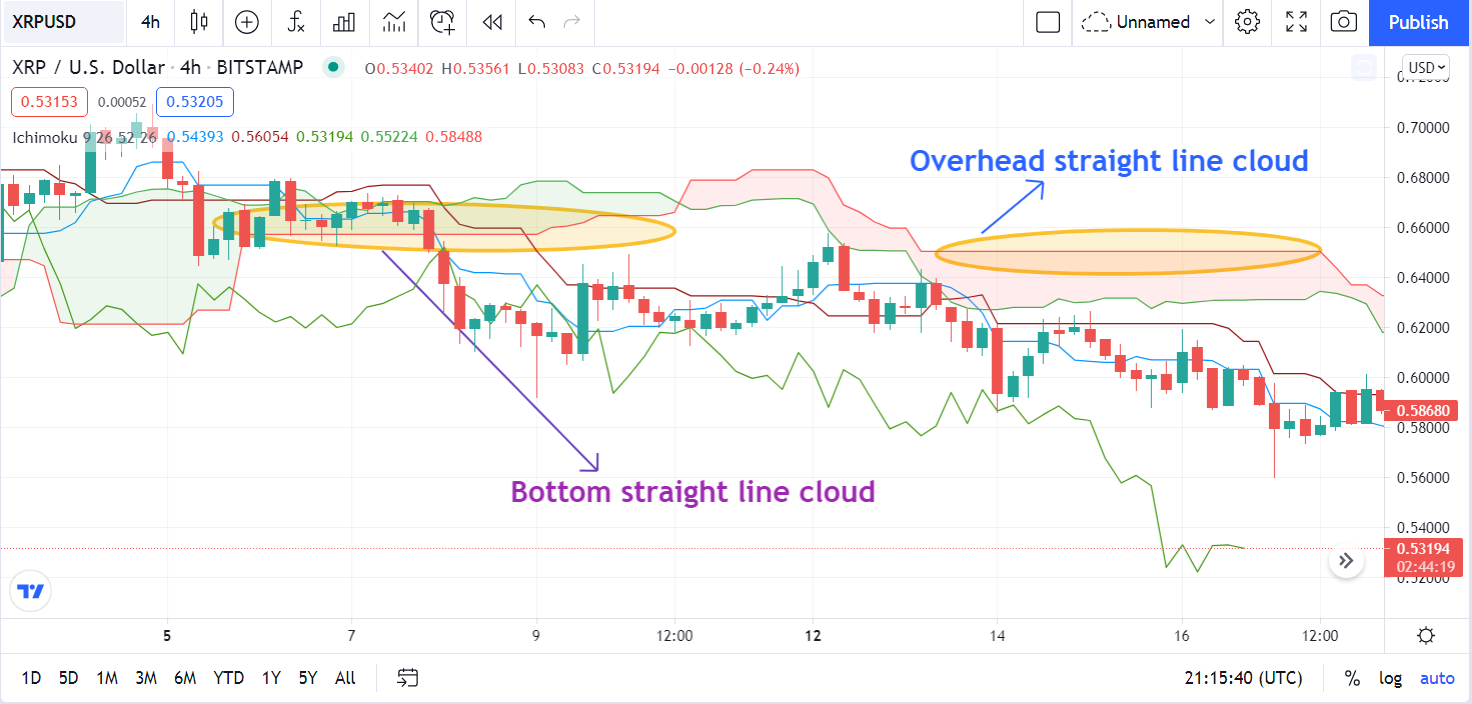
As we mentioned when we talked about the Kijun-Sen earlier that it has the effect of an eraser when it is in a straight line where the price is attracted to it before it completes its direction and returns and is attracted to it and so also for the line of Senkou B the same property when it is straight and based on its equation that pertains 52 previous candles, then it is in a straight line.
As we know, it means the absence of a clear trend during the previous period, i.e. a state of equilibrium, which the Ichimoku indicator depends on to clarify it in all its components to explain all periods of volatility, and therefore, for example, if the price penetrated the cloud up or down and this cloud had the Senkou Span B line in position In balance, we must be careful because it is very likely that the price will gravitate to this line several times before it continues a trend. Therefore, we must wait a bit until we make sure that all the data is available and that the price has already begun to move away from the cloud and from the strength of attraction of the Senkou Span B line which represents the state of equilibrium.
Conclusion:
The Ichimoku system depends on the clarification of the general trend, supports and resistances, the extent of its continuity, areas of high volatility, areas with no trend, etc. Therefore, systems that depend on the trend are very strong. But if we use logical thinking with it, we all know when the trend starts to seem to end, we find a feeling within us that says, “Come buy or sell” the trend is over.
But as we mentioned before, we have to sacrifice some points and determine the strength of the possibility of the agreement and let the graph be the one that indicated to us the existence of the agreement and take into account the general direction of the agreement. The trends overall time frames, thus ensure long-term success and remember that this system has been tested for twenty years. Although it is innovative and therefore very powerful and reliable in all markets, we have to trust its signals and wait for it to tell us that there is a suitable deal with high probability.
Homework task-5 :
1. Discuss your understanding of Kumo, as well as its two lines. (Screenshot required)
2. What is the relationship between this cloud and the price movement? And how do you determine resistance and support levels using Kumo? (Screenshot required)
3. How and why is the twist formed? And once we've "seen" the twist, how do we use it in our trading? (Screenshot required)
4. What is the Ichimoku trend confirmation strategy with the cloud (Kumo)? And what are the signals that detect a trend reversal? (Screenshot required)
5. Explain the trading strategy using the cloud and the chikou span together. (Screenshot required)
6. Explain the use of the Ichimoku indicator for the scalping trading strategy. (Screenshot required)
7. Conclusion:

Rules :
Try to read the lesson and the assignments carefully before you start editing.
You must write an essay that contains at least 300 words.
Make sure that you post your homework into the SteemitCryptoAcademy community.
Use copyright-free images with mention of its source, if possible, produce your own.
Plagiarism is forbidden in Steemit Crypto Academy, and its perpetrators may face serious penalties.
This homework assignment will run until 31st July'2021, Time- 11:59 PM UTC.
Include in your post among the first five hashtags #kouba-s3week5 and #cryptoacademy.
Users who are powering down will not be voted and considered excluded from participation.
Additionally, users with a reputation below 60 and/or haven't at least 500 SP in their wallet won't benefit from voting for their homework.

Cc:-
@steemitblog
@steemcurator01
@steemcurator02
This is interesting professor. I enjoyed the season 1 lecture on Ichimoku, and now that the season 2 two is out, I must watch it like a movie and narrate it via my homework. The season 1 already gave me the understanding and I'm glad to continue with you as you unleash various chapters. Thanks for the lectures prof. One love.
PROFESOR,what does this last line mean??
True, in the chart, I chose a resistance line a little higher than point C, but what I mean is the level of the intersection of the downtrend with another resistance line since several resistance levels can be identified.
so, sir in the above figure Senkou Span A working as resistance and as price enter inside it then it will work as support??
Here we are not talking about the Senkou Span line. There is only an intersection between the downtrend line and the resistance level (it is not drawn on the chart, which will turn into a support line after the crossover at point C) and the price represented by the candle.
Hola profesor que excelente articulo, que bien continuar con este indicador. Espero se encuentre bien. Saludos.
Hello Prof, my last week post is yet to be verified.
Thanks always ...
https://steemit.com/hive-108451/@chilaw/crypto-academy-season-03-week-04-or-advanced-course-trading-the-dynamic-support-and-resistance-lectured-by-cryptoktaze
Cc: @cryptokraze
It is done
I hope you health issues has been attended
Health is life and take good food and drugs and also rest too and I like the class let’s go
It is very kind of you and thank you for your nice words.
No problem sir
my submission linklink
Saludos profesor @kouba01 por aquí mi participación.
https://steemit.com/hive-108451/@adriancabrera/steemit-crypto-academy-temporada-3-semana-5-or-comercio-de-criptomonedas-con-el-indicador-ichimoku-kinko-hyo-parte-2-profesor
Welcome back brother
Thank you my dear.
WELCOME BACK MY BROTHER!!!
Thank you, my dear colleague.
Welcome back professor. Missed your lectures.
Hi professor here is my class assignment entry https://steemit.com/hive-108451/@mccoy02/steemit-crypto-academy-season-3-week-5-or-trading-crypto-with-ichimoku-kinko-hyo-indicator-part-2