Crypto Trading With Chaikin Money Flow Indicator- Crypto Academy S4/W6 - Homework Post for professor @kouba01
.jpg)
Hello friends. How are you all doing? This article is my submission to Professor @kouba01's class on Crypto Trading With Chaikin Money Flow Indicator. The assignment was given as below:
In your own words, give a simplified explanation of the CMF indicator with an example of how to calculate its value?
Demonstrate how to add the indicator to the chart on a platform other than the tradingview, highlighting how to modify the settings of the period(best setting).(screenshot required)
What is the indicator’s role in confirming the direction of trend and determining entry and exit points (buy/sell)؟(screenshot required)
Trade with a crossover signal between the CMF and wider lines such as +/- 0.1 or +/- 0.15 or it can also be +/- 0.2, identify the most important signals that can be extracted using several examples. (screenshot required)
How to trade with divergence between the CMF and the price line? Does this trading strategy produce false signals?(screenshot required)
Conclusion

In your own words, give a simplified explanation of the CMF indicator with an example of how to calculate its value
.jpg)
H13As3ab3kEpu6UzDJAUr2ifNowrKbo53ihyjTToG7fpgFpNqMzgcMftxrndqUtsEc5jLMUH22B7eSTEFyqP96BrV8yk8C3GA4fVZSknA7E4pepZDWw3SowKrQDfnk6.png](https://cdn.steemitimages.com/DQmbkCHDT4PAW1nnUgGQqLjvUWxzWyPcqHv3FDBnxSdEhCm/DogN7fF3oJDRFfTX23jpNFipt8XczZE3JAcTgXDW4DmuvS85rzUxWQbU2Hi8VAxWUhHycnakxoKDQHH13As3ab3kEpu6UzDJAUr2ifNowrKbo53ihyjTToG7fpgFpNqMzgcMftxrndqUtsEc5jLMUH22B7eSTEFyqP96BrV8yk8C3GA4fVZSknA7E4pepZDWw3SowKrQDfnk6.png)
Created by Chaikin Marc, the Chaikin Money Flow indicator is one of the frequently used technical analysis tools by traders and investors. This indicator is fundamentally the weighted volume means of the results of both the distribution and accumulation events of an asset on the market over a specified window of time and is grounded on the notion that the accumulation and distribution level of an asset can be determined relative to the close price of a candle.
Thus, when a candle representing the price of a cryptocurrency asset on the market within a specific time-frame is closing at a point that is near the high then buyers are in control of the market; hence, accumulation is at work. Conversely, the closing price of a cryptocurrency asset on a chart of a particular time frame is near its low then distribution is occurring as sellers dominate the market at that point in time.
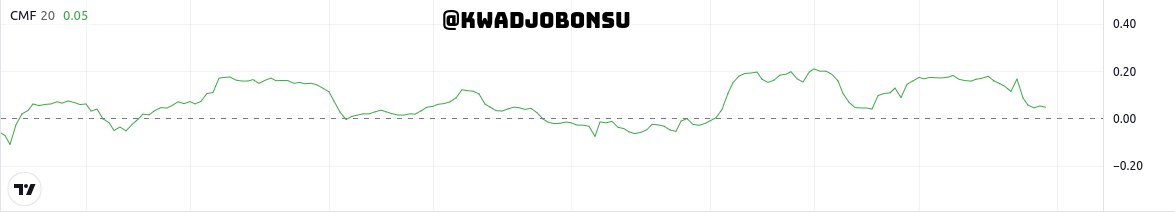
The Chaikin Money Flow indicator is represented graphically by a single oscillating line that moves from negative zones to positive, and vice versa. The range of the CMF indicator is engulfed between positive and negative numbers, where 0 is the neutral ground or the midpoint. The position of the CMF indicator line signals the respective market conditions. For instance, when the readings move beyond the midpoint, it communicates the accumulation in the money flow of the asset, whereas the recession of the line below the 0 mark denotes distribution.
As a result, the CMF indicator is used by traders to determine trends and also assess the intensity of identified trends on the market of a cryptocurrency asset. Additionally, the CMF indicator is built to detect divergence due to its volume-based characteristics. Therefore, it is effective at identifying trends that are losing momentum and also signals potential reversals to traders and investors. CMF indicator is simple to apply and read.
The indicator performs its calculations based on the formula below:
Chaikin Money Flow =
The Mean of the Daily Money Flow of a specific number of days / The mean of the volume of the same number of days.
Money Flow Volume =
Volume for the selected period * The Money Flow Multiplier
Money Flow Multiplier =
[(Close value - Low value)-(High value- Low value)] / (High value- Low value)
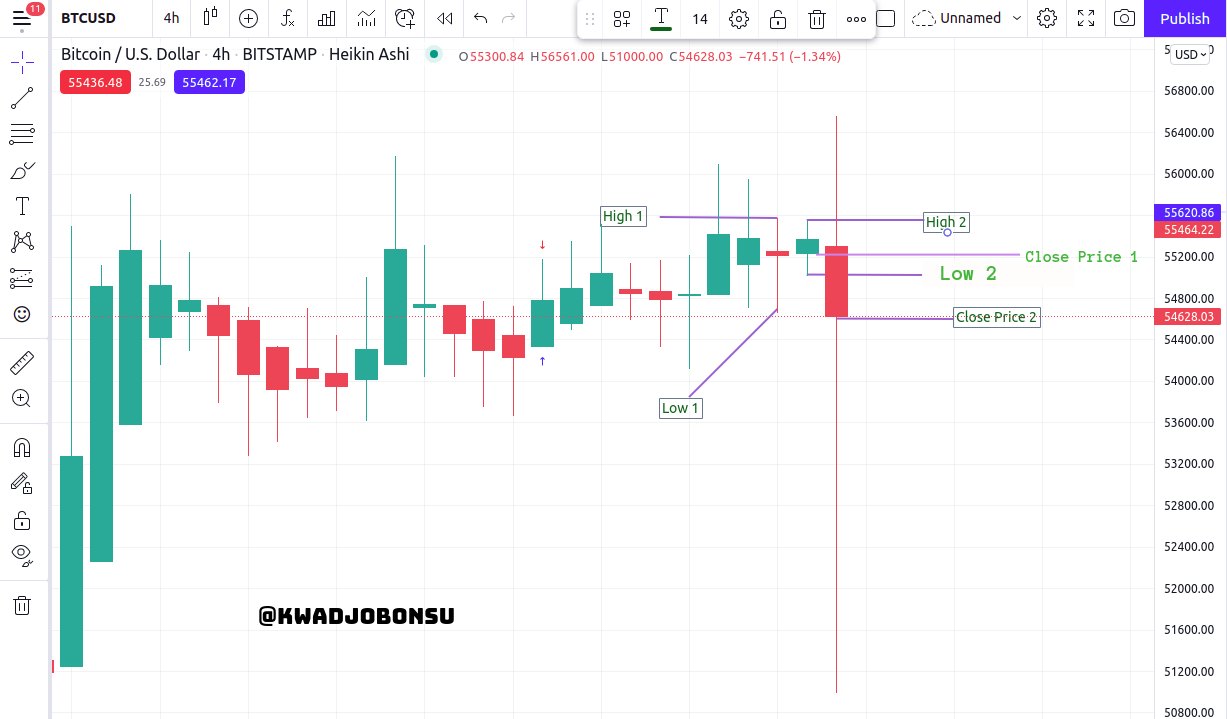
The standard number of days for the indicator is 21, but for the purpose of demonstration, I shall consider the application of this formula for a 2-day period on the BTC/USD BITSAMP pair on the Tradingview platform.
.jpg)
Period 1 Data:
High Price point: $55570.90
Low Price Point: $54669.85
Close Price Point: 55235.62
Volume: 89
Period 2 Data:
High Price point: $55549.94
Low Price Point: $55015.60
Close Price Point: $54628.03
Volume: 580
Applying the respective formula for each period, the MFM for periods 1 and 2 are −0.372 and −1.725 respectively. The MFV for period 1 and period 2 are -33.108 and -1000.5.
The average of the MFV is −516.804.
Average volume = 334.5
CMF = -516.804/334.5
CMF = −1.545
With a negative CMF, it is an indication that there is distribution occurring on the market of the asset considering the two days period. It must be noted that periods lower than the ideal 21 produce much sensitive CMF and could render more false signals. This demonstration was for purely academic purposes.
The CMF indicator regardless of its positive merits has some disadvantages such as its inability to account for price gaps on the market, tendency to render false signals, no specified TPSL threshold, and many others. Hence, it is advisable to seek confluence among other trading indicators before concluding a market decision.
Demonstrate how to add the indicator to the chart on a platform other than the tradingview, highlighting how to modify the settings of the period
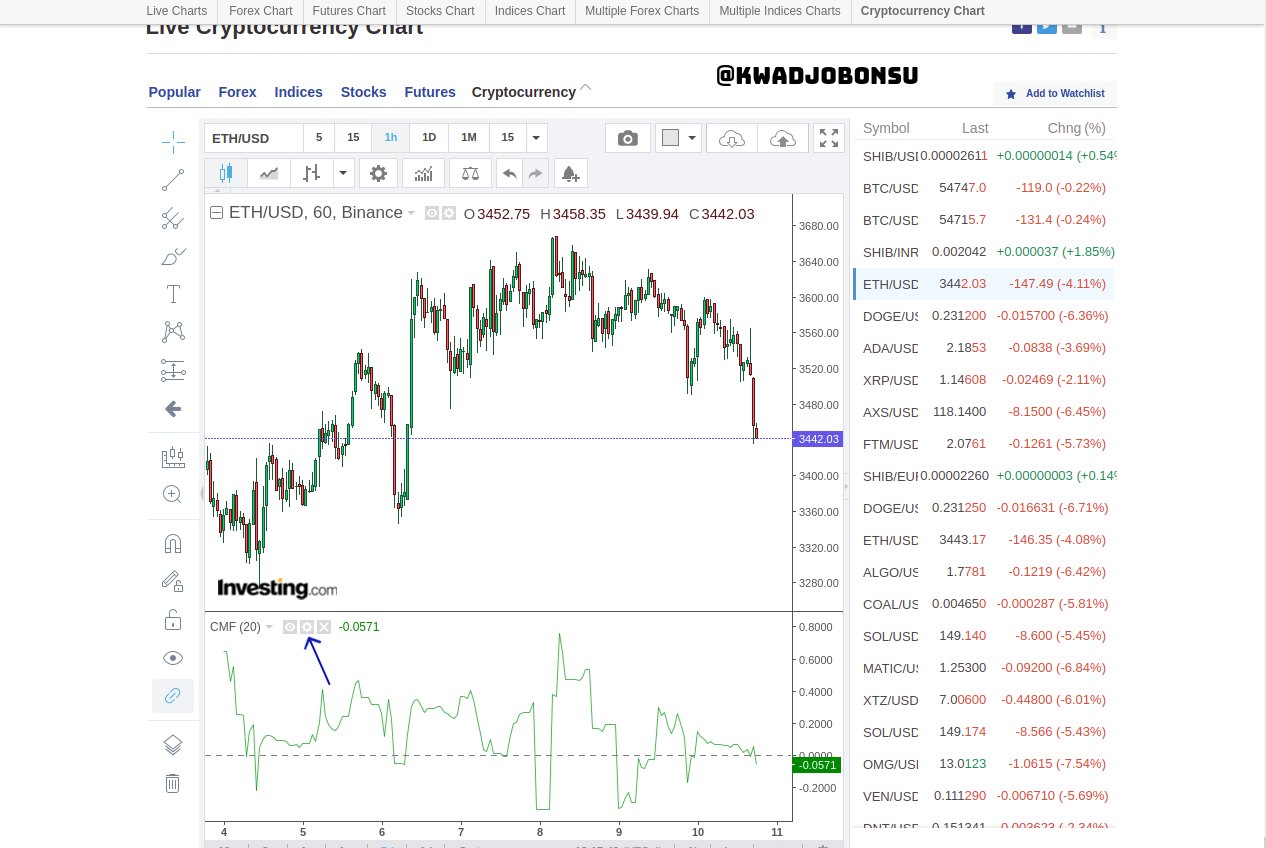
For this section, I used the investing.com platform's chart and the pair ETHUSD.
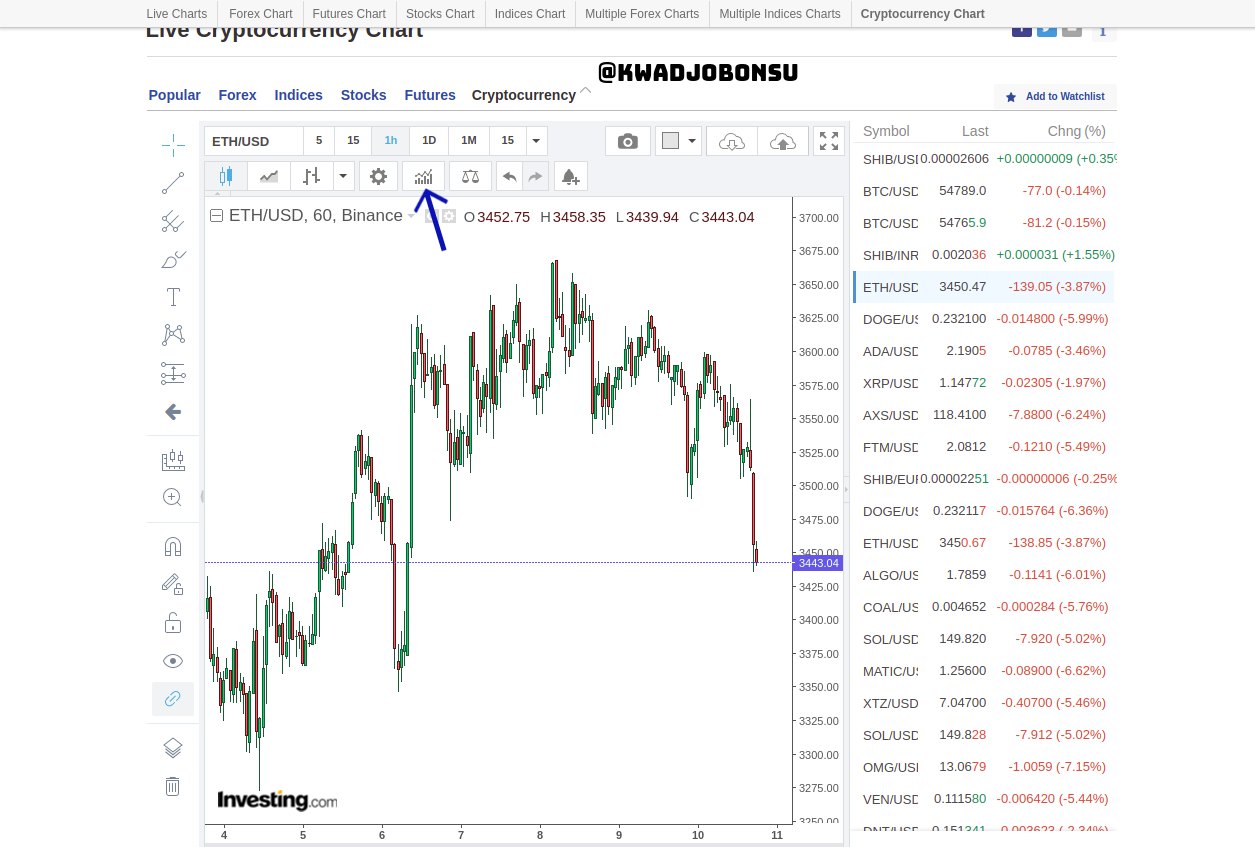
- I clicked on the Indicators button as highlighted in the image above.
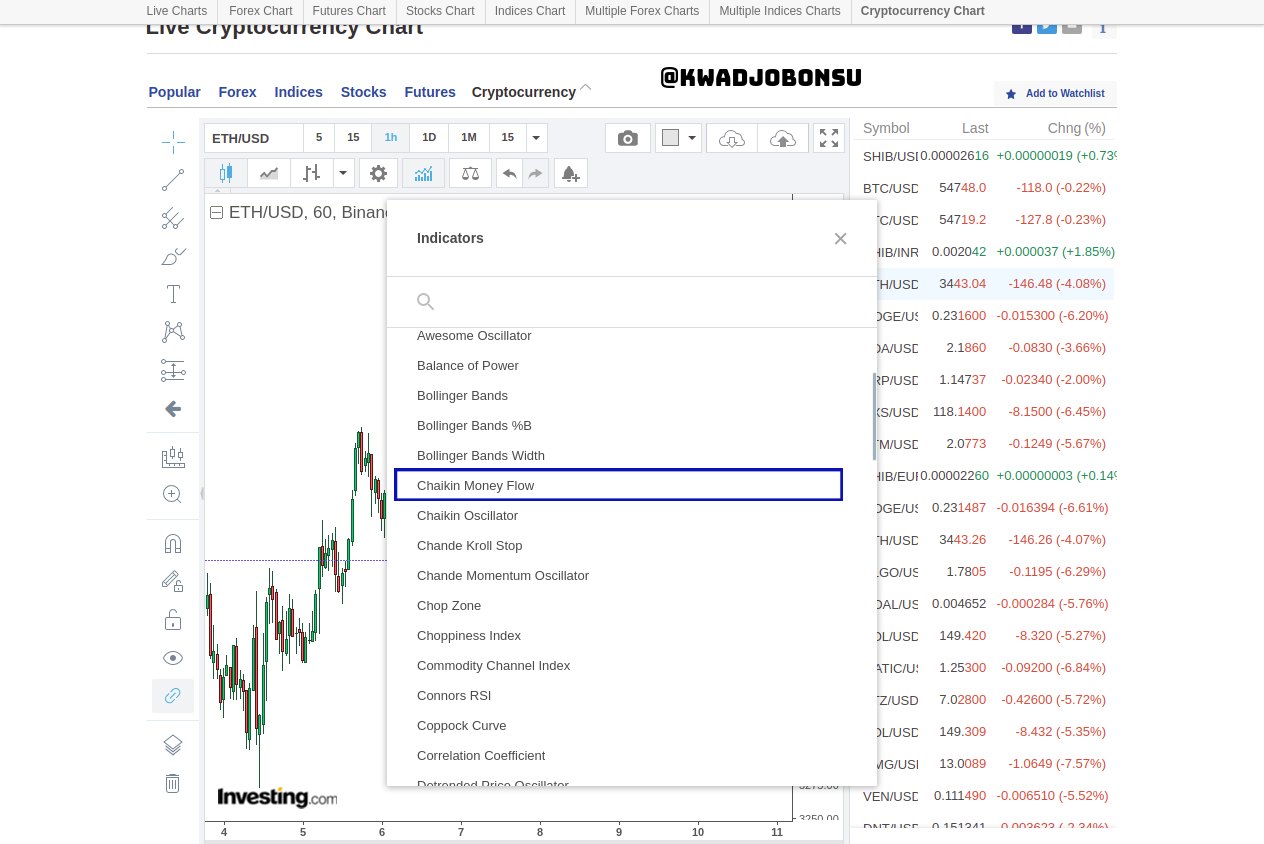
- Next, I selected the Chaikin Money Flow indicator from the dropdown list of available indicators.
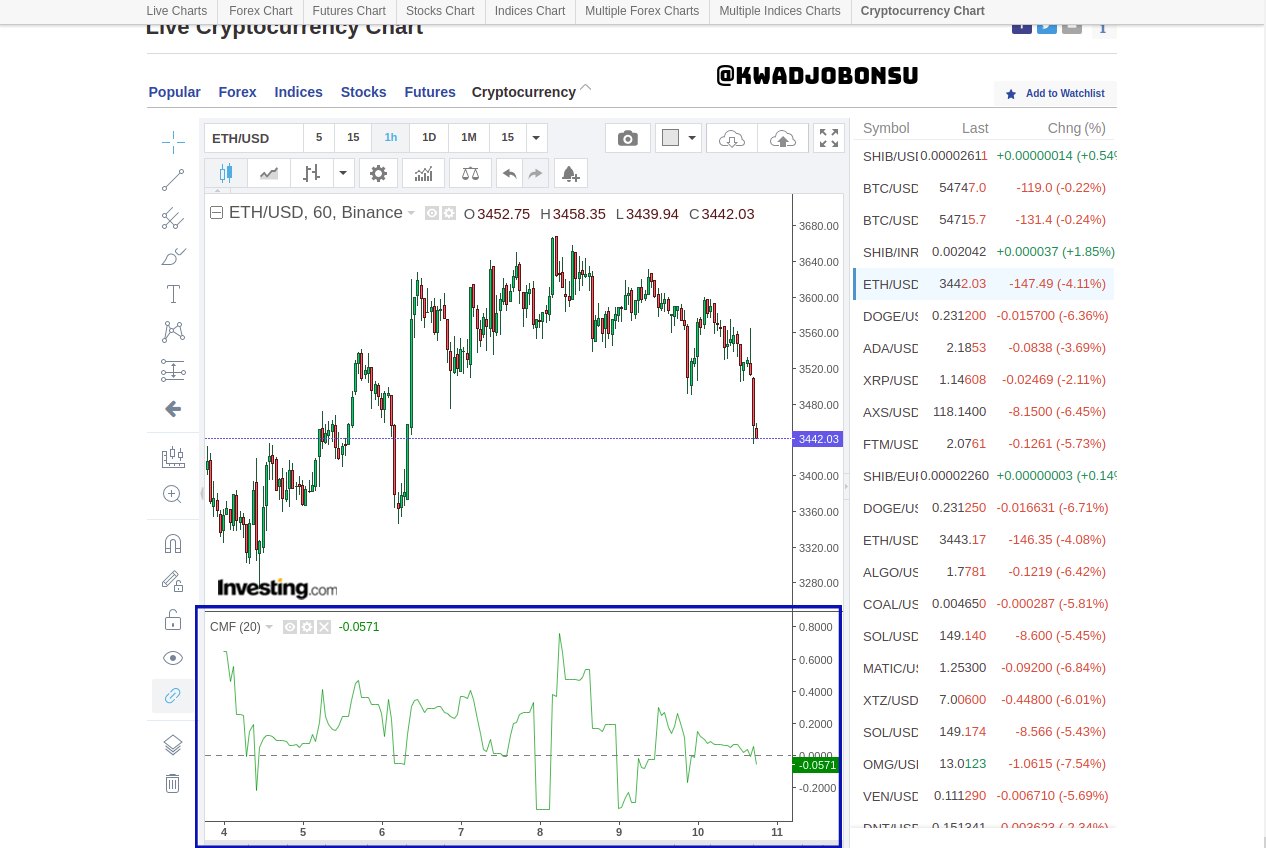
- The indicator showed as demonstrated in the screenshot above with a default period setting of 20.
.jpg)
- To configure the indicator, I clicked on the Setting button on the indicator’s chart, as shown above.
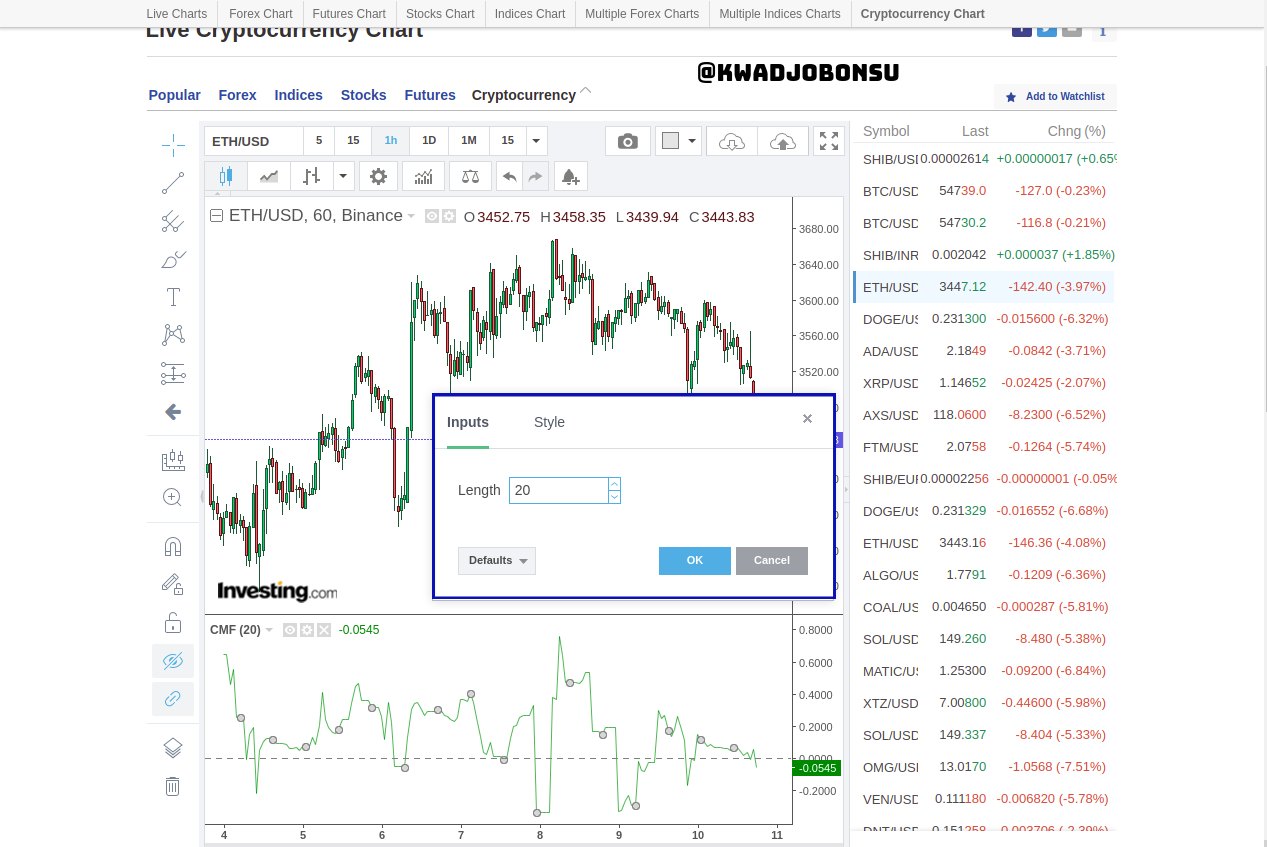
- The Length box enables users to enter their preferred time period. I later entered 21 as my value.
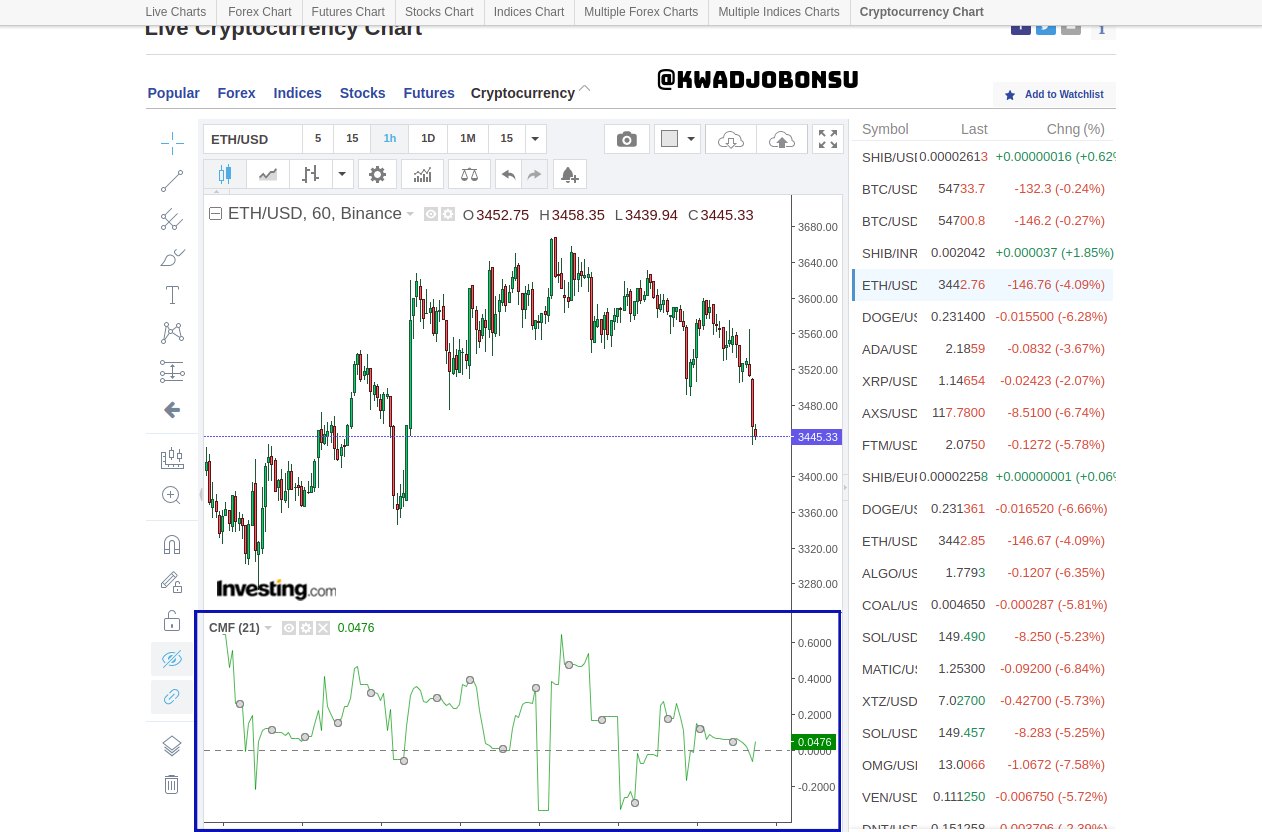
- The CMF readings for a length of 21 are depicted above.
I selected 21 because it is the accepted standard among most traders. Lengths lower than 21 create more sensitive readings which are prone to false signals, whereas higher values beyond 21 produce a less sensitive CMF indicator. Either way, the preferred length should be adjusted to the trader’s style of trading. Short-term traders may choose shorter lengths, whereas Long term traders can decide to go in for longer lengths.
What is the indicator’s role in confirming the direction of trend and determining entry and exit points (buy/sell)
The volume of an asset’s transactions precedes its price movement on the market. High volumes of accumulation indicate that there are more buyers on the market, and this dominance or buying pressure leads to the increment in the price point of the asset. Likewise, high volumes of distribution are a key indicator of the control by sellers on the asset’s market. This event drives the price point of the asset lower.
Since CMF is based on volumes and directly linked with the accumulation and distribution of assets on the market, it is a good indicator for confirming the price trends or direction of an asset on a market. When there is more accumulation on the market due to the increment in the buying pressure of a cryptocurrency asset, the CMF indicator move above the 0 midpoint. This movement renders it a positive value and signals a possible continuous bullish trend.
Alternatively, during a Bearish market condition of a cryptocurrency asset, the CMF value becomes negative as it moves below the 0 mark. This direction of the indicator signals likely continuous bearish movement of the asset, as more selling pressure is being built on the market. This in turn further drives the price of the asset down and also serves as a buy signal since the asset can be acquired at a lower price point.
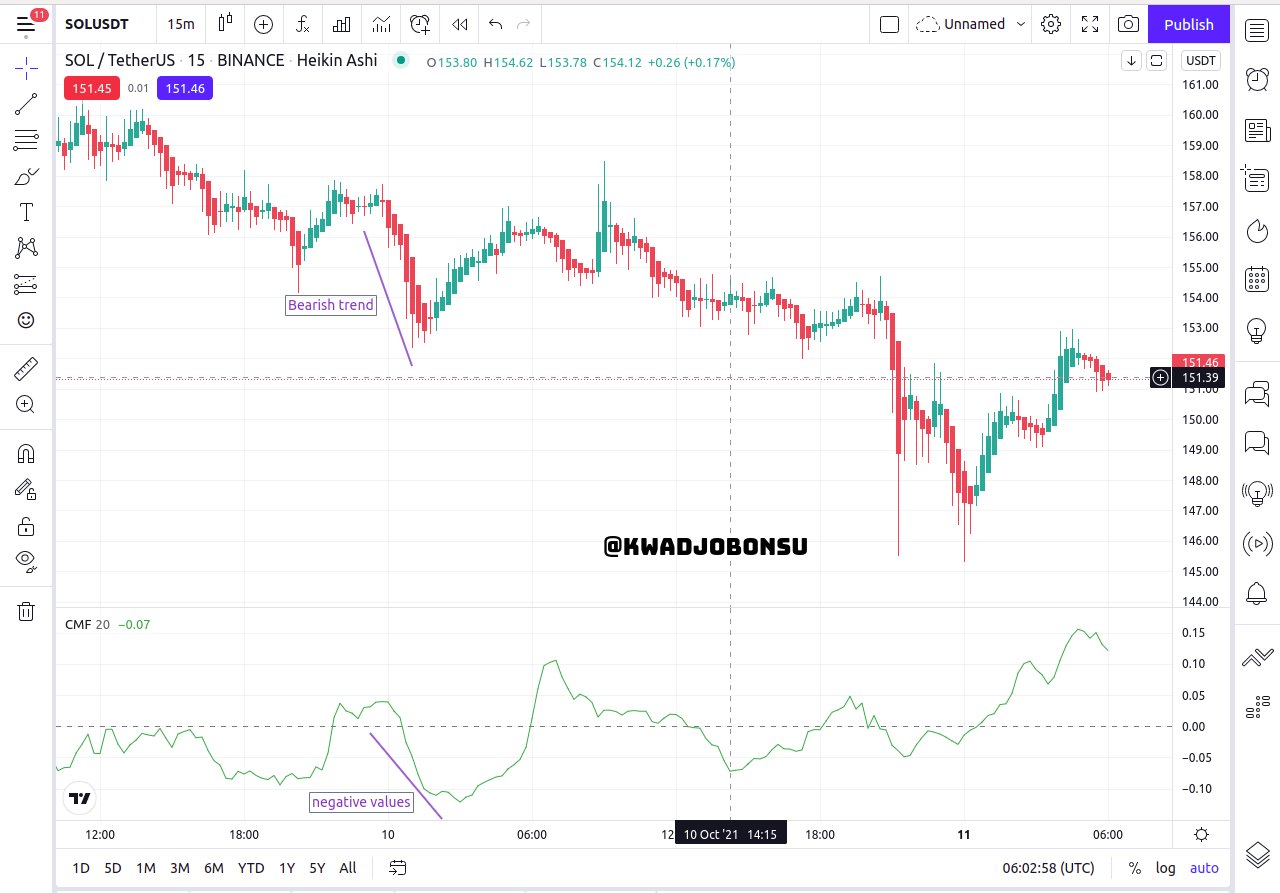
In the image of the SOLUSDT chart above, the CMF indicator is highlighted to be moving below the 0 midpoint, which denotes the event of distribution as sellers dominant the market due to the surging buying pressure on the market. This confirms the corresponding bearish movement of the price of the asset as signaled by the price action on the chart. Additionally, the cross below the zero mark is also a signal that a bullish reversal is bound to happen on the market.
CMF tends to produce false signals, hence traders do not rely on the crosses to enter or exit the market. Instead, a demarcation of the trader or investor’s choice is done and used as the benchmark. In the image above, I selected the 0.05 and -0.05 margins. So for my Sell market entry, I will enter when the CMF indicator crosses below the -0.05 margin, and exit the market when it crosses above the 0.05 margin after the indicator retests the 0 margins, as demonstrated in the image above.
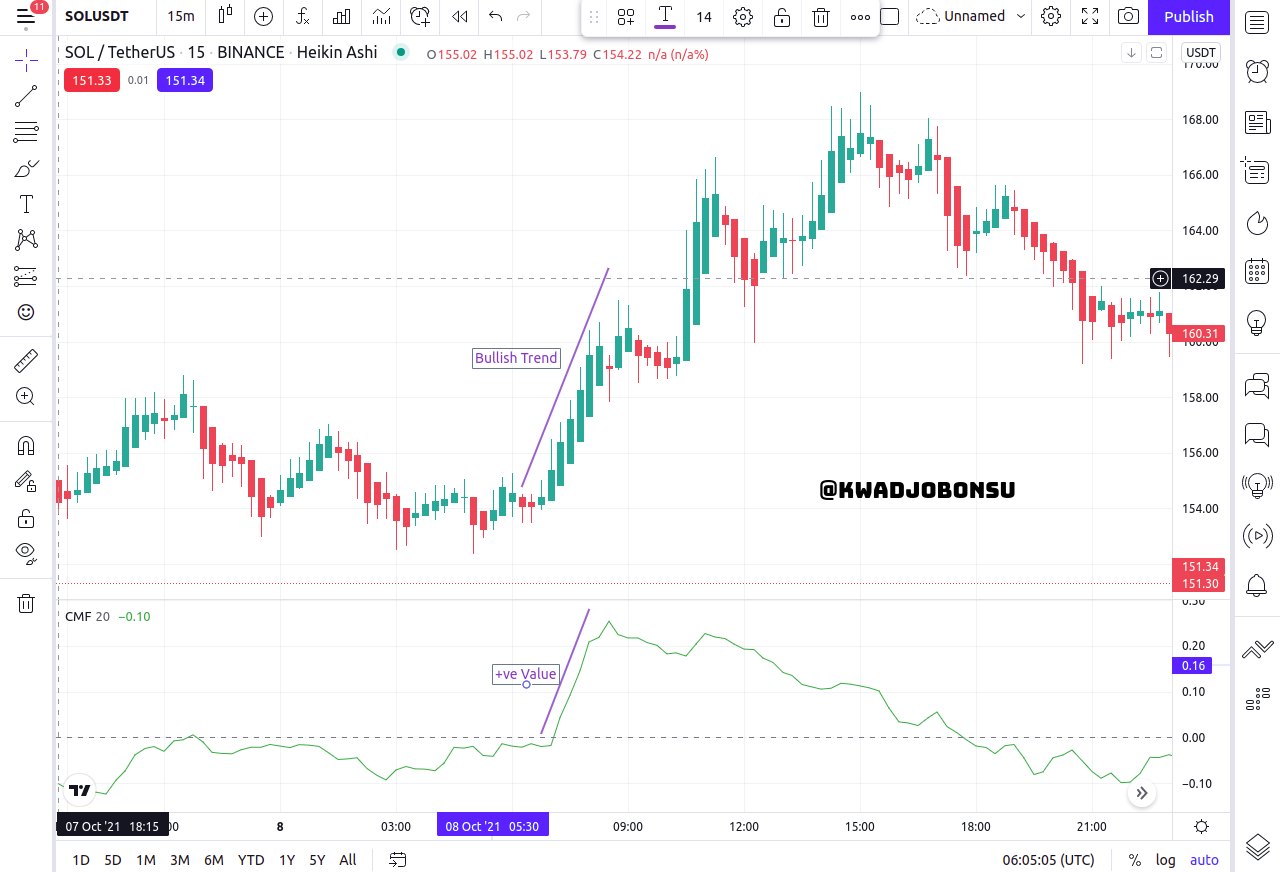
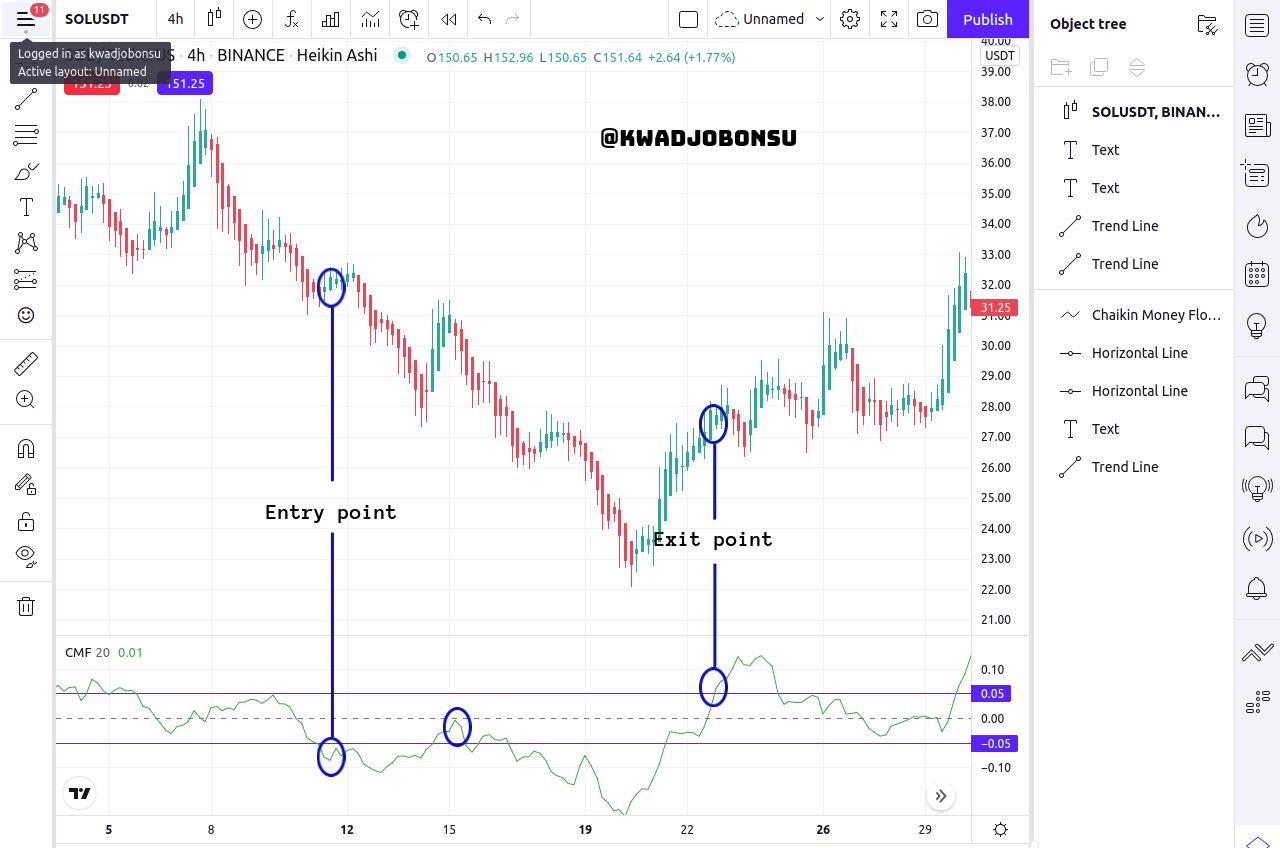
In the screenshot of the SOLUSDT chart above, the CMF indicator is shown to be moving above the 0 mark, which indicates the event of accumulation as buyers are dominating the market due to the increasing buying pressure on the asset’s market. This confirms the corresponding bullish direction of the price of the asset as signaled by the price action on the chart. Furthermore, the cross below the zero mark is also a signal that a bearish reversal is imminent.
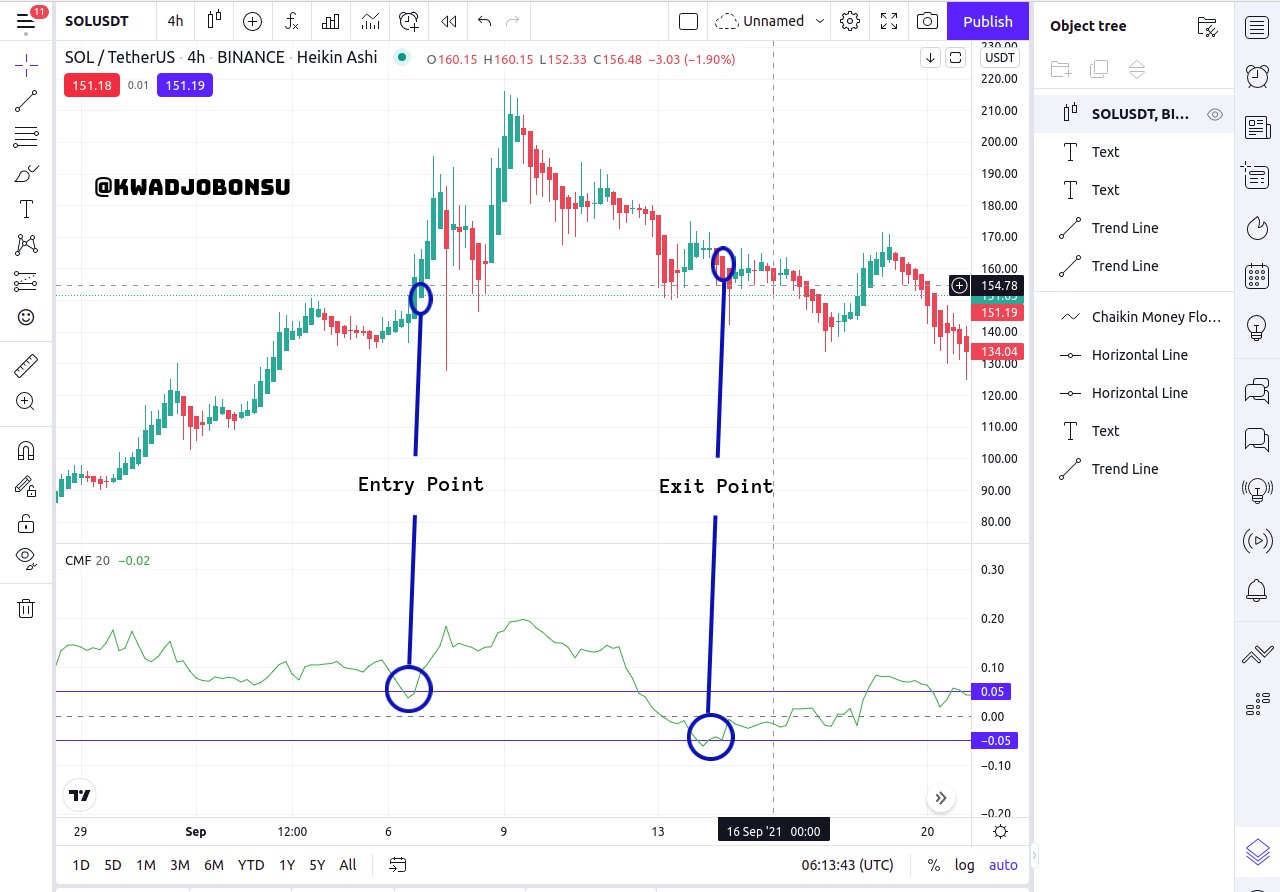
Due to the CMF indicator’s susceptibility to false signals, traders do not rely on the crosses to enter or exit the market during a bullish run. Lines are drawn on the chart and utilized as the benchmarks. In the screenshot above, the 0.05 and -0.05 margins were again used. So for my Buy market entry, I will enter when the CMF indicator crosses above the 0.05 margin, and exit the market when it crosses below the -0.05 margin, as demonstrated in the image above.
Trade with a crossover signal between the CMF and wider lines such as +/- 0.1 or +/- 0.15 or it can also be +/- 0.2, identify the most important signals that can be extracted using several examples.
From the lesson, it was learned that custom demarcations are needed to avoid incorrect signals because merely relying on the CMF indicator’s crossover to the 0 mark is dangerous. As a result, traders can use various margins such as +/- 0.1, +/-0.2, and so on as their targets for signal generation. A buy signal is created when the line moves above the positive mark, whereas a sell signal is generated when the line moves below the -0.1 margins.
For the purpose of demonstration, the Tradingview platform and several trade pairs were used. Also, the +/- 0.1 mark was made on the CMF indicator.
For the purpose of demonstration, the Tradingview platform and several trade pairs were used. Also, the +/- 0.1 mark was made on the CMF indicator.
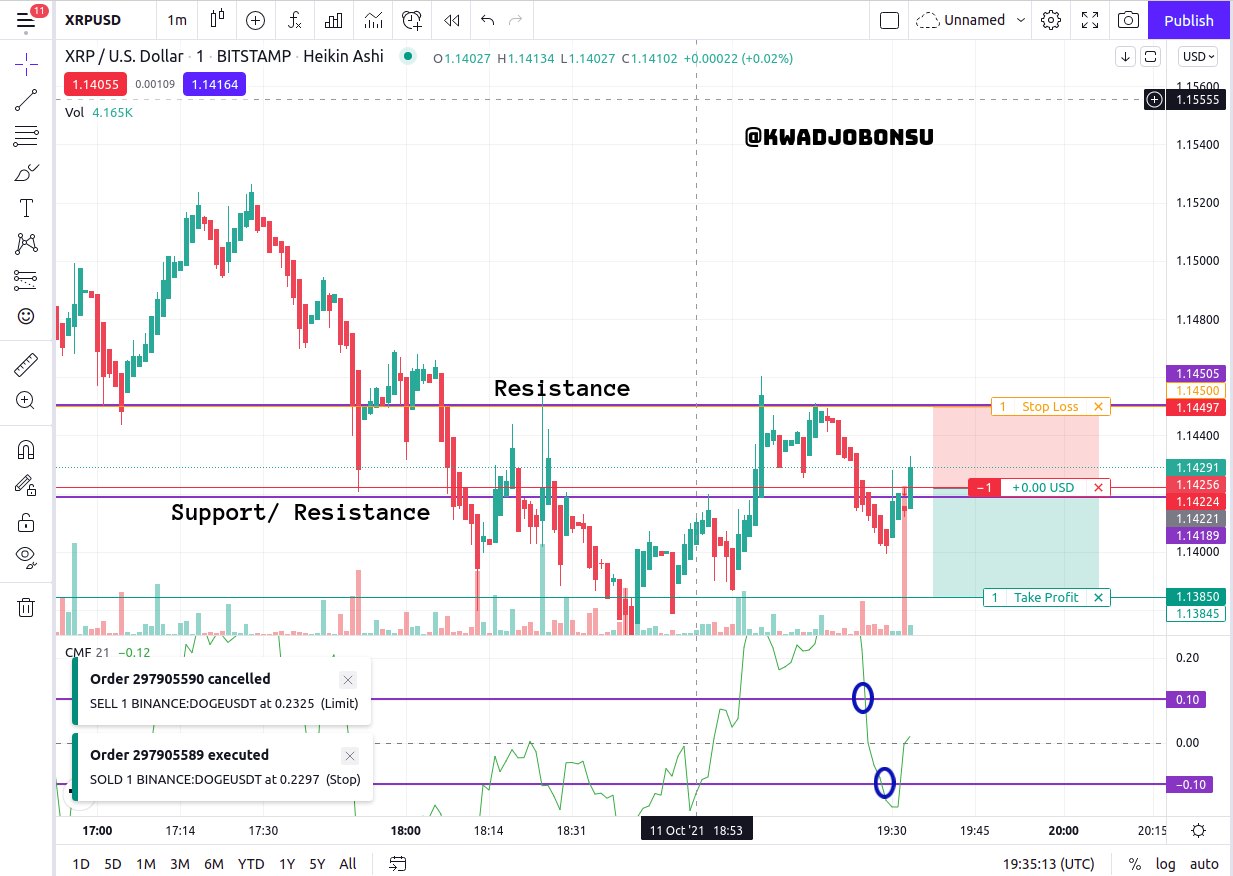
In the above case, the line of the CMF indicator is observed to have crossed from the 0.1 zone into the -0.1 zone. The various support and resistance marks were also identified. A sell order as executed after the move of the line into the -0.1 zone was observed. The Reward-to-Risk ratio was 1.5 as the Stop Loss margin was set to the resistance level, whereas the Take Profit zone was set slightly below the immediate lower candle. The trading pair at work here was the XRP/USD BITSTAMP.
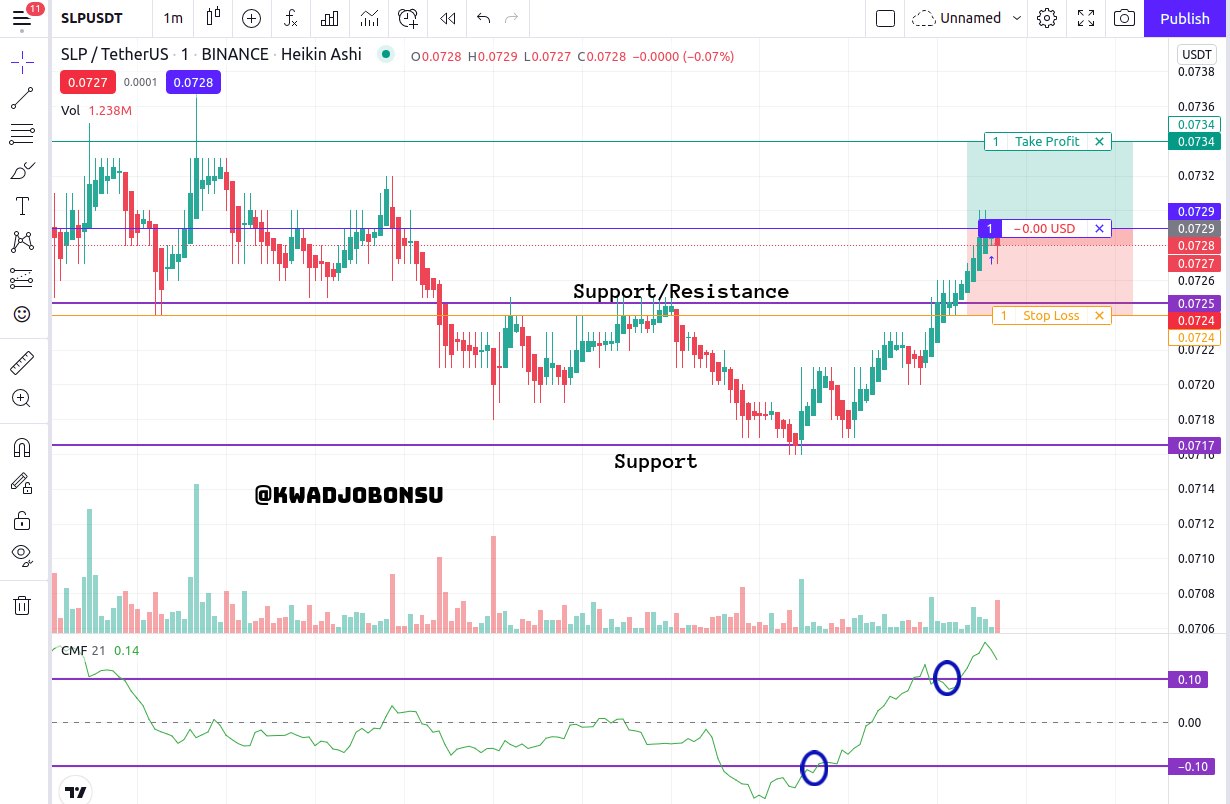
For this example, the CMF indicator line crossed above the 0.1 mark, and the chart was also observed to be moving in a bullish direction. Hence, a buy order was executed with a Reward-to-Risk ratio at 1: 1. The support and resistance of the price action were also identified accordingly. The TP was set above the resistance of the candles, whereas the SL was placed slightly below the support/resistance zone. SLPUSDT was the cryptocurrency trade pair for the above image.
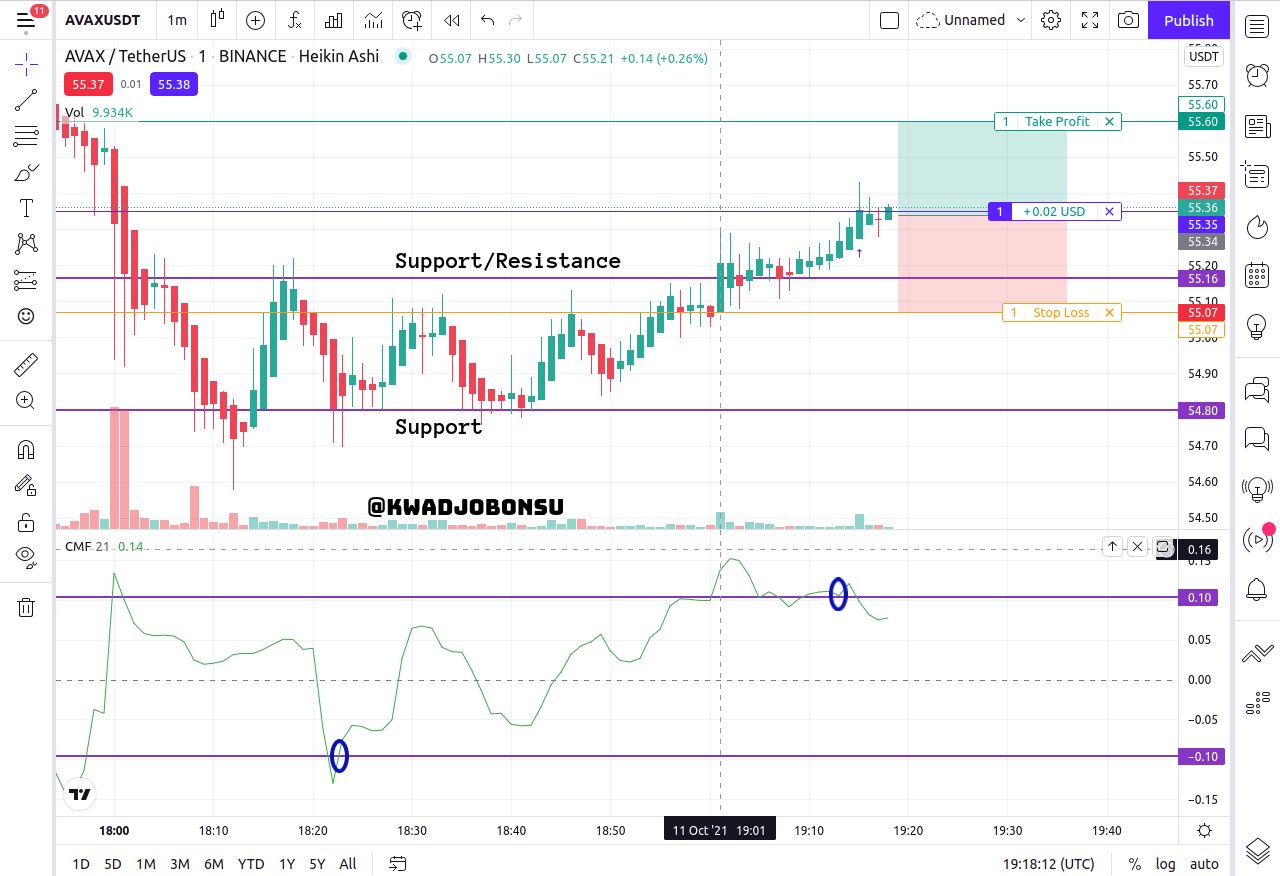
Last but not least, another buy order was executed on the AVAXUSDT Binance pair after the CMF indicator line crossed the 0.1 margins. The chart movement also confirmed a bullish market as buying pressure was building up. A TPSL risk management framework was put in place as the Reward-to-Risk ratio stood at 1:1. The Support and Resistance levels were also identified.
How to trade with divergence between the CMF and the price line? Does this trading strategy produce false signals?
Divergence is when there is a disparity between the readings of the price action/ charts and that of the indicator. This phenomenon highlights the reduction in the respective buying or selling pressure of the asset on the market despite its bullish or bearish trend respectively. Hence, a reversal is imminent.
Bearish Divergence
The case of a bearish divergence is when the line of the CMF indicator moves in a downward pattern while the price action or the candlesticks of the chart move in a bullish trend. This event denotes that the buying pressure is reducing and will not be able to sustain the trend for long. Hence, sellers will take over the market and drive the price point of the asset down. A bearish reversal is accordingly bound to happen.
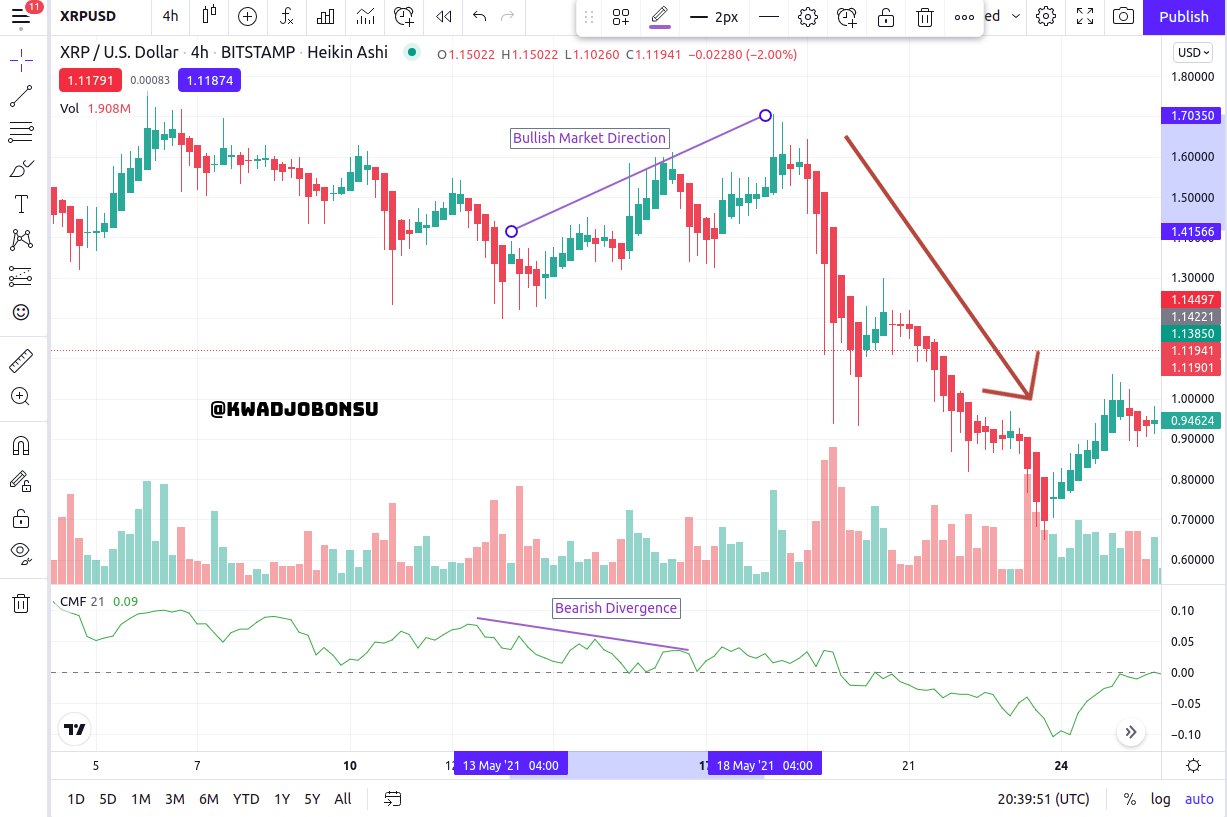
In the above picture, it can be observed that the chart reading of the XRPUSD pair was highlighted to be in a bullish pattern. Yet, the direction of the CMF indicator was a bearish one. This event means that the buyers’ dominance on the asset market is gradually dying out as there are not many buyers to keep this price direction. The volume of the corresponding area can also be seen to be significantly lower at the last bullish candle in the highlighted section. Therefore, traders looked forward to a strong bearish reversal.
A bearish reversal took place in a violent manner as sellers took control of the market and drove the price of the asset down. It can also be seen that the volume of selling orders was considerably higher. The CMF indicator according moved into the negative zone to highlight the occurrence of distribution on the market.
Bullish Divergence
The scenario of a bullish divergence is the event where the CMF indicator moves in an upward trend whereas the price action or the candlesticks of the chart move in a bearish direction. This phenomenon means that the selling pressure is abating and will not be able to maintain the trend for a while. Therefore, buyers will dominate the market and drive the price point of the asset up. A bullish reversal is therefore imminent.
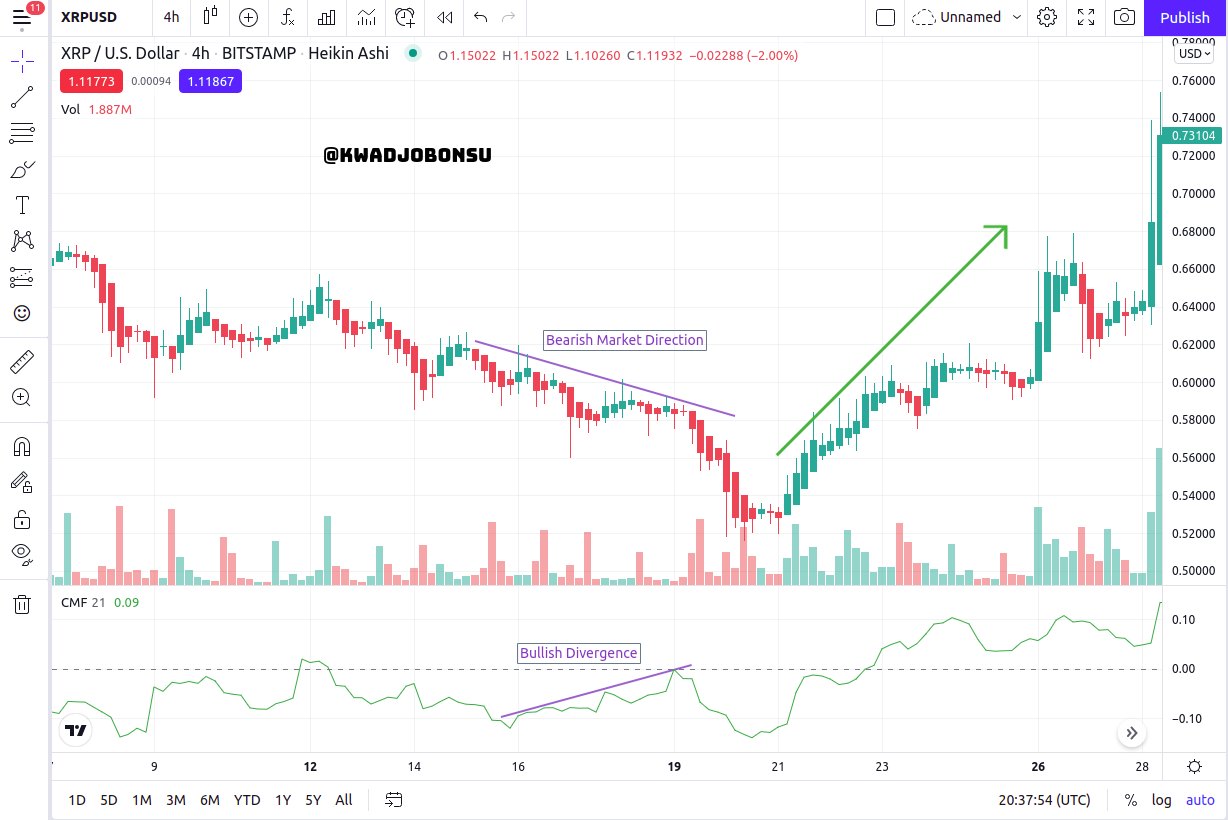
In the image above, it can be observed that the chart reading of the XRPUSD pair was highlighted to be in a bearish pattern. However, the direction of the CMF indicator was a bullish one. This event means that the sellers’ control on the asset’s market is gradually reducing as there are not many sellers to sustain this price direction. The volume of the corresponding region can also be seen to be significantly weak at the last bearish candle before the start of the bullish run. Therefore, traders looked forward to a strong bullish reversal on the market.
A bullish reversal took place in a violent manner with few price swings as buyers dominated the market and drove the price of the asset up. It can also be seen that the volume of bullish orders was considerably higher than those of final bearish ones. The CMF indicator according moved into the positive zone to highlight the occurrence of accumulation on the market as buying pressure builds up.
The CMF indicator is prone to false market signals. Hence, traders must seek confluence among various technical indicators as well as price actions before executing market orders. Proper risk management systems must also be put in place to secure one's resources against violent market volatility.
Conclusion
The Chaikin Money Flow indicator assesses the volume of assets on the market and helps to communicate the intensity of the buying and selling pressure on the market. A positive reading of the line of the CMF indicator signals accumulation as buying pressure grows, while a negative value communicates distribution as the sellers gain momentum on the market of the asset. The CMF indicator can recognize divergence and highlight impending reversals on the market. It, however, is prone to false signals and lacks specific TPSL margins. Hence, traders must trade cautiously and also combine the CMF indicator with other technical indicators to seek agreement before making a decision regarding their market execution.
I thank Professor @kouba01 for this educative class.
Hello @kwadjobonsu,
Thank you for participating in the 6th Week Crypto Course in its 4th season and for your efforts to complete the suggested tasks, you deserve a Total|9.5/10 rating, according to the following scale:
My review :
Great content, thanks to which you managed to get an excellent grade, and here are some observations.
Detailed explanation of the indicator and its characteristics.
Your choice of using only two periods was smart, but it did not enable you to obtain a correct final result, as the value of the indicator ranges between +1 and -1.
Chaikins suggests 21 days as the default setting. That corresponds approximately to a trading month. If the number of periods is larger, the indicator is less volatile and less prone to sideways movements. In a weekly or monthly chart, the number of periods should be reduced.
Your remaining answers were excellent in terms of explanation and depth of analysis.
Thanks again for your effort, and we look forward to reading your next work.
Sincerely,@kouba01