Crypto Trading With Williams % R Indicator- Crypto Academy / S4W4 - Homework Post for @kuoba
.jpg)
Hello everyone. This post is my homework submission to Professor @kouba01's lecture on trading with the Williams Percent Range Indicator. The given assignment is as below:
Explain the Williams %R indicator by introducing how it is calculated, how it works? And what is the best setting? With justification for your choice.
How do you interpret overbought and oversold signals with The Williams %R when trading cryptocurrencies? (screenshot required)
What are "failure swings" and how do you define them using The Williams %R? (screenshot required)
How to use bearish and bullish divergence with the Williams %R indicator? What are its main conclusions? (screenshot required)
How do you spot a trend using Williams %R? How are false signals filtered? (screenshot required)
Use the chart of any pair (eg STEEM/USDT) to present the various signals from the Williams %R indicator. (Screen capture required)
Conclusion

Explain the Williams %R indicator by introducing how it is calculated, how it works? And what is the best setting? With justification for your choice

Developed by Williams Larry in the early 1970s, the Williams Percent Range Indicator has since become one of the frequently used trading indicators. As a momentum indicator, the Williams Percent Range indicator provides traders and investors with information regarding the intensity of the price direction of an asset by utilizing oscillatory graphical charts that fluctuate between a range of numbers. It also behaves closely to the Stochastic indicator in that the Williams Percent Range is a great tool for determining oversold and overbought bought conditions of an asset, which in turn is usually a precursor to a bearish reversal in the case of a bullish trend or a bullish reversal in the case of a bearish trend.
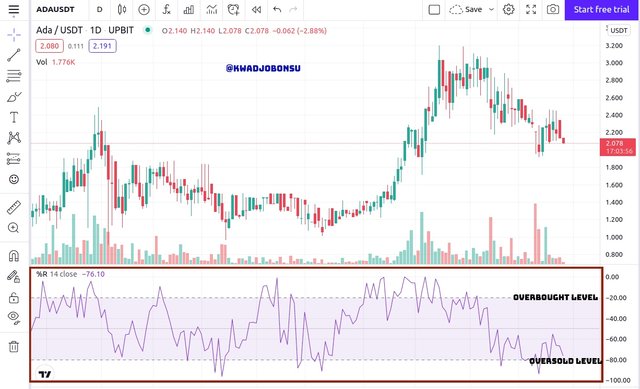
The Williams Percent Range Indicator performs its computation by employing the highest and lowest price point of an asset in comparison with its recent closing price point, all within a particular period or window of time. The default period for computation is fourteen days; however, traders have the liberty to customize and set their preferred number. The oscillatory chart of William Percent Range swings between the range zero to negative hundred. In the case where the indicator moves beyond the -20 mark, the respective finds itself in the Overbought level, whereas the movement below the -80 level is called the Oversold level.
The Williams Percent Range is a favorite among many traders because it is rapidly sensitive to price changes and can be used on distinct markets of various assets. It also functions well with other trading indicators. Quite often, this indicator is used together with other indicators for confirmatory purposes because one of the key demerits of the Williams Percent Range Indicator is that it generates quite many false market signals. These false signals can put traders who heed to them in bad positions on the markets. Regardless, it has been an effective tool for providing advantageous exit and entry signals to traders and investors.
The calculations of the Williams Percent Range Indicator is calculated as follows:
Williams % R =
[( the maximum price point of the asset – the recent closing price point of the asset) / (the maximum asset’s price – the minimum price of the asset) ] * -100
It is noteworthy that the maximum and minimum price point of the financial entity in question is relative to the selected window of time. Now let put this formula to work in a hypothetical scenario as below.
For 21 days, the highest price of crypto KSI was $60, and its minimum price point was $35. The recent close price of this asset was $ 56. Hence, the computation of the Williams Percent Range based on the given example will be:
Wiiliams % R = [ (60-56) / (60-35 )] * -100
Williams % R = -16%
This means that the asset will be found in the Overbought levels as it conforms to the range 0 to -20, which is an implication that buyers are in control of the markets and that bullish exhaustion, as well as a bearish reversal, are imminent.
As indicated earlier, the default settings of the indicator set the length to fourteen days. This number is accepted as the standard per the recommendation of the creator of the Williams % R indicator. However, it is open to user configuration. There is not an absolute best setting available that works for all assets on the market; however, the best setting for an asset can be determined by traders through series of trial and errors based on solid factors such as the type of asset being traded, the duration of the trade, and many other elements.
Traders with limited time seeking to enter the respective market of assets usually resort to smaller time frames, whereas swing traders stick to a larger length of time for the settings of the indicator. To reiterate, the Williams % R indicator is prone to signaling wrong messages to traders, so investors and traders should use it with caution.
How do you interpret overbought and oversold signals with The Williams %R when trading cryptocurrencies?
Oversold Signals
Like most momentum-based indicators, the Williams Percent Range Indicator demonstrates oversold signals. The signal is said to be in the Oversold region when the indicator swings below the -80 mark and hovers between that mark and the -100 mark. The presence of the indicator in the said region communicates the dominance of sellers on the market of the asset. Hence, the intensity of the selling activities keeps driving the price of the asset low.
Like any asset’s market, the volume of sellers will eventually reduce and the buyers will take over once again. Hence, traders strongly look forward to an upward price reversal after the incidence of oversold signals. It is, however, not advisable for traders to instantly open a buy order once they recognize an oversold signal. This is so because the price of the asset can linger around in the oversold region for a while and can even further continue dipping. Hence, orders without proper risk management systems in place can attract huge losses or wipe-out of one’s capital in the worst-case scenario.
To these ends, it is recommended that traders wait patiently for the bullish reversal to commence before opening the buy orders with the appropriate take profit and stop-loss measures in place.
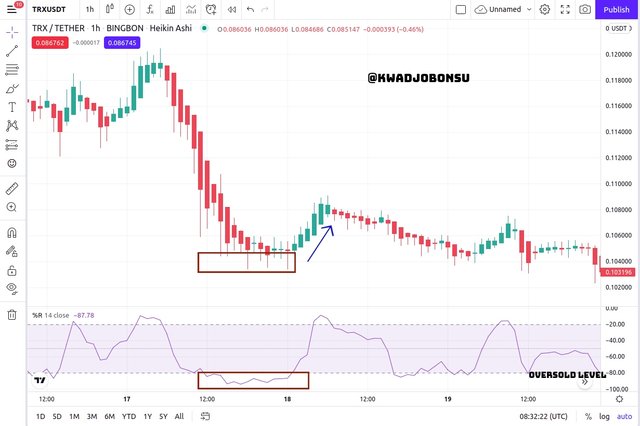
The image above is that of the TRXUSDT chart on the Tradingview platform. The Oversold region, which indicates the takeover of the market by sellers, is highlighted in the Williams Percent Range indicator. The Oversold region is also in congruence with the bearish price inclination of the asset. As expected, a bullish reversal developed after the selling activities reached a drained state. The bullish trend is in agreement with the upward price of the chart. This shows that buyers began to control the market at that particular point.
Overbought Signals
A Williams % R Indicator is also equally capable of conveying Overbought signs to traders and investors when applied. An Overbought signal is when the indicator oscillates beyond the -20 mark. Primarily, the area in between the -20 and 0 levels is alluded to as the Overbought zone. The movement of the indicator in this particular precinct means that the buyers are in charge of the market. As a result, the price of the asset continues to appreciate as the buying activity escalates.
The Buying dominance is not perpetual. It wears out after a while since there would not be enough volume of buyers to keep the momentum going. Accordingly, a bearish reversal is often expected after assets on the market enter the overbought region.
Traders are admonished against the opening of sell orders immediately the Williams Percent Range indicator communicates an overbought signal. This is because the price of the asset can sustain such momentum for an unpredictable amount of time. Hence, when traders open sell orders without proper risk management systems in place as well as enough capital to contain wild fluctuations, they can end up losing a significant percentage or all of their capital.
Therefore, it is recommended that traders wait patiently for the bearish reversal to begin before they execute sell orders with the appropriate risk management systems in place.
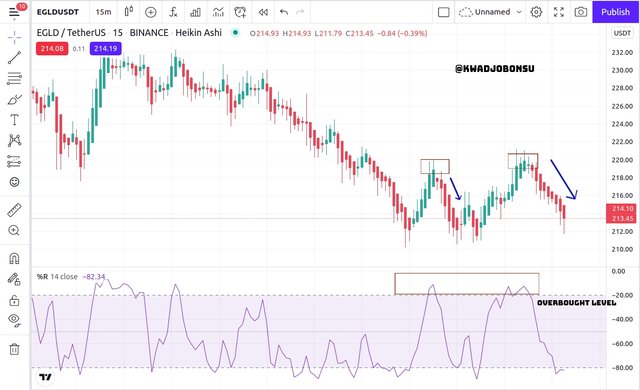
The photo above is the representation of the ELGDTETHER chart. The Overbought region, which designates the dominance of the market by buyers, is highlighted in the Williams % R indicator. The Overbought region is also in congruence with the bullish price direction of the asset. As expected, a bearish price reversal followed after the buying activities were exhausted. The bearish trend is in accordance with the downward price of the chart. This shows that sellers began to dominate the market in that circumstance.
What are "failure swings" and how do you define them using The Williams %R?
Failure Swing, which can also be called momentum failures, is the process whereby a strong upward or downward movement of the price of the asset fails to reach the -20 and -80 levels respectively and is instead followed by a violent reversal. The reversal swings serve as opportunities for traders to enter the markets to make profits off the market condition.
When an asset experiencing a bullish growth towards the overbought region fails to do so, it signals an exhausted bullish trend, and a bearish trend follows sharply in an intense manner. Traders can take advantage of such conditions to open sell orders to capitalize on the downwards trend.
Alternatively, when the asset on the market is experiencing a strong bearish movement towards the oversold region but fails to do so, it proves that the downwards trend has become weak. A bullish reverse commonly takes place in a violent demeanor. Traders cognizant of this swing can open buy orders to capitalize on the bullish direction to make profits.
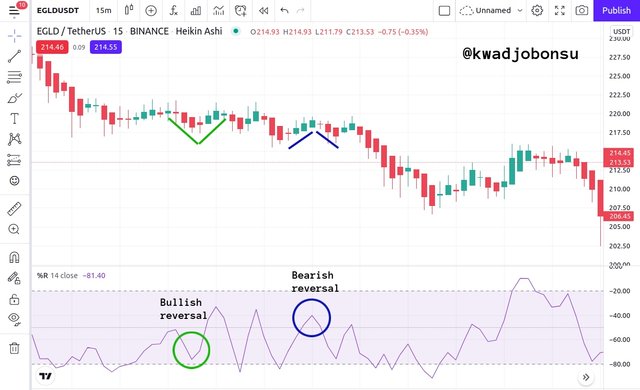
In the chart above, the EGLDTETHER pair experienced different failure swings at various points.
The highlighted green section displays a bullish reversal after the bearish movement of the asset in question failed to enter the oversold region. The reversal was sharp and strong as the downward movement had lost momentum and grown weaker. A bullish price reversal is also highlighted on the chart to show agreement with the signal of the Williams % R indicator.
Likewise, a bearish price reversal is shown with the green circle. Before the incidence of the reversal, the asset was moving strongly towards the overbought zone, but it became weak and lost the momentum to continue in that direction. The chart also shows a bearish price movement that is congruent to the signal of the Williams % R indicator.
How to use bearish and bullish divergence with the Williams %R indicator? What are its main conclusions?
During trading, investors and traders usually employ indicators for confirmatory purposes. Traders are regularly on the lookout for harmony between trends on the charts and that of the indicators to make sure they are all communicating the same message before they venture to execute orders based on such knowledge. As much as the Williams Percent Range indicator is good for confirming trends, it is equally a great tool for spotting divergence.
Divergence is basically the disagreement between the signals of an asset’s price chart and a technical indicator. The Williams Percent Indicator is very effective at indicating divergence. The event of a divergence on the market is often a key indication that a reversal is near as the momentum for the price direction keeps reducing. Traders often wait for the reversal before executing orders to make profits off the market condition. Divergence under the Williams Percent Range indicator is of two main categories: Bearish and Bullish Divergence.
Bearish Williams Percent Range Divergence
This is the type of divergence where the asset price direction on the chart is a bullish one, but the Williams % R indicator shows a bearish trend instead. This is an indicator that the bullish trend of the price is currently losing out the required momentum or buy volumes to sustain the trend. As a result, a bearish price direction draws near.
After the incidence of a bearish Williams % R indicator, traders stay alert for the emergence of a bearish trend so they can make market entries to capitalize off the downward direction of the asset’s price. Traders are advised to put in place a proper risk management framework to help secure their profits.
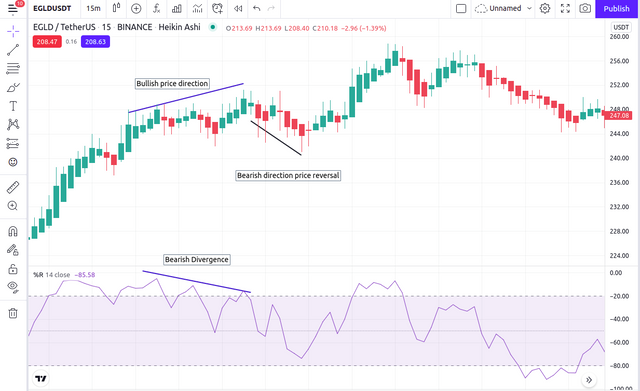
Considering the EGLDTETHER chart above, it is apparent that the price direction was initially in a bullish trend. However, there was simultaneously a case of divergence as the Williams % R indicator demonstrated a bearish movement of the asset. Shortly after that, a downward price movement of the asset was realized on the chart.
Bullish Williams Percent Range Divergence
This is the other form of divergence where the direction of the asset's price on the chart is bearish, but the Williams percent Range indicator signals a bullish trend rather. This is a sign that the bearish trend of the asset's price is experiencing drops of the requisite momentum or sell volumes to support the trend. To this end, a bullish price direction becomes imminent.
After the occurrence of a bullish Williams Percent Range indicator, traders stay on the lookout for the development of a bullish price trend so they can make market entries to capitalize off the upward price direction of the asset. Traders are also advised to put in place a proper risk management framework to help secure their profits with such orders.
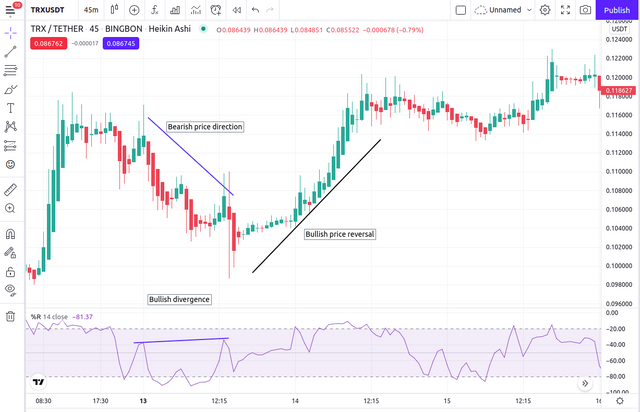
Acknowledging the EGLDTETHER chart above, it is clear that the price trend was originally in a bearish direction. However, there was concurrently a case of divergence as the Williams Percent Range indicator also demonstrated a bullish direction of the asset. Shortly after that, an upward price movement of the asset was realized on the chart.
How do you spot a trend using Williams %R? How are false signals filtered?
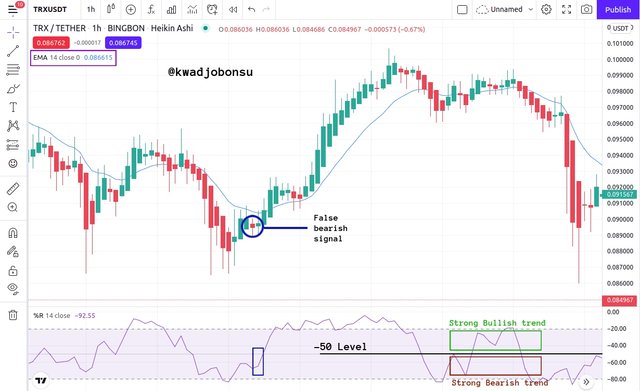
As mentioned earlier, the Williams Percent Range Indicator is an effective tool for spotting the trend of an asset on the market. A general rule is that a strong bearish movement is one that recedes below the -50 mark as highlighted with the red box on the chart above.
Alternatively, a strong upward direction of an asset is signaled when the Williams % R indicator moves above the -50 level. Hence, with the appropriate stop loss and take profit margins set, executed orders by traders for any trend after its emergence can fetch significant profits for traders. A buy order is executed when the indicator moves above the -50 level, whereas a sell order is executed when the indicator recedes below the -50 mark.
Traders rely on signals to make forecasts about the price direction of assets on the markets, but the incidence of false signals can mislead them into bad orders usually result in considerable losses. Hence, the utilization of multiple indicators is a common activity during trades. This activity helps traders to recognize false and misleading signals.
To filter out misleading signals during trade, a 14-period Exponential Moving Average Indicator is combined with a Williams Percent Range Indicator of length 14. This configuration makes it quite easy for traders of considerable experience to spot fake trends.
.jpg)
In the TRXUSDT chart above, it is clear that the Williams % R indicator was set in a strong bullish trend after its reversal from the Oversold region. The upward direction of the asset was confirmed by the bullish trend of the Heikin Ashi chart as well as the 14-period Exponential Moving Average.
Though the EMA early on functioned as a resistance to the price points, it is seen that the candlesticks emerged beyond the 14-period Exponential Moving Average Indicator. Taking all these into consideration confirmed the bullish trend of the asset at that particular point.
Use the chart of any pair (eg STEEM/USDT) to present the various signals from the Williams %R indicator.
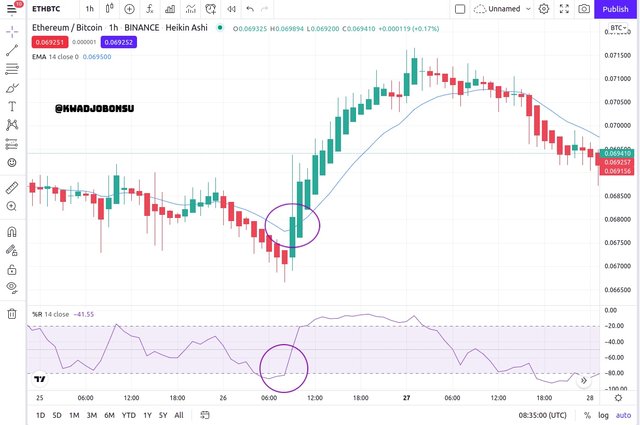
Sell Signal
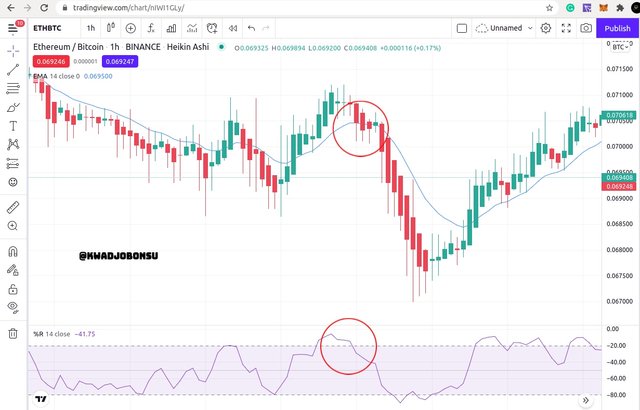
A look at the ETHBTC chart above shows that the highlighted portion of the Williams Percent Range Indicator is above the -20 margin. Hence, it is at the Overbought level. This means that the market was dominated by buyers during that period. A bearish reversal would have been expected by the trader, and indeed a reversal occurred.
The Heikin Ashi candlesticks also show congruence as they display a bearish movement of the price point of the asset. Bearish wicks are shown below each candlestick as the price continued to reduce. The Candlesticks also broke below the 14-period Exponential Moving Average indicator on the chart. All these confirmed a strong and valid bearish movement.
.jpg)
When executing orders, traders must be aware of their risk-reward ratios. In other words, traders must decide the amount of capital they are willing to lose as well as the maximum profit they are ready to walk away with. Various signal indicators have designated Stop loss areas and Take profit areas.
However, there are instances where putting such a Stop Loss margin into practice would seem counterintuitive to traders because it could wipe out their capital in the event of a bad trade. Hence for the stimulated trade, after the sell order was executed at the hypothetical entry point, the Risk-Reward ratio was approximately 1:3. I was willing to gain more assets from this valid signal than lose them.
Buy Signal
Looking at the ETHBTC chart above, it is clear that the highlighted section of the Williams Percent Range Indicator is initially below the -80 margin. Hence, it was in the Oversold region. This means that the market was controlled by sellers at that point in time. Accordingly, a bullish reversal was expected, and the reversal took place.
The Heikin Ashi candlesticks also show agreement with the reversal as the candlesticks demonstrate a bullish price movement of the asset. Bullish wicks are shown above each candlestick as the price continued to appreciate. The Candlesticks are also above the 14-period Exponential Moving Average indicator on the chart. All these confirmed a strong and valid bullish movement.
.jpg)
The Take Profit and Stop Loss margins were put in place for good risk management. It is apparent that I was primed to capitalize on this valid signal to secure profits leaving little room for losses as the ratio of risk to reward is about 1: 4.
Conclusion
As a powerful trading tool, the Williams % R indicator bases its operation on the momentum of the financial entity on the markets and signals favorable market entry points as well as exit positions to traders. In as much as it is good, the Williams % R is inclined to giving out incorrect signals.
Accordingly, it is prudent for traders to combine it with other indicators for confirmatory purposes. One of the common indicators used in conjunction with the Williams % R indicator is the EMA Indicator. When configured to the right setting, these multiple indicators can eliminate the frequency of misleading signals.
Much gratitude to Professor @kouba01 for this insightful lecture.
Hello @kwadjobonsu,
Thank you for participating in the 4th Week Crypto Course in its 4th season and for your efforts to complete the suggested tasks, you deserve a Total|10/10 rating, according to the following scale:
My review :
Work with excellent content, because you have taken every question seriously, allowing you to get answers that are precise and in-depth in its analysis and clear in its methodology.
Thanks again for your effort, and we look forward to reading your next work.
Sincerely,@kouba01
Thanks for the review professor.
Also, I realized that every person who had a 10/10 in your class (thus me and the user @bukkyi4u) received 10% weight of @steemcurator01 instead of the 15% vote weight. Is this the norm?
Yes @kwadjobonsu. I was going to complain about that to professors @kouba01 and @yohan2on because those that scored lower than us received better rewards. I don't understand.