Introduction to the Principles of Crypto Analysis - Crypto Academy S4W7 - Homework Post for @imagen
.jpg)
Hello friends. I hope you are having a great time? This post is my submission to Professor @imagen's class on Introduction to the Principles of Crypto Analysis. The assignment was given as follows:
1.) What are the differences between Fundamental Analysis and Technical Analysis? Which one is used most often?
2.) Choose one of the following crypto assets and perform a Fundamental Analysis indicating the objective of the Project, Financial Metrics, and On-Chain Metrics.
Cardano (ADA)
Solana (SOL)
Terra (MOON)
Chiliz (CHZ)
Polkadot (DOT)3.) Make a purchase from your verified account of at least 10 USD of the currency selected in the previous point. Describe the process. (Show Screenshots).
4.) Apply Fibonacci retracements to the previously selected asset with a 4-hour time frame on the platform of your choice. Observe the evolution of the price at 24 and 48 hours, did it go up or down in value? Look to identify resistance and support levels. (Show Screenshots at 0, 24, and 48 hours of purchase where the date and time are observed).
5.) What are Bollinger Bands? How do they apply to Crypto Technical Analysis? With which other tool or indicator do you combine Bollinger Bands to analyze a Crypto? Justify your answer.
6.) Conclusions

What are the differences between Fundamental Analysis and Technical Analysis? Which one is used most often?

Fundamental Analysis
There are several means that investors and traders resort to when they are analyzing the market condition of an asset in order to determine the best entry and exit points that can fetch them a noteworthy amount of profits. One of the widely and traditionally used methodologies is the Fundamental analysis of an asset.
Though conventionally associated with the stock markets, the fundamental analysis of a financial asset is highly compatible with cryptocurrencies. Fundamental analysis deals with the assessment of qualitative and quantitative data available on a cryptocurrency asset to determine the intrinsic value of the asset.
The result of such analysis aids traders and investors to identify various opportunities on the market of the asset that can lead to the acquisition of profits. The comparison between the analysis performed and the actual value of the asset’s market serves as a pivotal indicator that aids investors and traders to discern where the market is overvalued or undervalued. In the case of an undervalued asset, investors can make a good market decision of investing their resources in the market of the asset to benefit from future growth of the digital element.
Alternatively, investors avoid fresh investments in overvalued assets since the market can result in a violent devaluation. However, if the investor or the trader owns cryptocurrency assets that are indicated to be overvalued according to the fundamental analysis, the assets can be sold to secure profits. These profits can be used to buy back assets when the digital financial entities enter an undervalued phase and then sell to realize even more profits once they become overvalued again.
Fundamental analysis is of common usage among cryptocurrency investors because the thorough qualitative and quantitative analysis of the asset can help them recognize fraudulent projects. There are over thousands of cryptocurrency projects, and an immense number of these projects are unregulated. Some of these projects are also short-lived as they fail to deliver as preached.
There are also high incidences of scams or misleading projects that are created to swindle investors and steal their capital. Hence, the implementation of fundamental analysis strategies helps traders and investors avoid such projects.
Some of the factors that are considered in the fundamental analysis include the trustworthiness or reputation of the project developers, the location of the project, number of users, market capitalization, daily volume of the asset, and many others.
These metrics provide valuable information about the current market performance or state of a cryptocurrency asset. Even better, fundamental analysis can be combined with other analytic strategies such as technical analysis and others to obtain a more solid assessment of a cryptocurrency element.
Technical Analysis
Technical analysis is another methodology that traders and investors apply in the assessment of the performance of a cryptocurrency asset to make forecasts about the price direction of the element based on historical data of the asset’s market.
This is so because traders believe that price direction patterns repeat on the market and that past data is a good indicator of an asset’s future direction. The price swings on the market are caused by the collective efforts of buyers and sellers.
The cryptocurrency market is regarded as highly volatile due to the active buying and selling activities of traders. The prices of assets can violently increase or decrease within a short time frame, and most of these movements begin to follow a pattern when studied over time.
As time progresses, these digital financial entities form support and resistance points as well as trends. When determined by traders and investors, these prices direction help traders to predict with a decent degree of accuracy so that they can determine good entry and exit points on the asset’s market to make profits.
The trends of assets are of three main types: bullish price direction, bearish price direction, and sideways market. The bullish trend is an upward movement of the price point of the asset, and it indicates that the buyers are in control of the market as they are accumulating more of the assets.
The bearish trend indicates the dominance of sellers on the market and as a result, the price of the asset continues dropping. A sideways market is primarily about an asset that has not established a unidirectional movement due to the indecisiveness of the traders.
In technical analysis, charts are predominantly used in the evaluation of cryptocurrency assets. These charts, by default, employ candlesticks of two main colors to indicate the nature of the market condition of the digital currency. The colors are Red and Green. In some charts, white or black color is rather used.
The white or green colors stand for bullish price direction, whereas the red or black color represents a bearish market condition. These charts are viewed with respect to specific time frames. These time frames show the performance of the asset within a particular period of time.
Shorter time frames are frequently utilized by short-term traders, while longer time frames are implemented by long-term traders. Short-term traders may resort to minutes marked time frames to gain a clear assessment of the asset’s performance within such small-time restrictions. Long-term traders prefer to maintain the orders for far longer, and hence use hourly, weekly, or even monthly time frames to analyze the long-duration performance of the digital element.
Additionally, technical analysis employs technical indicators in the assessment procedure. These technical indicators utilize the data of the digital currency to perform various computations. The results of the indicator are often represented graphically as an overlay on the chart or a separate grid box below or above the chart.
These indicators are primarily used for the purpose of confluence, trend analysis, and identification of divergence of the asset. All these elements help traders and investors to make more solid financial decisions that fetch them profits and also aid in proper risk management strategies.
Technical analysis is regularly used in combination with fundamental analysis to gain a broad and in-depth scope of the market condition and trustworthiness of a project and its financial element on the market.
| Fundamental Analysis | Technical Analysis |
|---|---|
| It utilizes qualitative and quantitative information of the project | It relies on charts, price actions, and technical indicators. |
| It assesses the intrinsic worth to determine the fairness of the asset’s market value | It is used to forecast the price direction and to find vantage entry as well as exit points |
| Mostly used for a long duration investment | Investment usually are of relatively shorter duration |
| It employs previous and future data for assessment | Only historical data is used in asset assessment |
| It is primarily associated with investment | It is chiefly centered on trading. |
Choose one of the following crypto assets and perform a Fundamental Analysis indicating the objective of the Project, Financial Metrics, and On-Chain Metrics. Cardano (ADA) Solana (SOL) Terra (MOON) Chiliz (CHZ) Polkadot (DOT)
Polkadot

Polkadot is a cryptocurrency platform that was developed by an individual called Gavin Wood in collaboration with the Web3 Foundation. Polkadot permits distinct and multiple cryptocurrency blockchains to connect in a safe environment for the purpose of communication and exchange of data. It is a decentralized ecosystem, whereby every data or transaction is publicly verifiable.
This also means that the Polkadot platform relies on multiple nodes for connection. Therefore, the failure of one node will not affect the operation of the system. This characteristic confers to Polkadot a reliable and robust uptime. The primary goal of Polkadot is to create an internet of blockchains by serving as a base for the development of another blockchain.
Polkadot also possesses several features that secondary blockchains on the Polkadot network will inherit. Some of these features include high scalability, speed, and a decentralized framework as well as governance. Efficiency on the Polkadot network is ensured by means of Sharding. Transactions on the Polkadot network are of high speed, and this form of scalability makes projects built on Polkadot open to diverse use cases.
The Polkadot platform employs the Proof of Stake mechanism in its operation. Hence, there is no need to mine its digital assets with the aid of high power-consuming rigs as done in projects that rely on POW. This makes the Polkadot environmentally friendly and less likely to attract bans from governmental institutions.
As required of all POS mechanisms, participants are required to stake the native token of the Polkadot network called DOT in order to perform the validation tasks. The validators are nominated by the stakeholders. Also, should a validator launch a malicious attack, the committed tokens or coins can be burned to serve as a punishment.
Also, participant of the network who possesses the Dot tokens is given the right to perform some governance roles. Instances of such tasks include the nature of upgrades, decisions regarding the ecosystem, and many others.
The Polkadot platform is regarded to rival the Ethereum network and provides better speed and minimal transaction fees than the Ethereum blockchain. The interoperability of the blockchain feature of the Polkadot network also grants it a far higher advantage over the Ethereum blockchain.
As mentioned earlier, DOT is the native cryptocurrency token of the Polkadot ecosystem. During its Initial Coin Offering in 2017, the team was able to raise approximately one hundred and forty million Dollars. Furthermore, the project receive one hundred million dollars worth of funds from its two private sales a few years ago.
These tokens have several utilitarian functions in the Polkadot ecosystem such as governance purposes and staking to earn more rewards. It can also be used for a special purpose called Bonding. This is when more DOT tokens are acquired with the aim of introducing additional parachains on the network. The token can also be purchased on various exchanges.
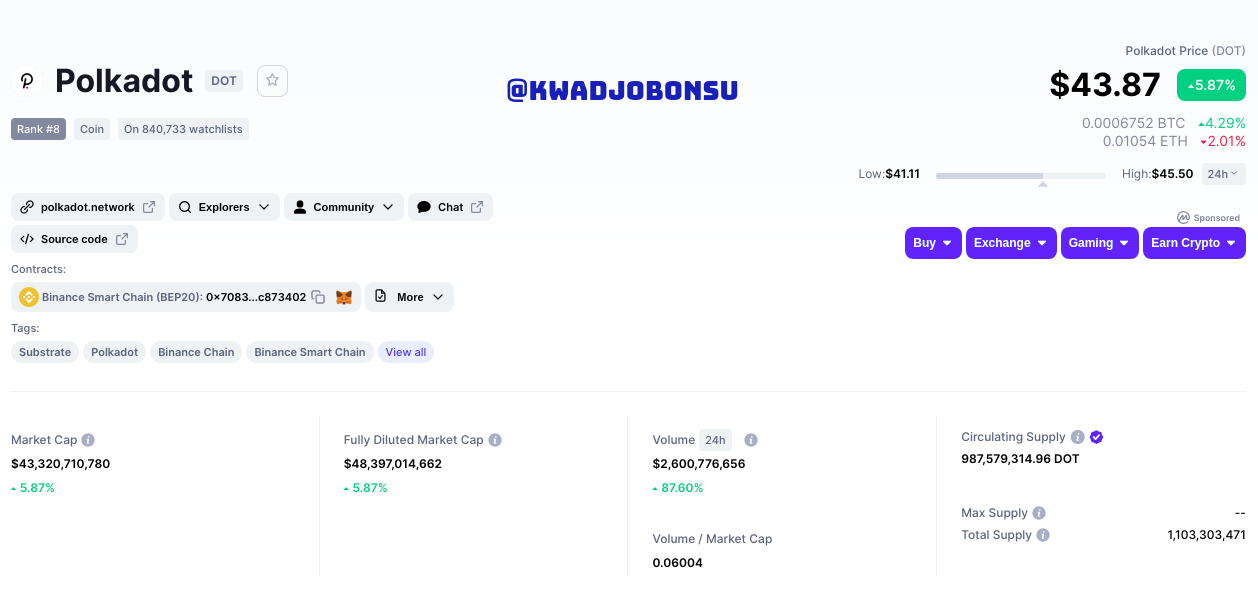
At the time of visit, the DOT coin was ranked 8th among all the cryptocurrency coins in the world and was selling at $43.87, with a 24-hours low of $41.11 and a 24-hours high of $45.50. The market capitalization of the DOT coin was $43.3 Billion and a fully diluted Market capitalization of $48.3 Billion.
The 24-hours volume of the Polkadot coin is around $2.6 Billion and has a Volume to MarketCap ratio of 0.06004. There are slightly over 1.1 Billion DOT coins supplied. However, 987 Million DOT coins are in circulation.
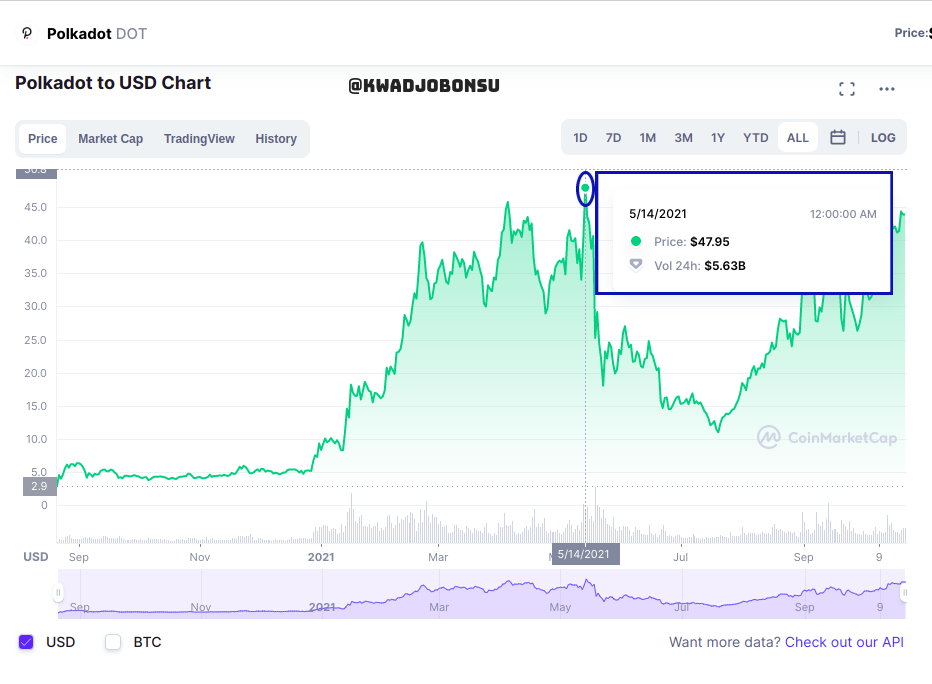
Analysis of its price action since it was publicly available for trade indicates that the All-time high worth of the DOT coin happened on 14th May 2021 at 12:00 AM. The price point of the DOT coin was $47.95 with a 24-hours trading volume of $5.63 Billion.
After that period, a violent sell-off happened on the market all the way to the early weeks of July 2021. Steady but oscillatory growth has since been the norm from that point.
.jpg)
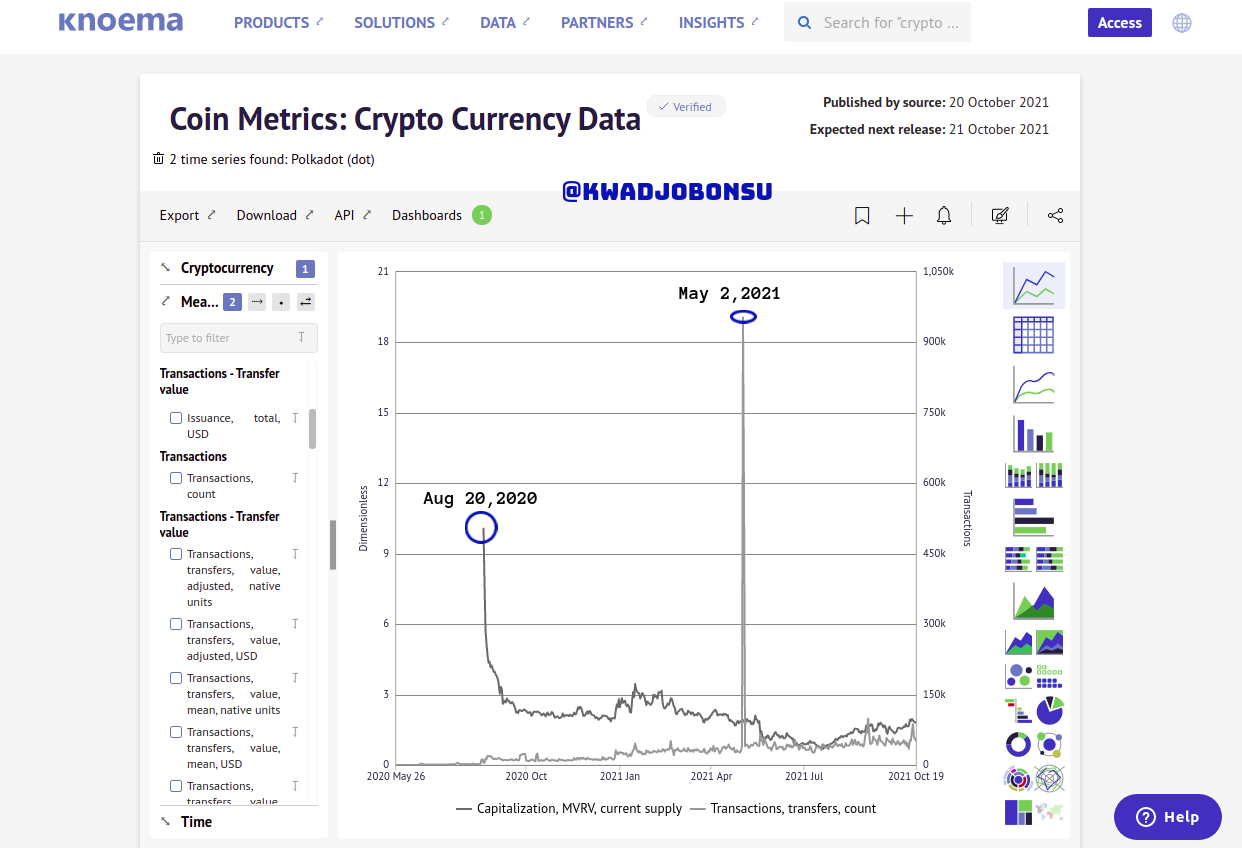
The on-chain metrics of the Polkadot platform give a clear indication of how active the network is. The light gray line represents the transactions, transfers, and count. The deep gray line is an indication of the capitalization, MRVR ratio, and the current supply.
It can be seen that the capitalization, current supply, and MVRV of the network had a current dimensionless score of 1.81 at the time of visit. The highest score was on 20 August 2020 with a dimensionless score of 10.7, and since then the dimensionless score of 3 has become the resistance point.
The transactions, transfers, and count of the Polkadot network at the time of visit was 51,667 and it recorded its highest transaction on 2 May 2021 with a whopping 953,169 transactions on the network. Since then the Polkadot network has been experiencing less than 150,000 transactions for a while.
Make a purchase from your verified account of at least 10 USD of the currency selected in the previous point. Describe the process.
The Binance desktop application was used for this demonstration. I used my Fiat and Spot wallet reservoir for the purchase of the DOT coins.
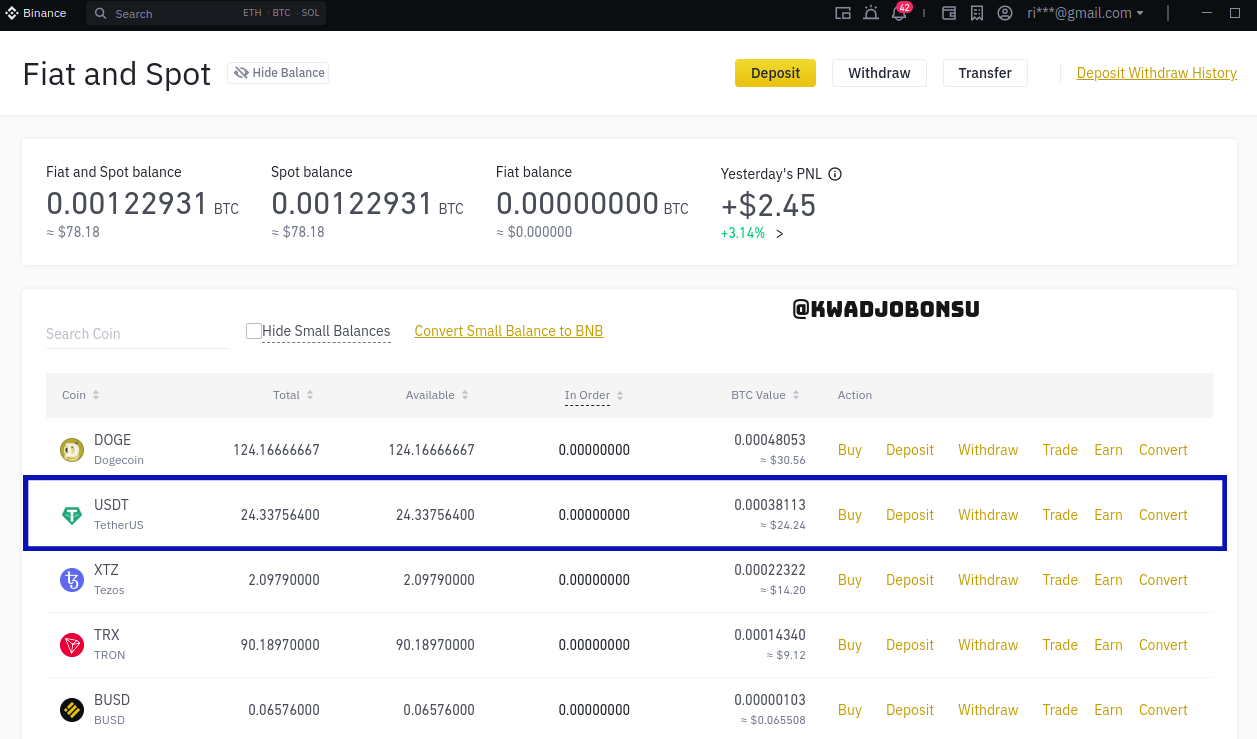
I had $24 worth of USDT in my Spot wallet on Binance. This will be used in purchasing the DOT coin on the market.
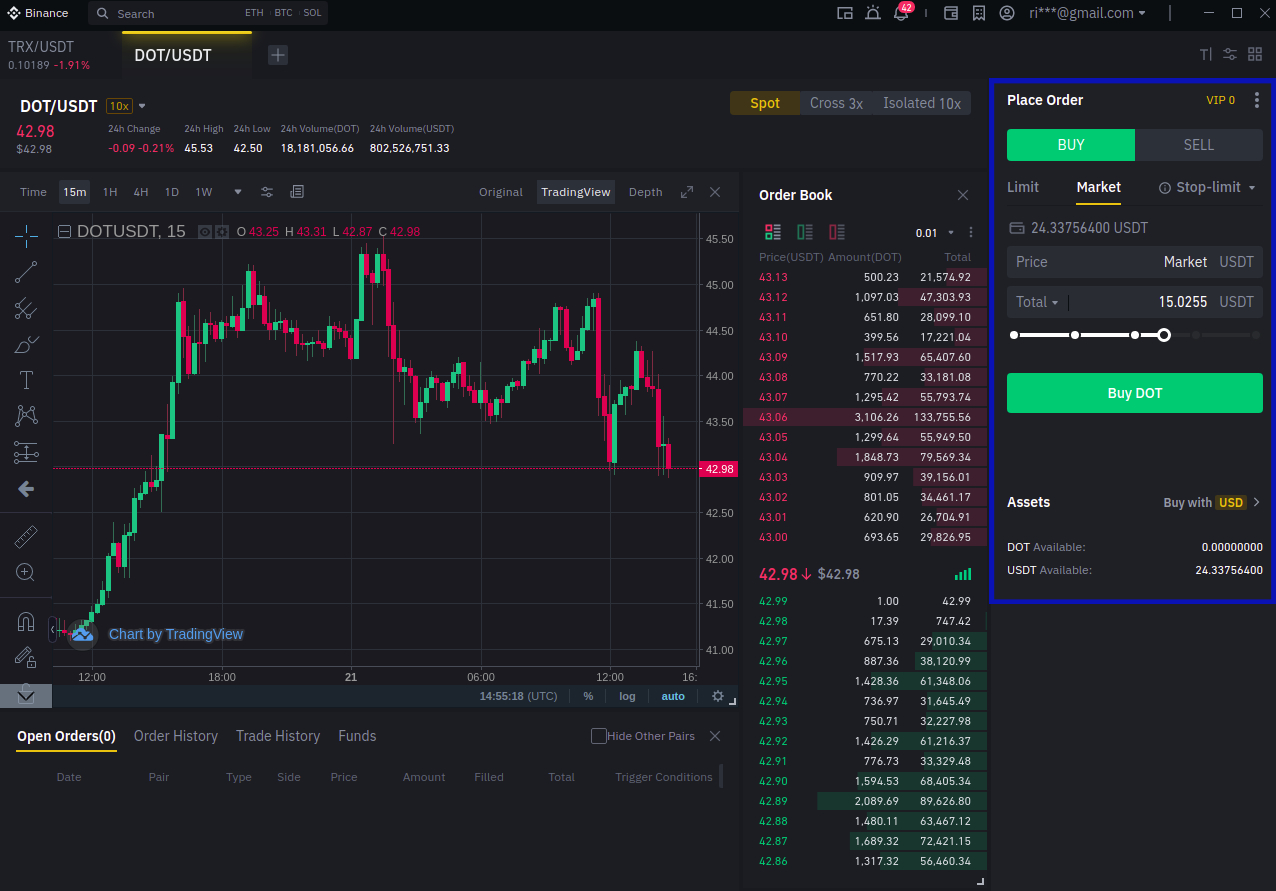
The DOT/USDT pair was selected. I executed a buy market order with 15.0255 USDT for the Polkadot (DOT) coin. I clicked on the Buy button.
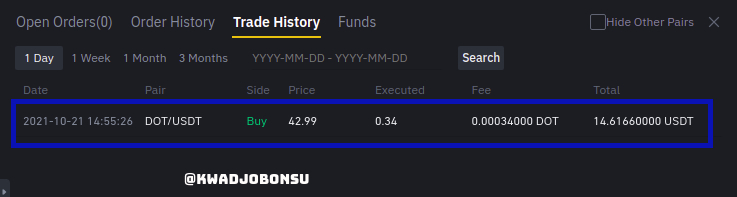
The order was filled instantly. At the market price of $42.99, I obtained 0.34 DOT in exchange for 14.6166. The transaction fee was 0.00034 DOT.
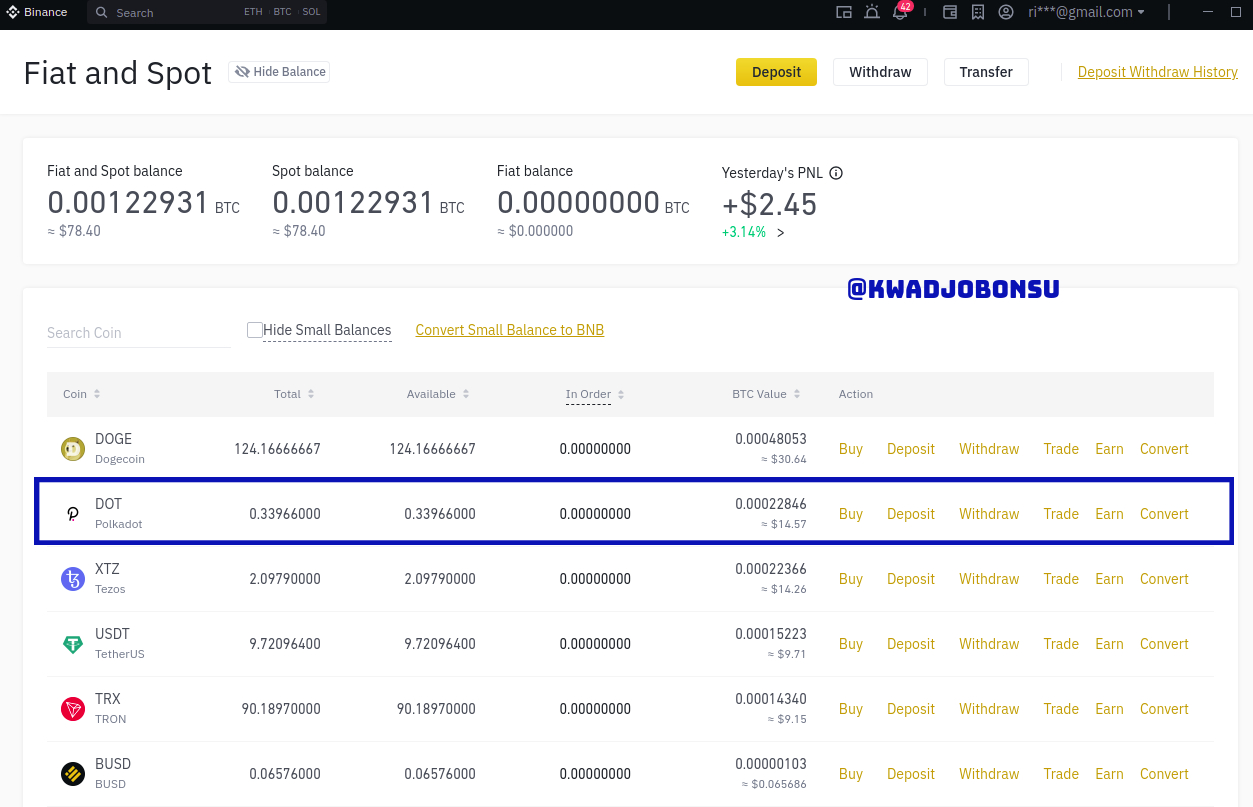
It can be observed that 0.33966 DOT has been added to my portfolio of cryptocurrency assets in my Binance Spot wallet.
Apply Fibonacci retracements to the previously selected asset with a 4-hour time frame on the platform of your choice. Observe the evolution of the price at 24 and 48 hours, did it go up or down in value? Look to identify resistance and support levels.
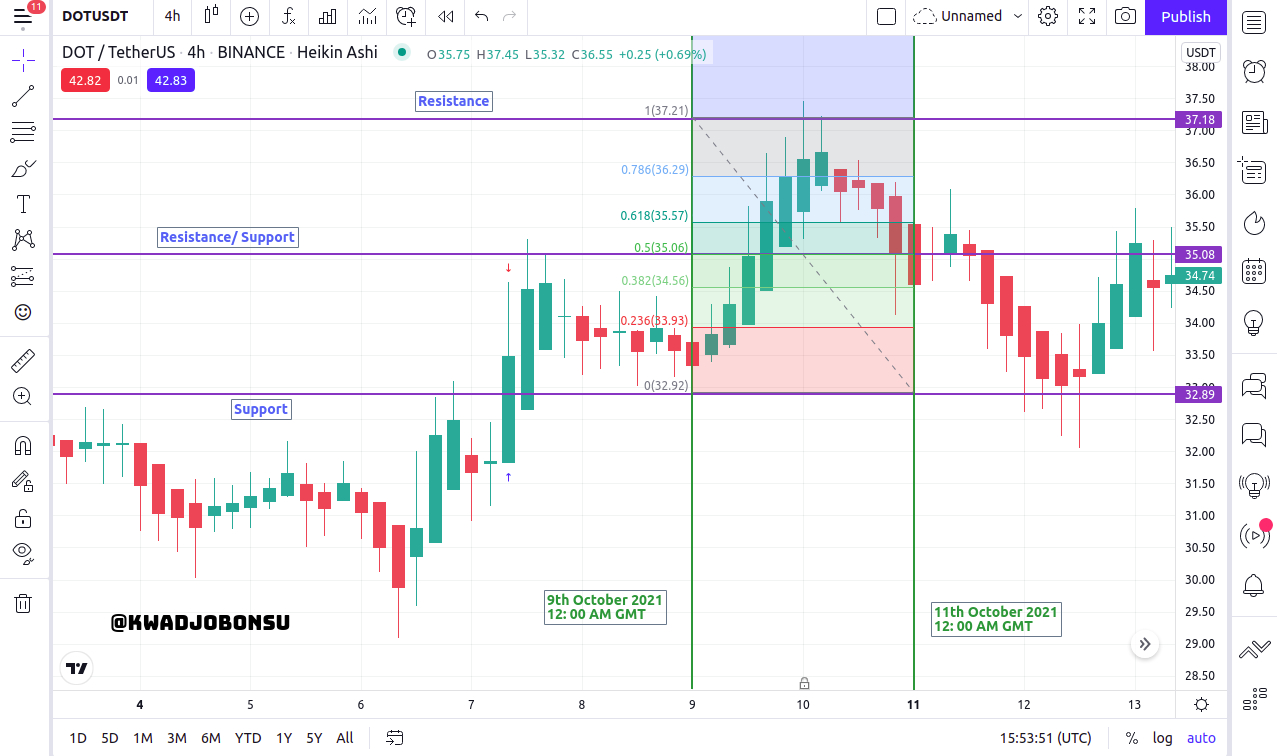
For this section, the Tradingview platform was used. The DOTUSDT Binance pair was selected, and the 4-hours time frame was used. The starting point or the 0 hour for this demonstration was the 9th October 2021 at 12:00 am GMT date.
According to the lecture notes, a bullish price direction or an upward movement is valid when the 1 or 100% margin of the Fibonacci Retracement tool aligns with the lowest point of the period under consideration while the highest price point corresponds to the 0 or 0% margin. When implemented well, the Fibonacci Retracement tool may lead to the creation of a support margin. This usually happens at the 50% mark of the Fibonacci tool reading.
Alternatively, for bearish price or downward movement of an asset on the market, the lowest point will be in line with the 0% or 0 margins of the Fibonacci Retracement tool, whereas the highest price point will correspond to the 1 or 100% margin. A support level is often generated, and it happens at the 50% level of the retracement tool.
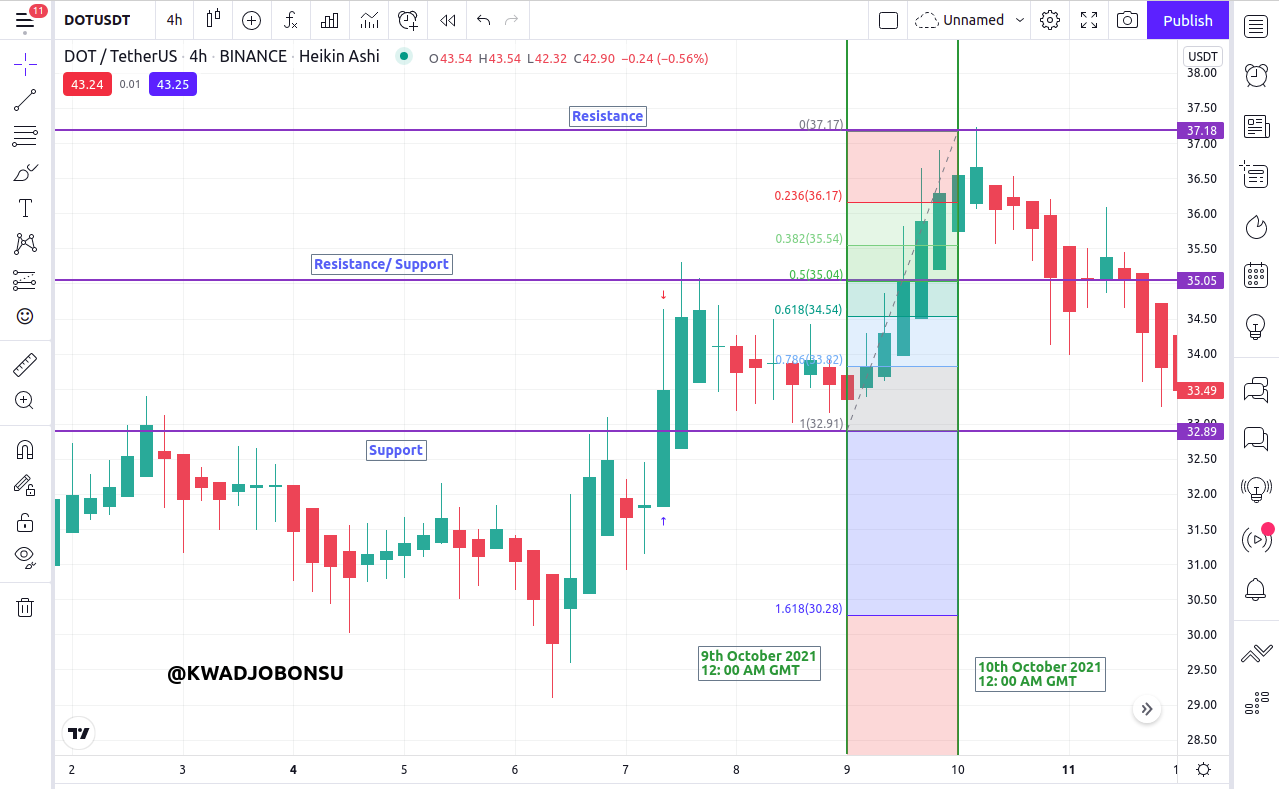
In the image above, the individual support and resistance levels were identified. Looking at a 24 hours time range, thus from 9th October 2021 12:00 GMT to 10th October, 2021 12:00 am, an upward trend was identified.
With the application of the Fibonacci Retracement instrument, the least price point of the time range under consideration matched to the 100% or 1 margin of the retracement tool, and the highest price point coordinated with the 0% or 0 levels of the Fibonacci retracement instrument. The 0.5 or 50% margin of the retracement tool corresponds to a support level as the $35.05 price point.
In the screenshot above, the respective support and resistance levels were identified. Looking at a 48 hours time range, thus from 9th October 2021 12:00 GMT to 11th October, 2021 12:00 am, an upwards trend which later reversed into a downward price direction was identified.
With the implementation of the Fibonacci Retracement tool, the minimum price point of the time range under consideration corresponded to the 0% margin of the retracement tool, and the highest price point matched with the 1 or 100% level of the Fibonacci retracement tool. The 0.5 or 50% margin of the retracement tool corresponds to a support level at the $35.08 price point.
What are Bollinger Bands? How do they apply to Crypto Technical Analysis? With which other tool or indicator do you combine Bollinger Bands to analyze a Crypto?
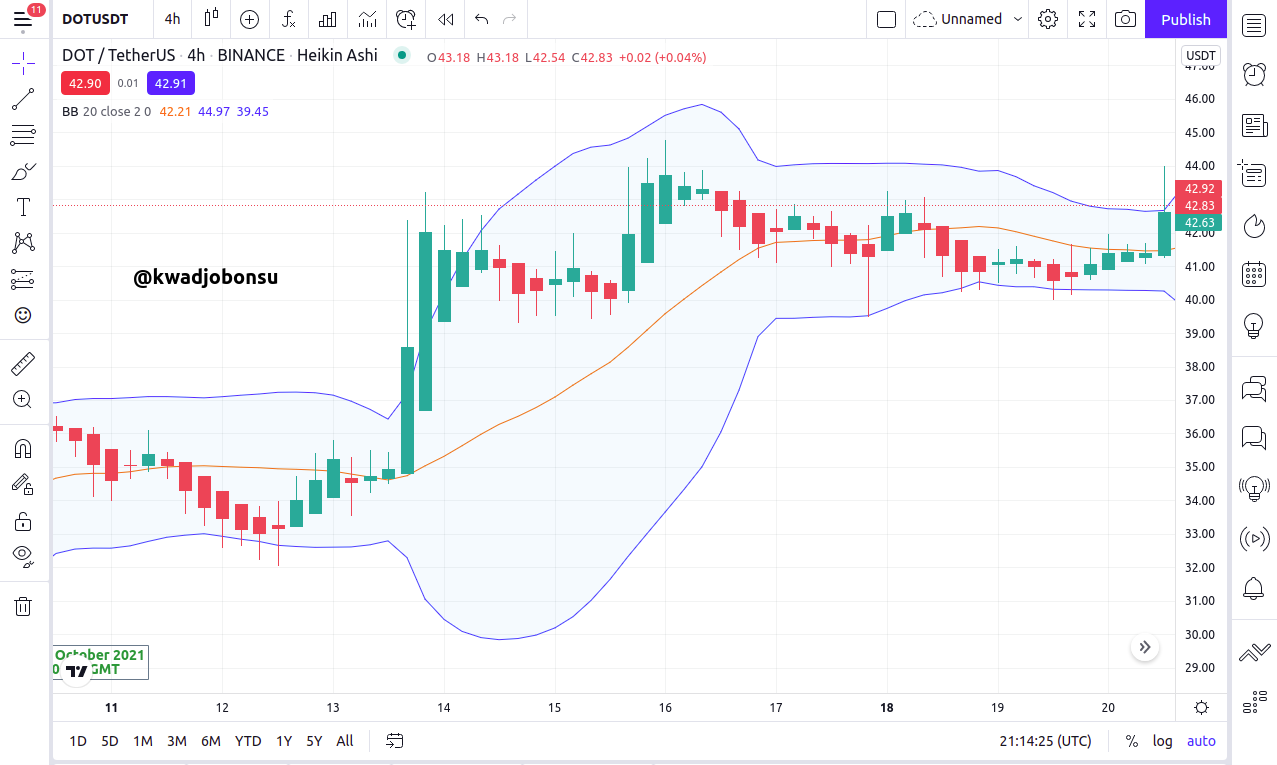
The Bollinger band is overlaid on the chart and comprises three lines. The middle line is, by default, a moving average indicator that is open to user configuration. The upper and lower lines are positioned according to the selected standard deviation from the middle line.
These lower and upper bands are key indicators of an asset’s trend strength. The availability of such information can help traders make critical market decisions on the respective entry or exit points to acquire profits.
A bullish trend is demonstrated by a consistent rising of the candlesticks toward the upper band. This shows the dominance of buyers on the market, and it also signals a potential reversal on the market.
For bearish trends, the candlesticks fall towards the lower band. The downward movement is caused by the control of sellers on the market. The incidence of a strong downward direction signals an impending upward reversal.
Though it is a genuine volatility indicator, the Bollinger band has some demerits such as its lagging characteristics and slow sensitivity to price fluctuations. Also, the default standard deviation may not be suitable for various timeframes and cryptocurrency assets.
Hence, traders need to spend more time experimenting with the indicator to figure out the appropriate settings for the trades. It is also not advised to use the indicator alone. Instead, other sensitive indicators such as the Stochastic or RSI can be used in combination with the Bollinger Band indicator to check for confluence.
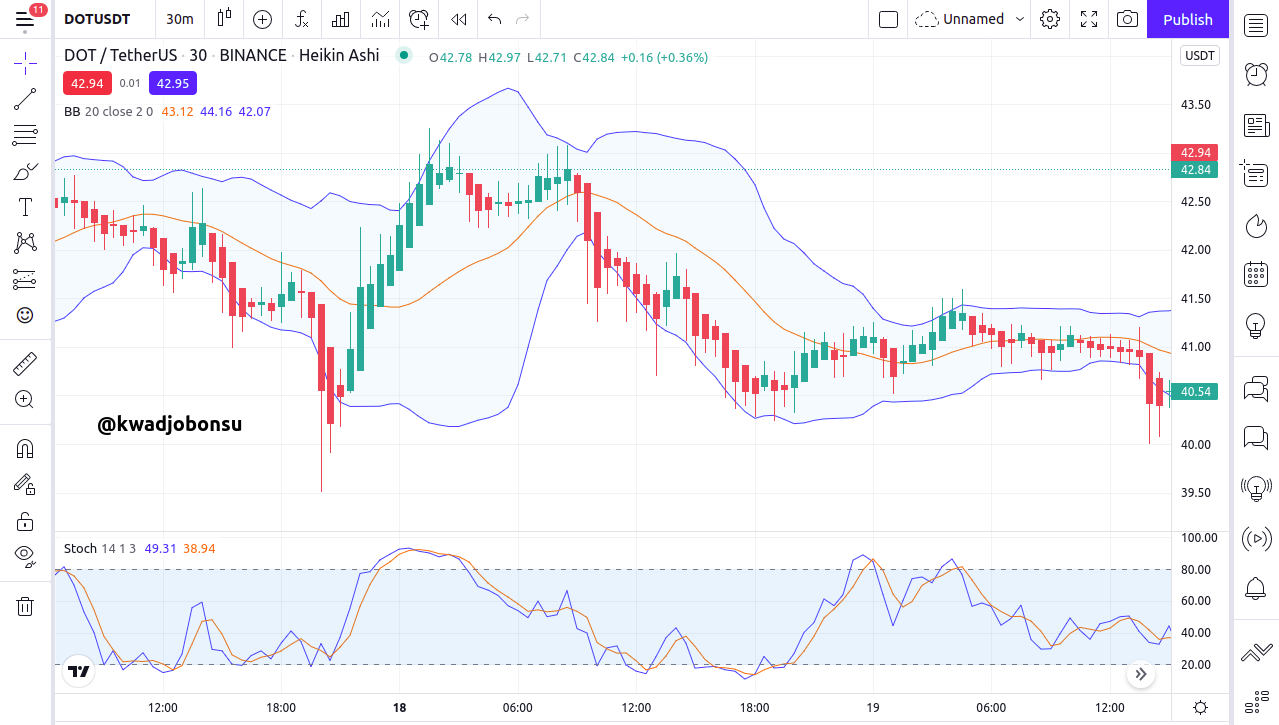
A confluence between the Stochastic overbought region and the upward trend of the Bollinger band can help traders determine the appropriate market entry point to capitalize off the impending reversal.
Likewise, an agreement between the Oversold region in the stochastic and the downward trend of the asset on the market will be a good indication of the entry point for making profits off the imminent bullish reversal.
Conclusion
Investors and Traders both analyze the cryptocurrency before committing to it. Fundamental analysis is common among investors whereas technical analysis is regularly used by traders.
A combination of the two forms of analysis is recommended to gain an all-around perspective of the project and its virtual financial asset. The primary goal of applying these analytic strategies is to acquire profits from one’s investment.
Fundamental analysis has three main areas of assessment. The project itself is assessed, the financial performance of the asset is analyzed, and the on-chain data of the asset performance is also tracked.
Technical analysis, on the other, employs charts, price actions, and technical indicators in determining how well an asset has been performing.
The signals generated from the assessment can help traders determine vantage points for entry and exit into the market in order to secure profits.
This lesson has truly been immersive and educative. I thank Professor @imagen for the opportunity to learn such crucial lessons.
Gracias por participar en la Cuarta Temporada de la Steemit Crypto Academy.
Felicitaciones, continua esforzandote, espero seguir corrigiendo tus asignaciones.