Steemit Crypto Academy Season 5 Week 1 [Beginner's Course] - Understanding Trends: @lazimo

I welcome you all to the season 5 week 1 of the Steemit Crypto Academy. I have been able to read and understand the lecture by professor @reminiscence01 about "UNDERSTANDING TRENDS."
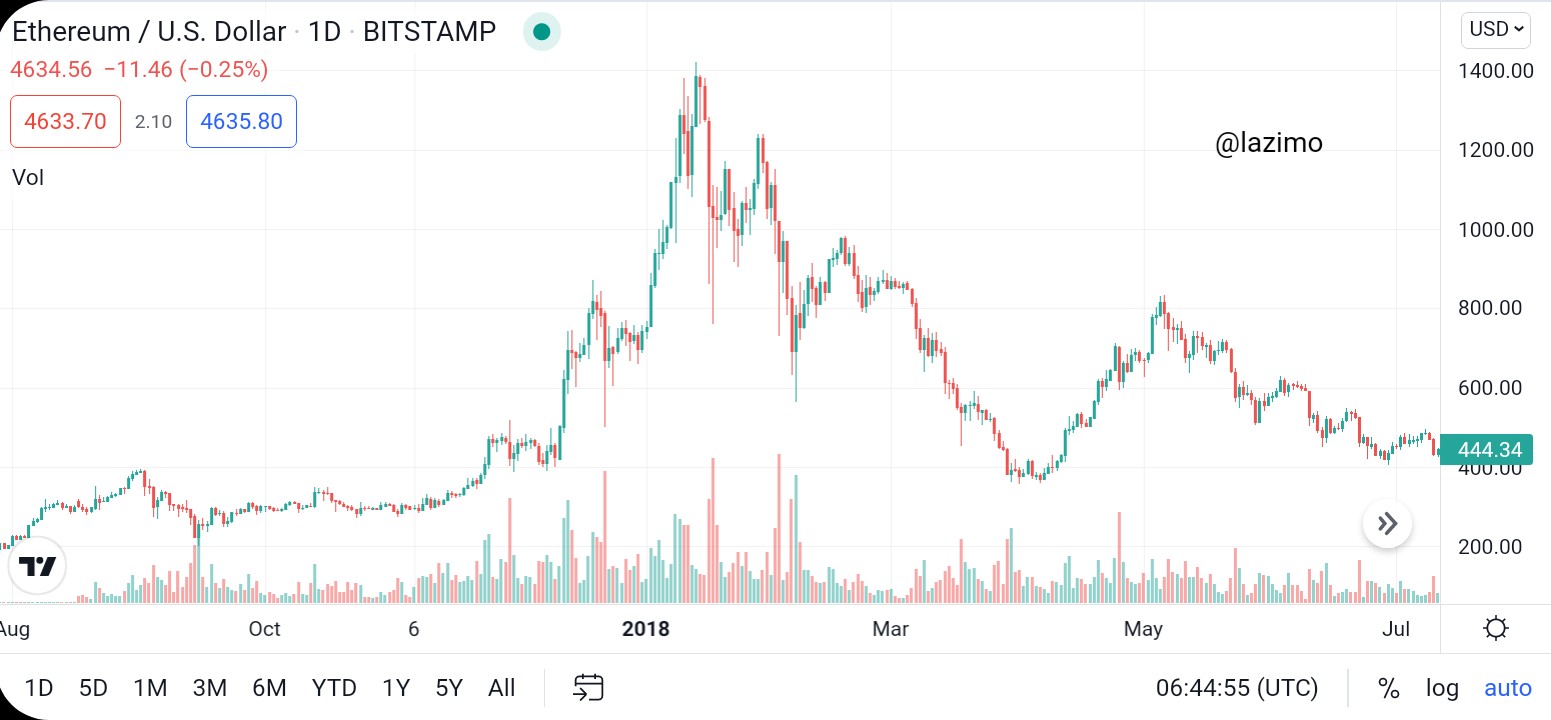
When the market is trending, it give a specific information to traders. The trend can either be bullish trend or bearish trend. This lets us know who's controlling the market between buyers and sellers. Trends helps traders to know the perfect time to purchase on a particular coin and the perfect time to sell. See screenshot below.

From my standpoint , Trending market is said to be when market price are heading or are in motion to a particular direction, which can move upwards or downwards in a given timeframe, which can move higher highs and higher low when it comes to uptrending then moves lower low in downtrend motion.
Market trend can be either upwards or downwards, when the market is trending upwards, it moves up and down but will not cross the higher low. Trending downwards shows a negative move in the market which also tells traders that buyers are in control of the market. Traders usually make use of technical analysis to be able to spot or recognize market trends.
We have 3 different types of trends which are the uptrend, downtrend and sideways trend which can be also called ranging market and this is where the price tends to be bounded above and below by consistent levels of support and resistance.
We usually hear people talking about bulls and bears, this is all about finicial market. What does the bulls and bears have to do with that? Now let me explain.
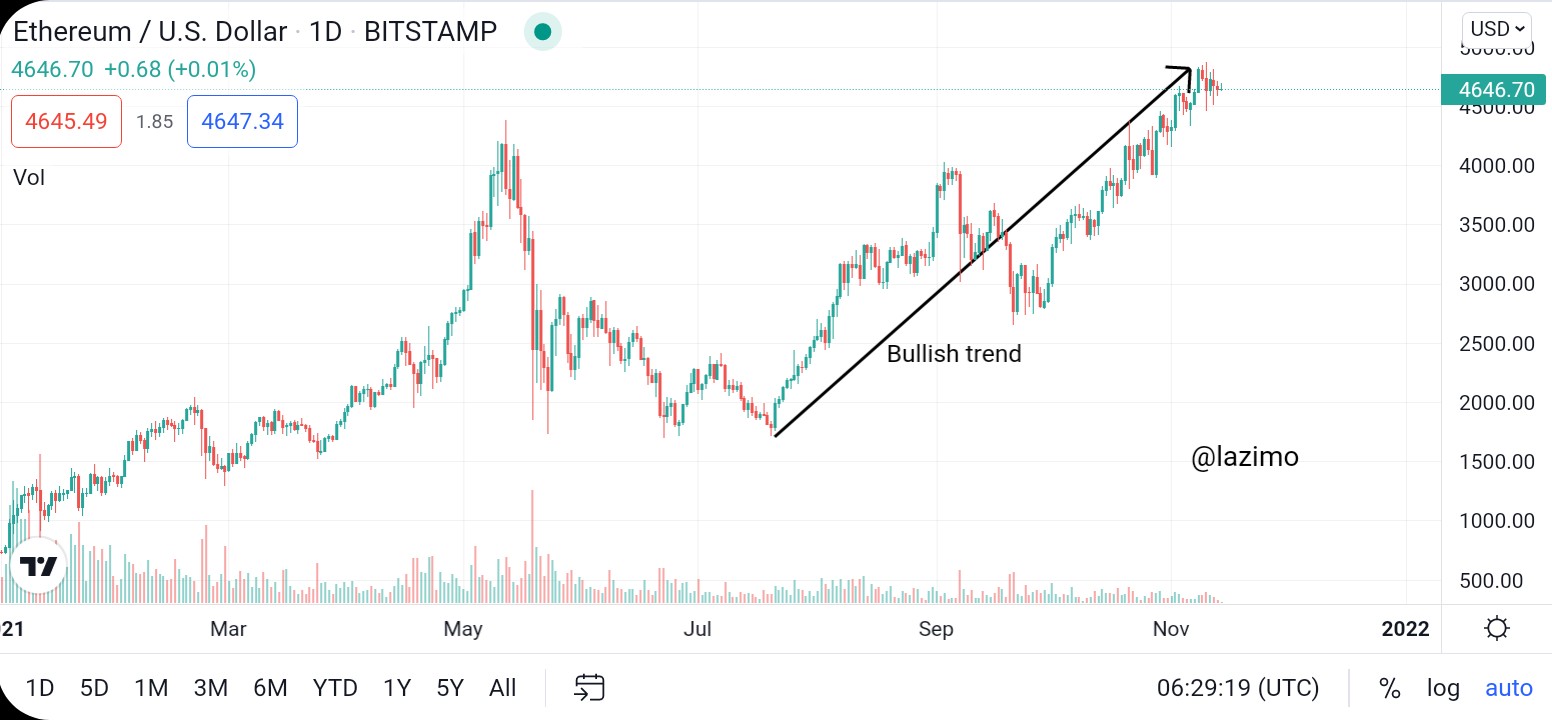
Bullish trend is when the market makes successive higher highs and higher lows. Bullish trend is basically associated with good, i.e the price is going upwards. When the bulls (buyers) are in control of the market that is when we usually see the market price increasing. When being bullish, you are expecting the market price to rise. It is a positive move in the market price. See screenshot below
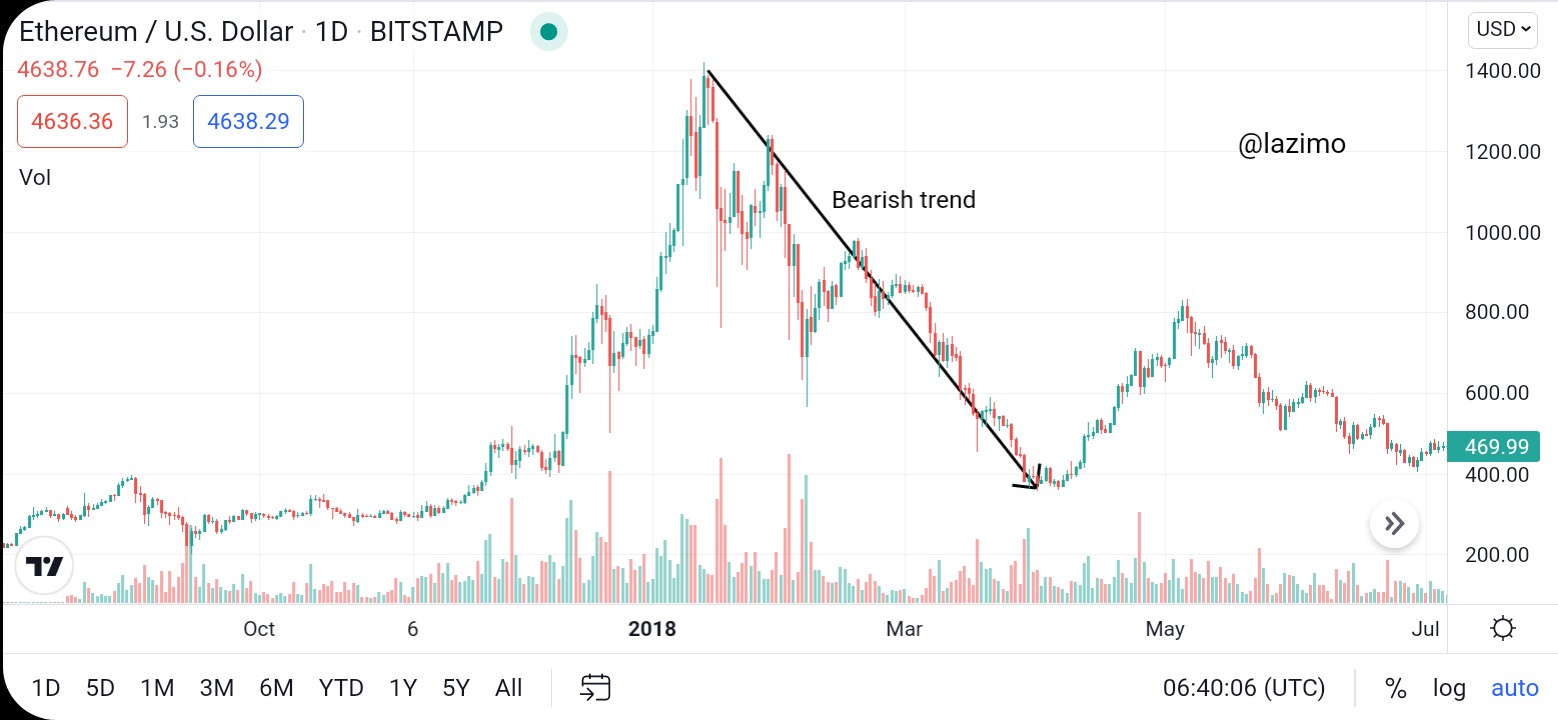
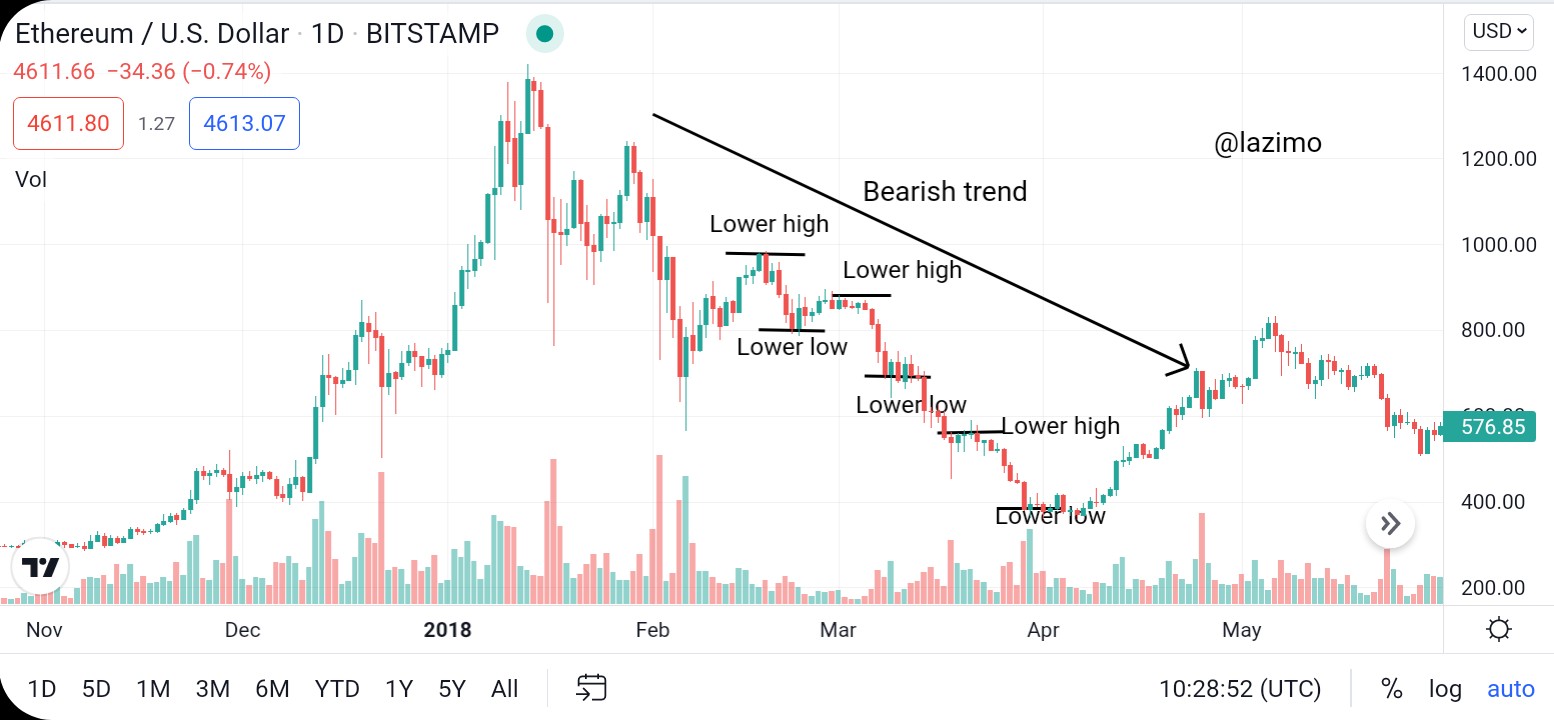
Bearish trend is when the market makes successive lower highs and lower lows. Bearish trend indicates the falling of market price and things are not going so well and we usually see the price trending downwards. This usually happens when sellers are in control of the market so the markets moves lower and lower. When being bearish, you are expecting the market price to fall. It is a negative move in the market price. See screenshot below
2) Explain the following trend identification and give an example of each of them. (Original screenshot needed from your chart). Do this for a bullish and a bearish trend.
i) Market Structure.
ii) Trendlines
When you look at the price chart, the first thing that comes to your mind should be, "Should i be buying? Or should i be selling? Or should i leave the market? Is this chart telling me that i should be looking for buying opportunities or selling opportunities?. Market structure help you to know the decision to make.
In a simple explanation, market structure helps in analyzing the market current state , telling you the perfect time to buy or sell or even move out of the market.
BULLISH TREND
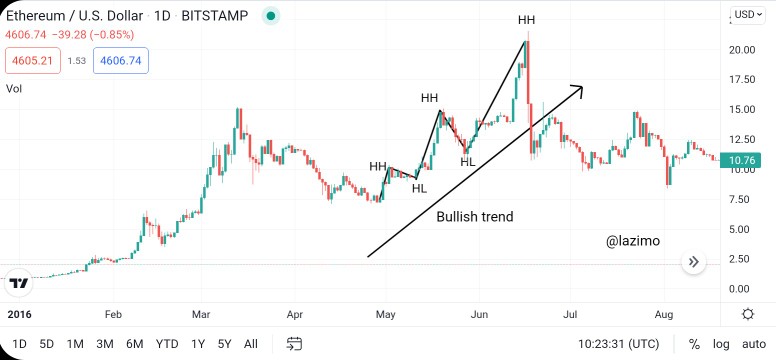
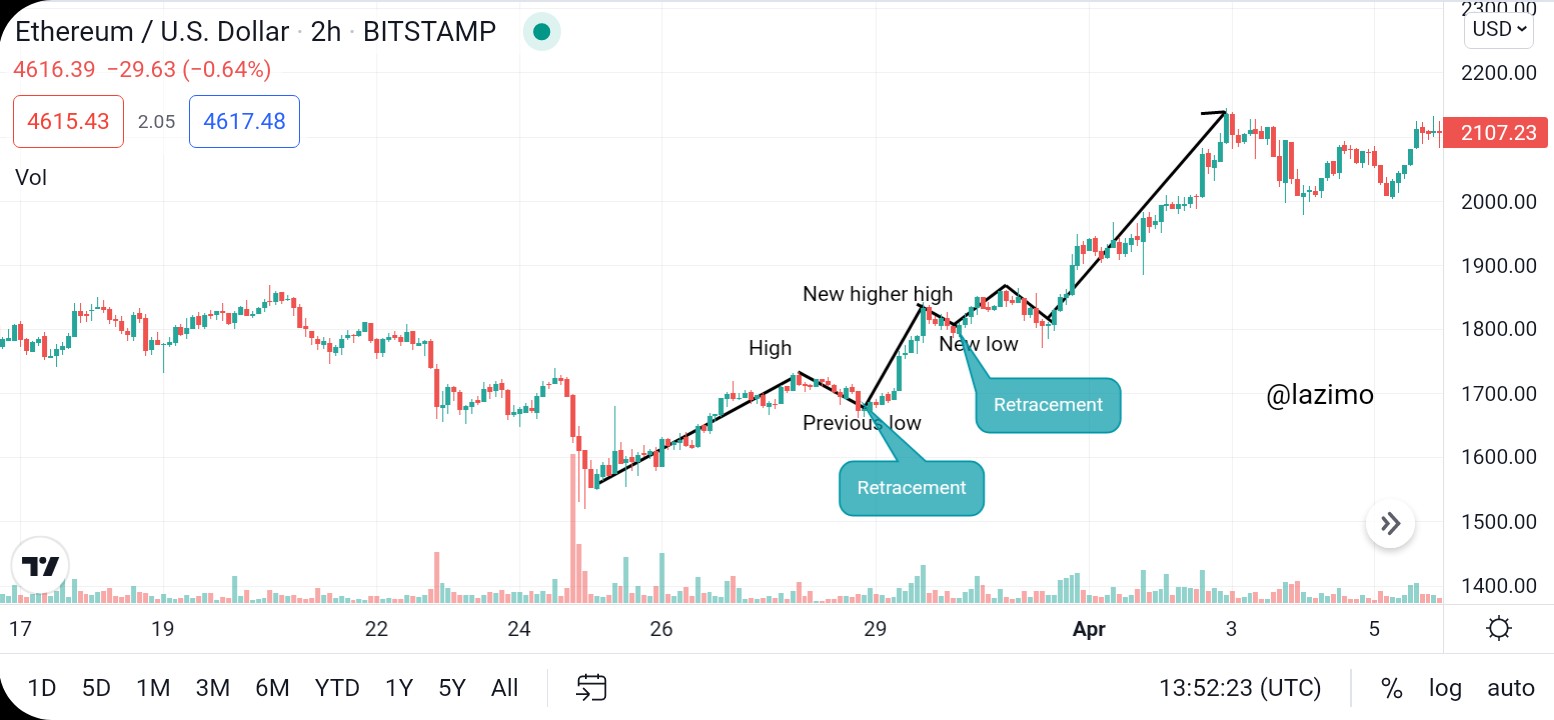
In bullish market structure, it forms a series of higher highs and higher lows. The market goes up, and come down to take a little breath and then bounce up again, once the pull back ends, it will continue going up breaking above the previous swing height and goes up again. It keeps doing that continuously. This is normally the opportunity to buy. see screenshot below
BEARISH TREND
The bearish market structure forms the series of lower high and lower low. The market hits down lower and bounce back, then goes lower again, breaking the previous low, it keep doing like that, continuously. This is normally the opportunity to sell. see screenshot below.
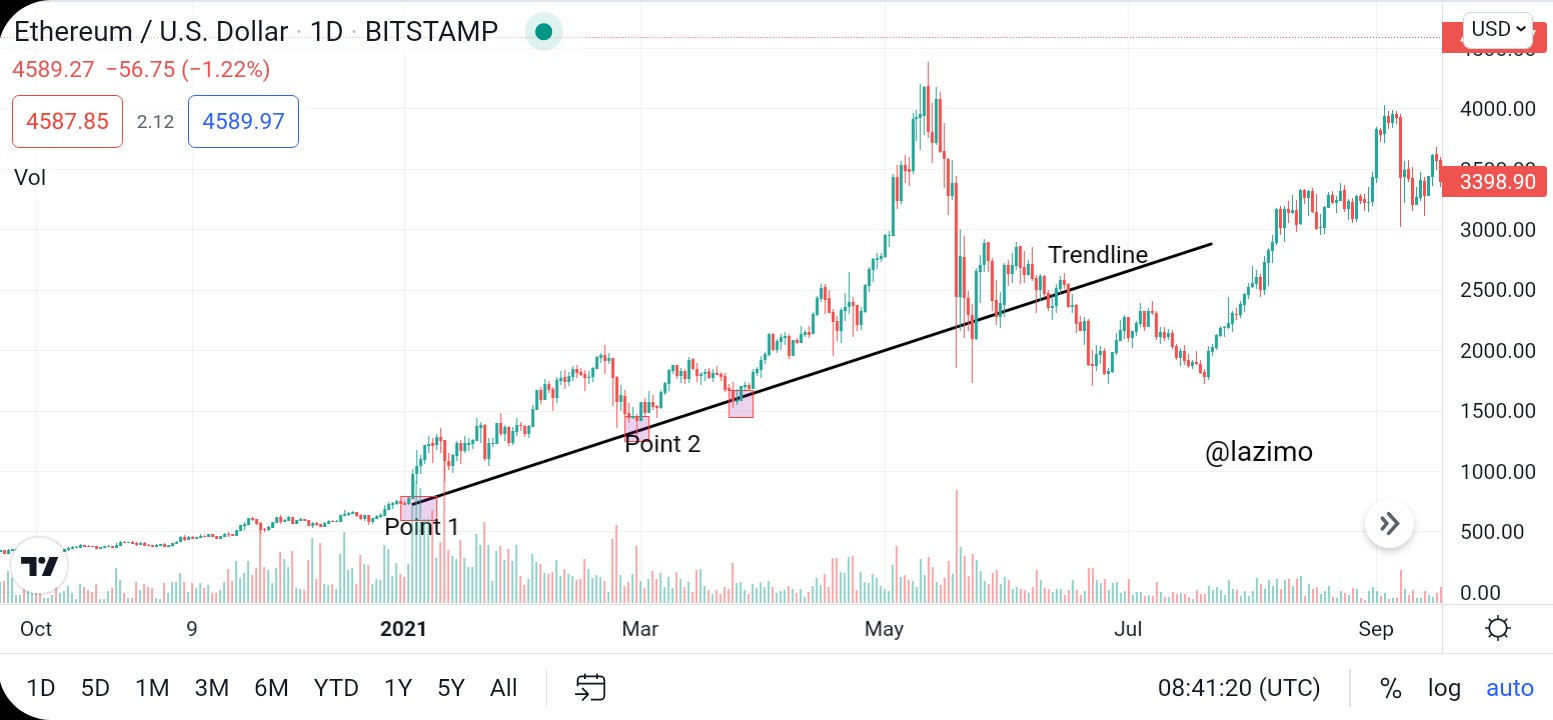
Trendlines is a technical tool that traders use for analyzing market movement. A trendline can be drawn on any two pivot point, pivot point simply means where the price goes from down to up, from up to down changing a direction and establishing a price pivot.
BULLISH TREND
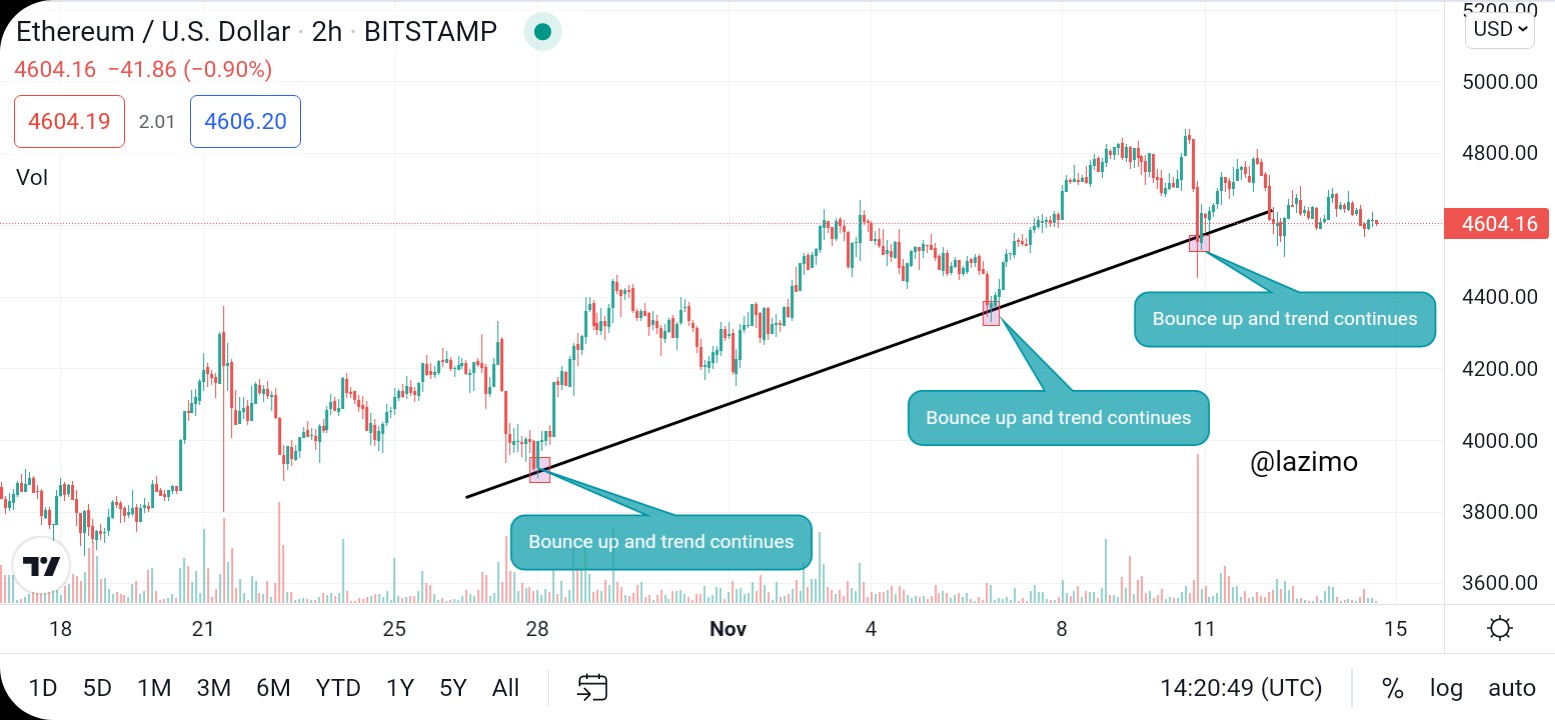
In bullish trendlines, you can see how the market price bounces back anytime it touches or reach the trendline. This is also the buying opportunity for traders. It also serve as support point to the market price. see screenshot below
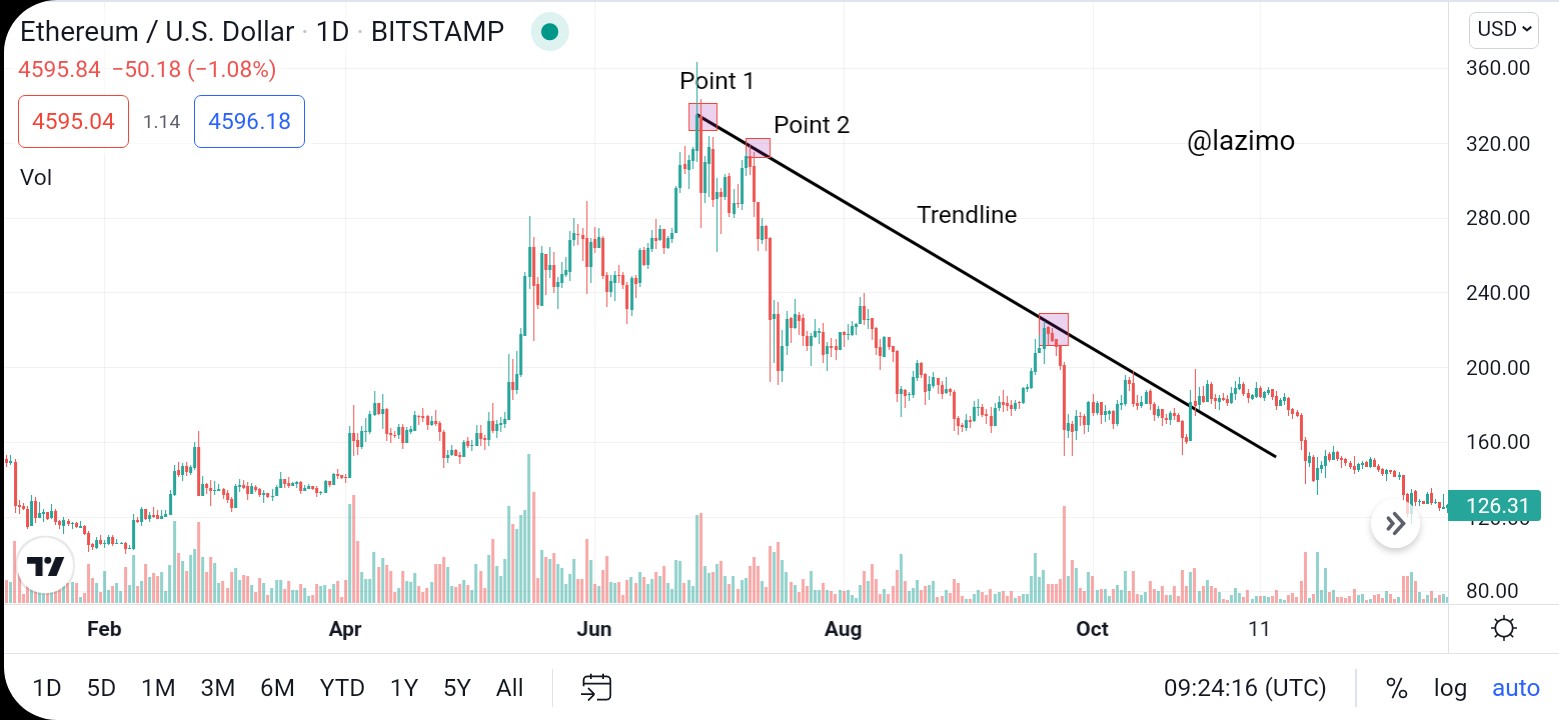
BEARSIH TREND
In bearish trendline, you can see how the market price goes down whenever it hits or touches the trendline. This is also the selling opportunity for traders. It serve as resistance point to the market price. see screenshot below
3) Explain trend continuation and how to spot them using market structure and trendlines. (Screenshot needed). Do this for both bullish and bearish trends.
Trend continuation indicates the repetition of the previous trend that was formed before as it continues to trend in the same way, this tell traders that the market price will or might continue trending as before. Although, it does not happnen in all continuation trend pattern, some might reverse.
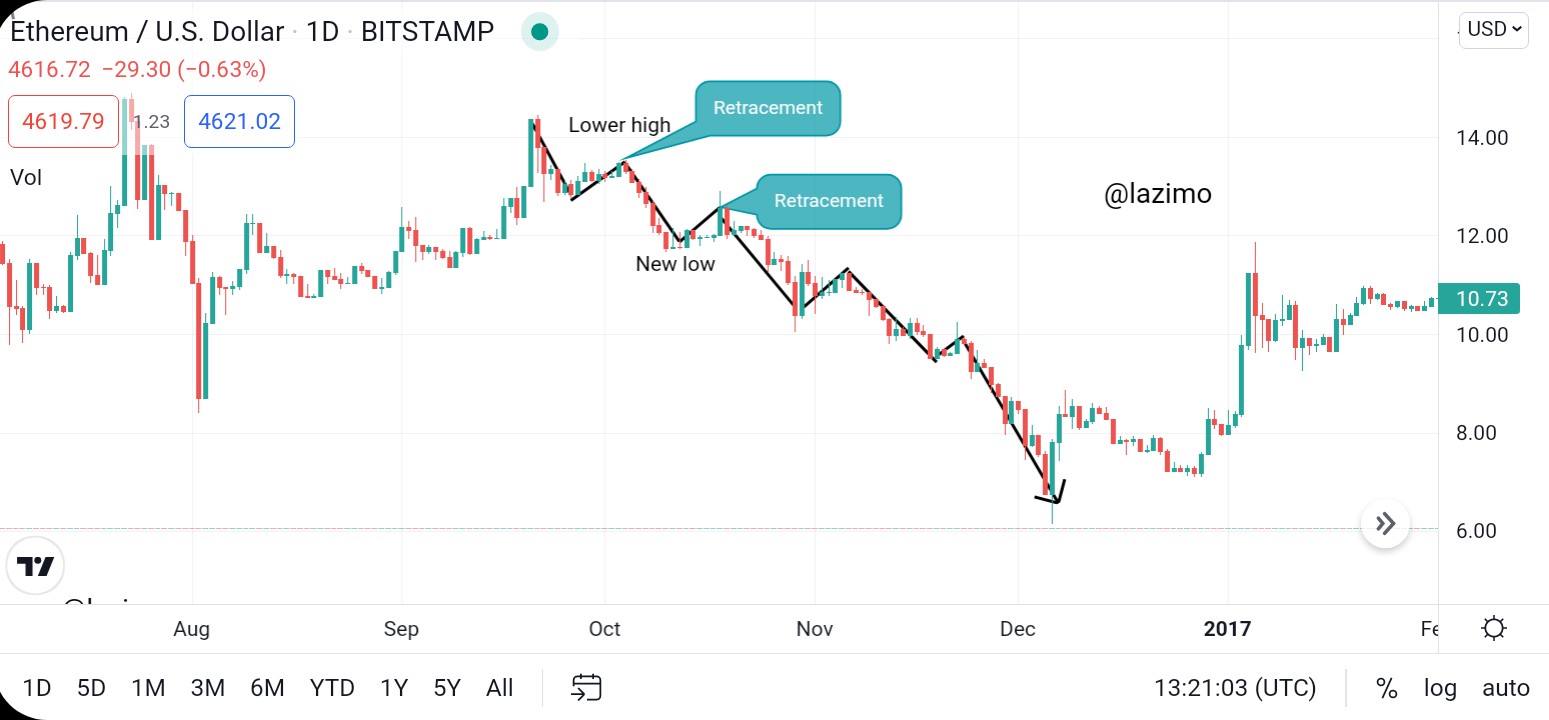
In bearish trend, as stated in the lecture, we normally consider two key element or important points during a trend continuation in bearish trend which are-
When the market is in it's retracement, the high level must reach to the former lower low level. Also, the new lower level that was formed must go more lower than the former lower point that was formed in the first place.
In this type of trend, it shows that sellers are in control of the market, so buyers are not capable of making the market price to go high. see screenshot below
During retracement using market structure in bullish trend, we also consider two key element or important points which are-
When the market is in its retracement, the new low point that was formed must not go lower than the former low and also the new high level created must always be higher or goes more higher than the former low.
This shows that buyers are in control of the market and sellers are finding it difficult to take over the market. see screenshot below
Like i stated earlier that a Trendline is a technical tool that traders use for analyzing market movement., which also perform the role of support and resistance level. Now at the chart below we will see how the market price bounces up anytime it hit on the trendline, it will continue to bullish. This serve as support level to the market price. see screenshot below
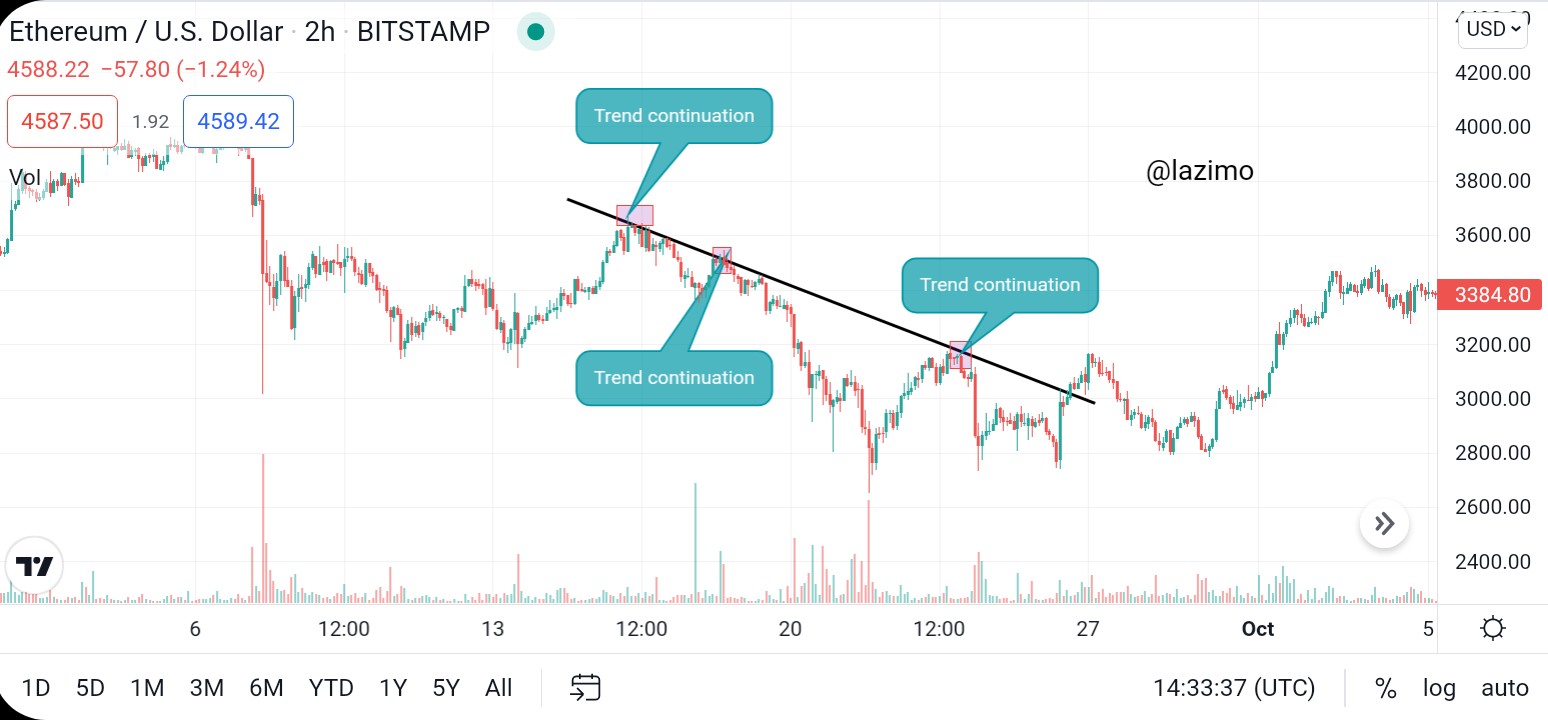
This is also similar when it comes to bearish trend, looking at the chart below you can see how the market price goes more lower anytime it hits the trend line, this makes it to go more bearish. It also serve as resistance level to the market price. see screenshot below
4) Pick up any crypto-asset chart and answer the following questions -
i) Is the market trending?
ii) What is the current market trend? (Use the chart to back up your answers)
ETHUSD chart
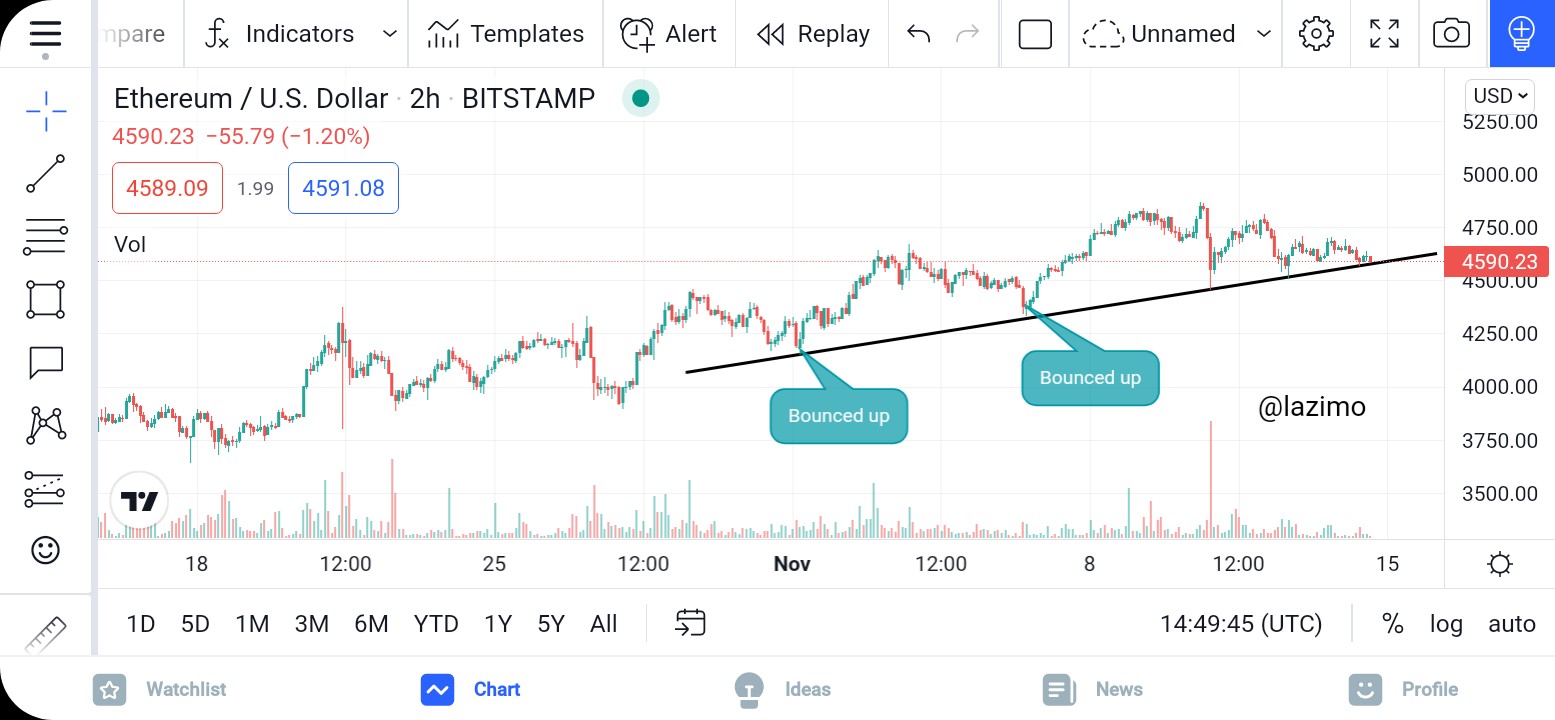
i) In this question, i will be using ETHUSD to do analysis 2h chart. Now looking at the chart below, we can see the movement of the market trending up, though zig zag. Buyer sand sellers are struggling who will take over the market price, but buyers are in control of the the market price currently. When the market hit the first point of the support level at 4100, but tends to go more higher than before, it keeps going zigzag till it hits the second support level, then it bounced back and went more higher, this shows that the bull are strongly controlling the market price. As a trader, i suggest to take my entry at the second point.
ii) The current trend of the market is bullish trend as we can see on the chart below. Where buyer and sellers are struggling on who to control the market as i stated earlier. At last point of the trendline if the trend will be able to pass or break the trendline, that will indicate that the bulls are loosing control of the market price and this can lead to a bearisg trend but is been expected to bounce up again. See screenshot below
CONCLUSION
As a trader, you need to have knowledge about trends, so that you can know the perfect time to buy or sell cryptos. Trends are very important when doing analysis on a particular asset. When the market is trending, it moves either upward or downward or even sideways this help us to know who is in control of the market. Also understanding trends can make one not to take the right decision when trading. On the other hand, market structure also help to decide when to enter th le market. All thanks to professor @reminiscence01 for a nice and well detailed lecture. I really appreciate your effort.
Cc-
Professor @reminiscence01