Algorithmic Trading with Moving Averages on Steem [EN/UA]

| EN translated by Deepl ~8% and AI Claude 3 Haiku ~ 92% |
|---|
Introduction.
Recalling the previous week of the W3 challenge at CryptoAcademy, I thought that it was too abrupt a transition from ordinary fractals to algorithmic trading, but after spending some time on the subject, I decided to look into it. It turned out to be quite easy if you find the right tools, at least for writing code and testing your strategy on historical data. The main reason for this is the development of AI, which quickly solves simple coding tasks that would have required a lot of time to understand before, and now it is accessible to many. The main thing is to ask the right questions and requests.
Main material.
Introduction to algorithmic trading
Trading using algorithms implies the use of computer technology and predefined instructions. That is, without human involvement in the decision-making process and execution of commands. This is an advantage because there is no emotional factor and there is speed and accuracy. Especially when such a strategy is placed on the servers closest to the exchange, i.e. with minimal network delay for the transmission of commands. The disadvantages include technical features that do not always allow for the correct processing of incoming information in case of sudden changes in the market, which leads to various consequences. Cryptocurrencies are traded seven days a week, but long before that, there was a classic working week that includes five working days and two days off, and breaks occur during major holidays (New Year, Christmas, etc.) or unpredictable events. Then the statistics undergoes changes - the set of input information for the algorithm - and the commands for operating transactions may not be executed correctly.
The prescribed instructions or advisors or robots are a set of various parameters on the basis of which trading actions will be performed. Starting from simple ones with a few variables to complex ones. The latter include more conditions and process large amounts of input information, including AI and a combination of different approaches, depending on market conditions.
Example
MA are universal indicators and can be applied to any chart. Now let's consider an example with simple conditions for the intersection of moving averages. I'll explain it more simply - the orange line crosses the blue line in an upward direction, which will be considered a buy signal. When this event occurs, the algorithm should automatically open a trade and set take profit and stop loss levels.
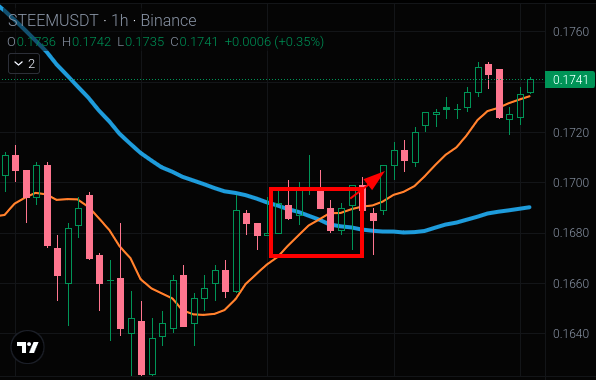
Example of MA crossing upwards
2. Moving Averages in Algorithmic Trading
To avoid getting too caught up in the numbers, let me try to explain it more simply. SMA, EMA, WMA are based on static data over a certain period, the basis of which is the asset's price. This can be the open, close, or average between them, and other variations. However, there is a difference in the calculation formulas:
- SMA - simply finds the average value over a certain period, if it's for 5 days, then the sum is divided by 5;
- WMA - in its calculations of the average value, it gives preference to newer data, and older data will have less influence. Each day is assigned a priority of importance, so if the latest price is significantly different from the previous periods, if it's 5 days, then the shift in the line will be more significant;
- EMA - instead of changing the priorities towards fresh data, it applies a smoothing coefficient, then there is a slightly better response to market events than in SMA.
Aside from the calculation formulas, which are not of much concern now, as all the calculations are embedded in the indicator code. In the image below, you can notice the difference between each of the mentioned moving averages, with the labels corresponding to the colors.
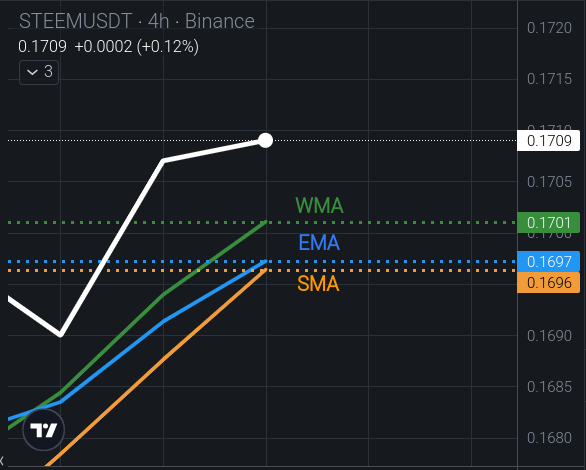
Difference between SMA, EMA, WMA with a period of 5, based on the opening price
In algorithmic trading, it's not necessary to plot them on the chart, as everything happens automatically and the visual component is not as important, as almost all conditions occur purely in numerical expressions and their other variations. But you need to understand and see that this can affect the result, as the difference can be significant.
| Strategy |
|---|
This is one of the simple options for crossing EMA, to have an understanding and test it on historical data, as the free subscription does not allow much. So this is more for learning.
Type: Mainly trending.
Trading Instrument: STEEM/USDT (STEEM/TetherUS)
Time Frame: H2
Indicators:
- Fast EMA 5 (period);
- Slow EMA 15;
Entry Conditions for buy when the fast EMA crosses the slow EMA upwards. In fact, on the spot, the assets will simply be bought for physical ownership).
Order Size 100 USDT. That is, a purchase of 100 USDT
Exit:
- Upon reaching the take profit of 250 points. That is, the actual change in the asset from the initial price. (Probably a sell order should be opened to exchange one asset for another, then USDT will be received for the STEEM coin, but the system (depending on the strategy parameters) in the test sees this as take profit)
- Upon stop loss of 30 points. At least this parameter is also specified in the variables, but it is not entirely clear how it is processed.
Probable Result. Every time the buy conditions are met, STEEM is obtained, and upon reaching the take profit level, STEEM is sold for USDT. That is, this is for small trends on H2.
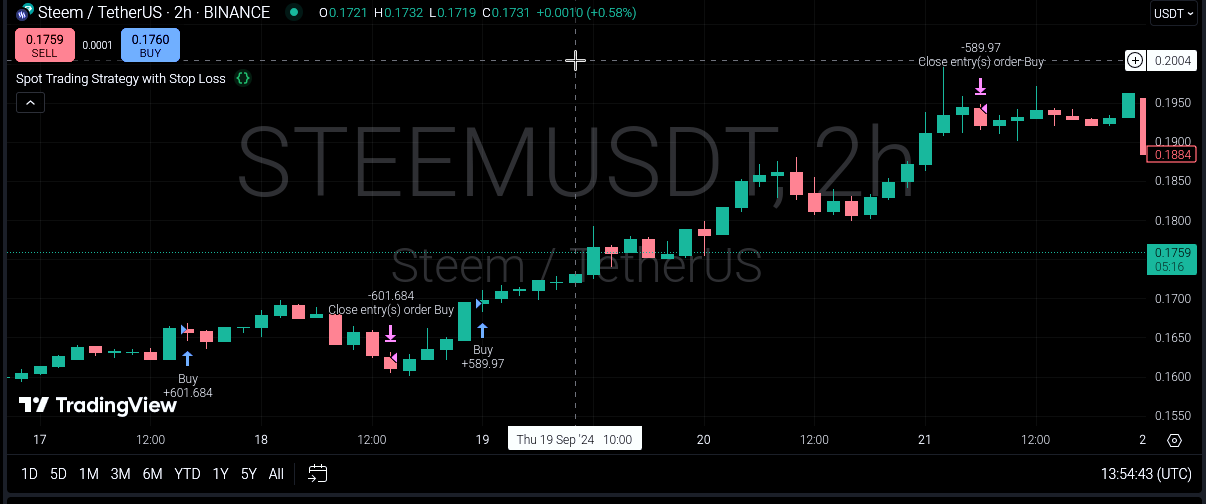
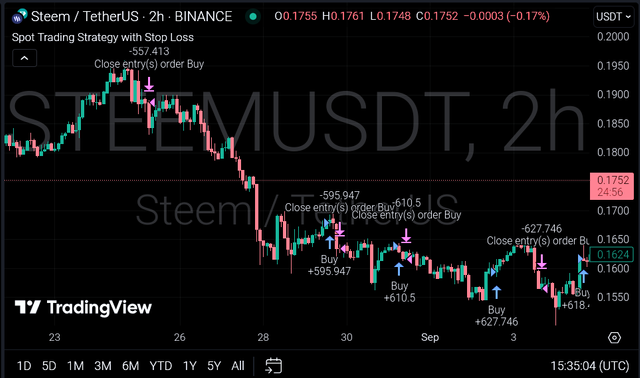
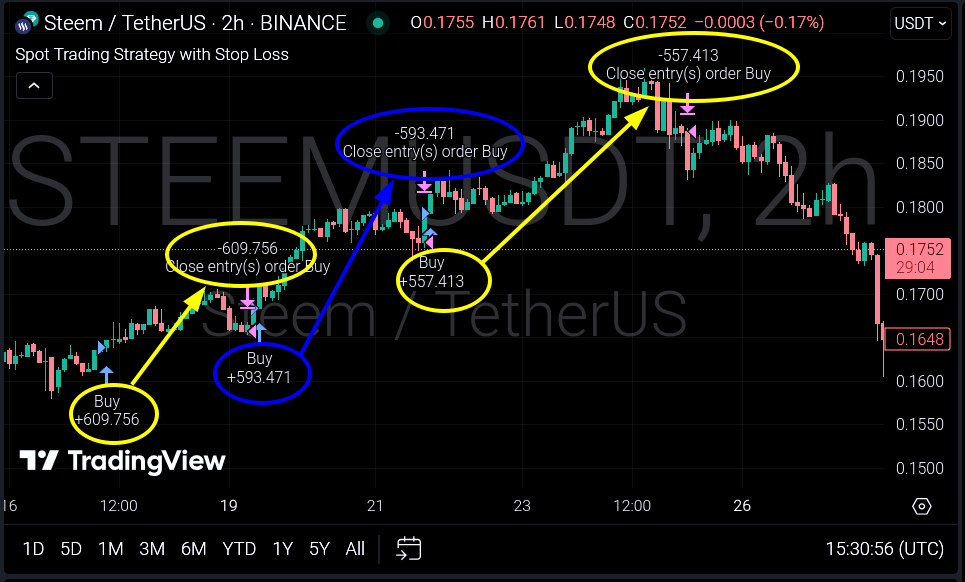
Example of a Successful Trade
An example of a successful trade is marked on the chart from the buy to the sell or fixation at the take profit.
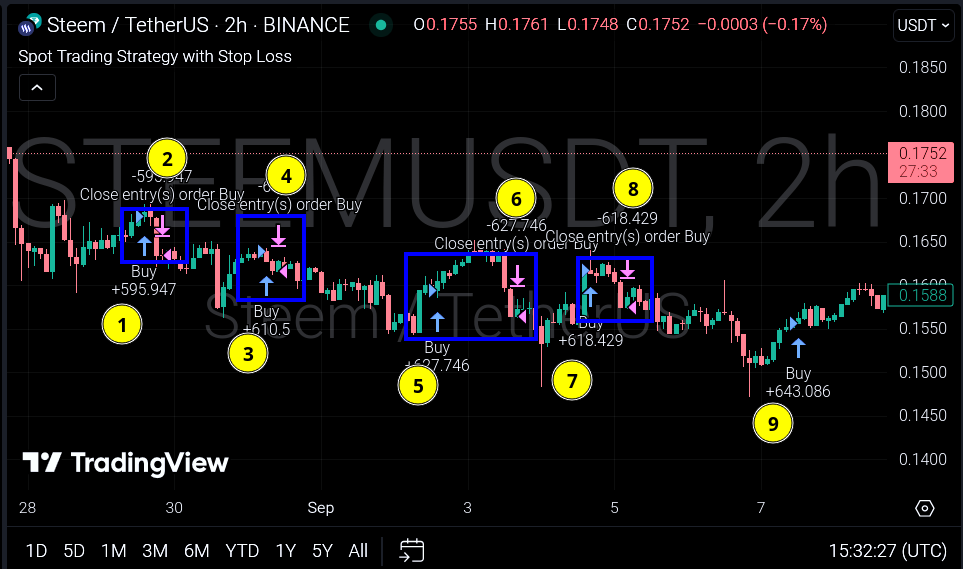
Algorithm behavior.
What happens on the chart, the example separately, because on the free license you can't add more than two indicators to the chart, including the automatic strategy.
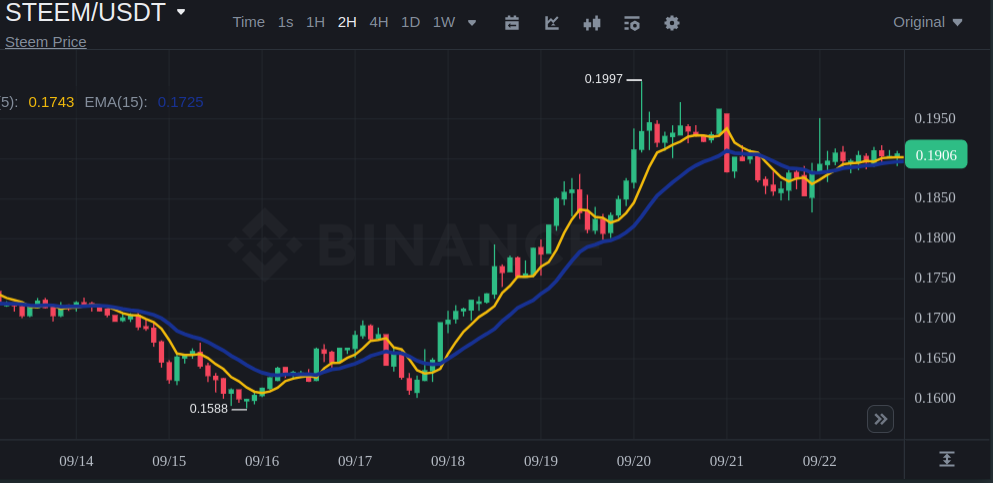
Behavior of EMA 5 and 15 indicators.
4. Implementing Algorithmic Trading
The choice of tools depends on the programming language, as in the search for solutions there were three options, and maybe more, but they are more likely to require a larger knowledge base and technical nuances of API connection and something else. After all, the main question is to test on STEEM/USDT data, so there are not many simple (easier) options. I came across one service where you can just set the parameters in the visual menu, not in code, and the strategy will work, even the test is conducted without registration, but there are no cryptocurrencies there, only ETFs on Bitcoin. So initially, there were attempts to get something from QuantConnect, but there the languages are more complex - C# and Python, and there are no historical data for STEEM (or you need more knowledge), so it's more for code experts, and at the beginning it's not so interesting and easy, but there is an opportunity to get paid computing power. Therefore, the task was completed with the help of TradingView, where everything can be done from the chart, and the programming language is Pine Script (which doesn't tell me anything), which allows you to easily test simple strategies and implement new ones, which the AI is happy to help create, at least for the beginning, to assess what's what. It's easy to change the code parameters and see the test results almost immediately.
Working code of the strategy for TradingView with Pine Script:
//@version=5
strategy("Spot Trading Strategy with Stop Loss", overlay=true)

// Define variables
fast_len = 5
slow_len = 15
take_profit_points = 250  // Number of points for take profit
stop_loss_points = 30    // Number of points for stop loss

// Calculate EMA on the current timeframe
fast_ema = ta.ema(close, fast_len)
slow_ema = ta.ema(close, slow_len)

// Determine signals
buy_signal = ta.crossover(fast_ema, slow_ema)
sell_signal = ta.crossunder(fast_ema, slow_ema)

// Variable to store the entry price
var float entry_price = na

// Buy the asset on buy_signal
if (buy_signal)
    entry_price := close  // Store the entry price
    strategy.order("Buy", strategy.long)  // Execute the buy order

// Sell the asset when the take profit is reached
if (not na(entry_price))  // Check if the entry price is available
    take_profit_price = entry_price + take_profit_points * syminfo.mintick  // Take profit price
    stop_loss_price = entry_price - stop_loss_points * syminfo.mintick  // Stop loss price

    // Close the position when the take profit is reached
    if (close >= take_profit_price)
        strategy.close("Buy")  // Sell the asset
        entry_price := na  // Reset the entry price

    // Close the position when the stop loss is reached
    if (close <= stop_loss_price)
        strategy.close("Buy")  // Sell the asset
        entry_price := na  // Reset the entry price

// Close the position on sell_signal
if (sell_signal)
    strategy.close("Buy")  // Sell the asset
    entry_price := na  // Reset the entry price
Has one condition for purchase, a fixed take profit and stop loss. In theory, it is for the spot, it should keep the price after the purchase and compare it after the changes, when the take profit is reached, that is, the purchase price + 250, then the coins are sold. And the stop loss should trigger when the price is 30 points below the purchase, to avoid a large depreciation of the coin.
5. Efficiency review - historical data test
Testing on the TradingView platform. Step by step the path is shown.
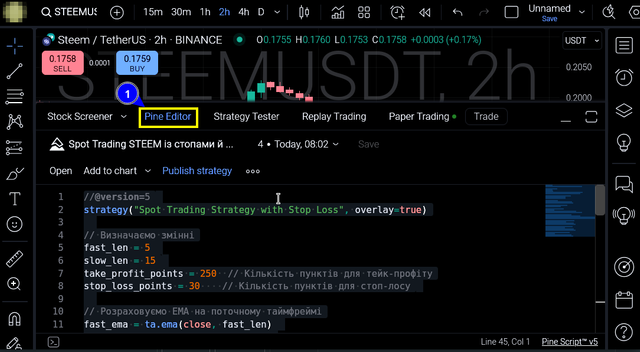
Insert the code into the editor window and save.
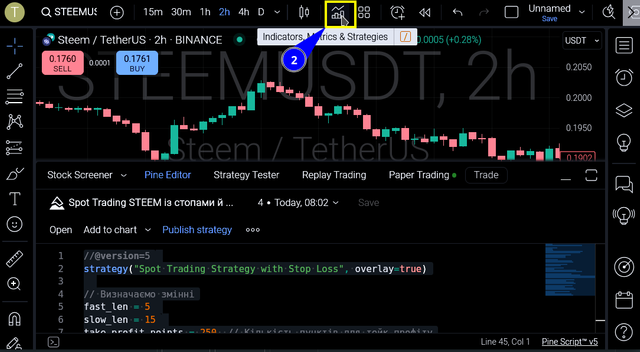
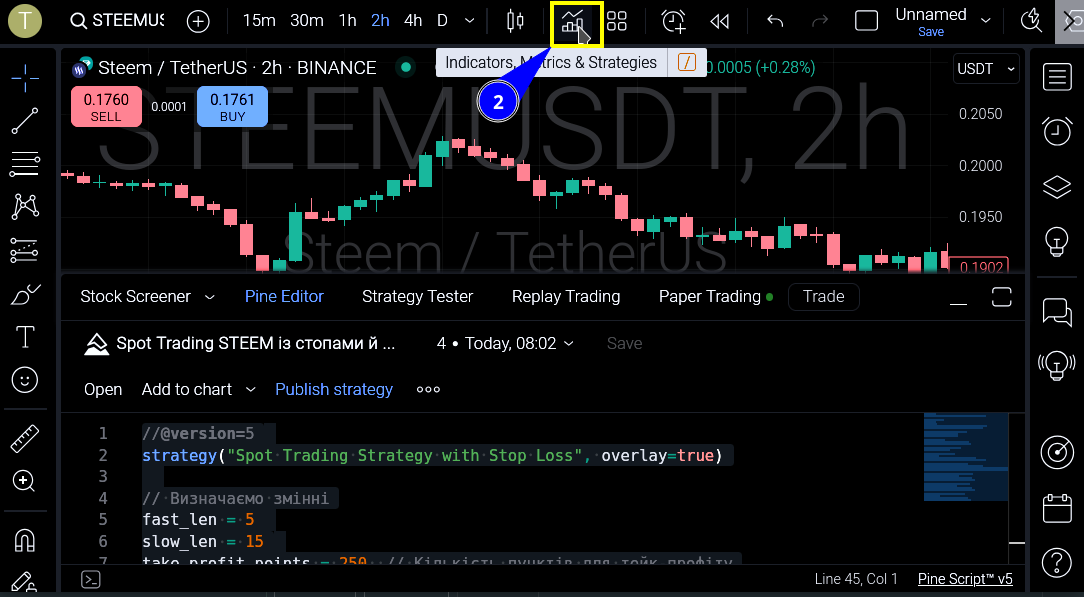
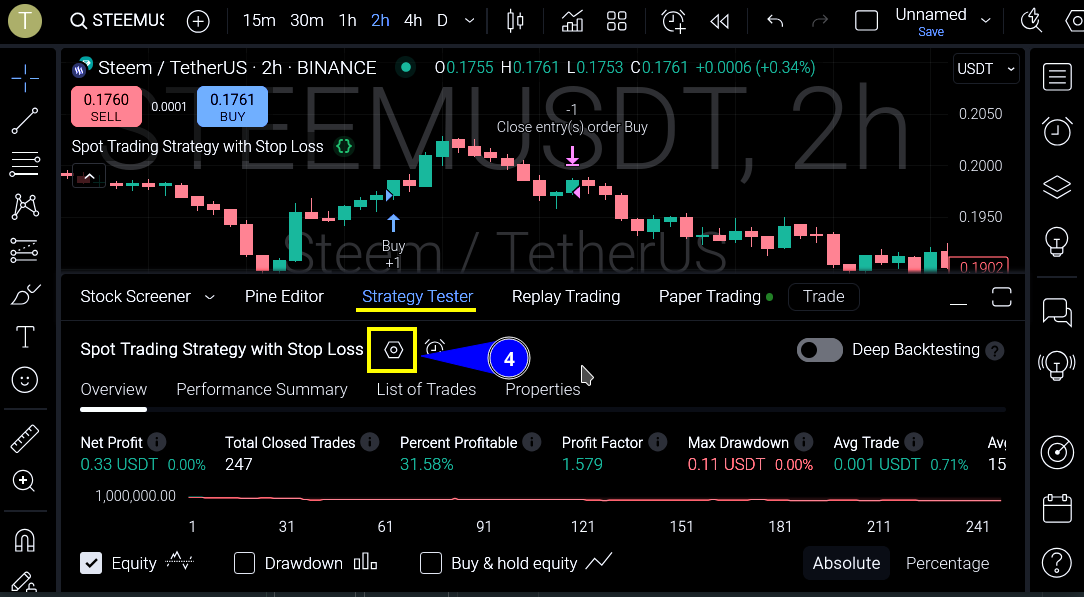
Click on the indicators and strategies icon.
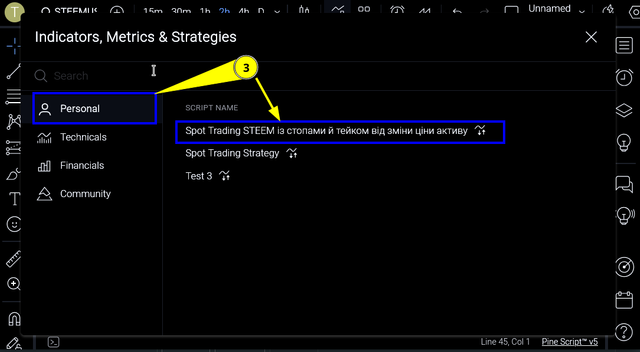
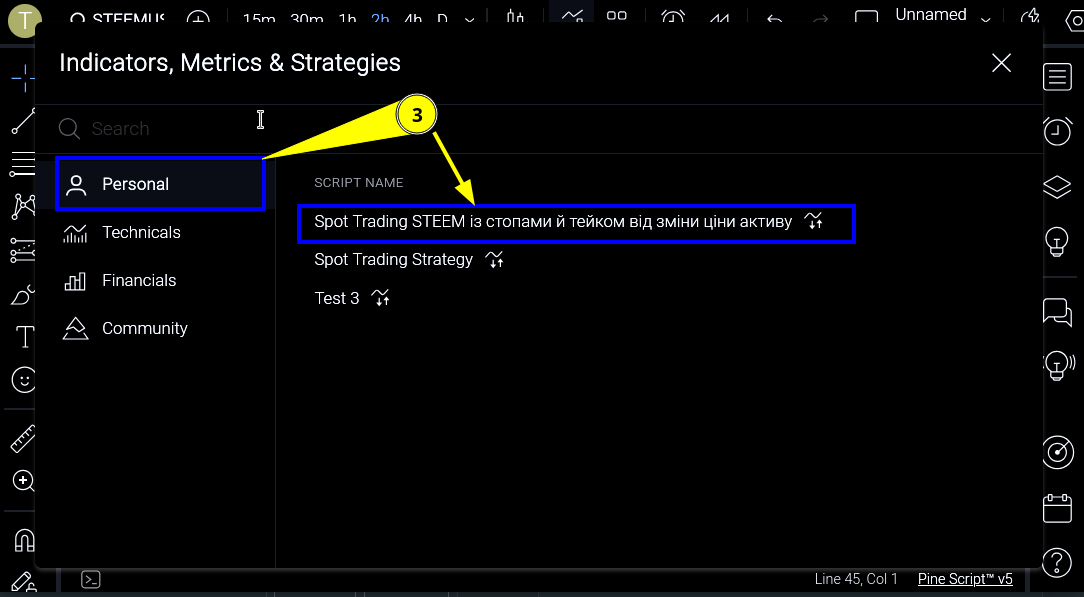
Select the necessary (the one that was saved for testing). You can see the marks on the chart.
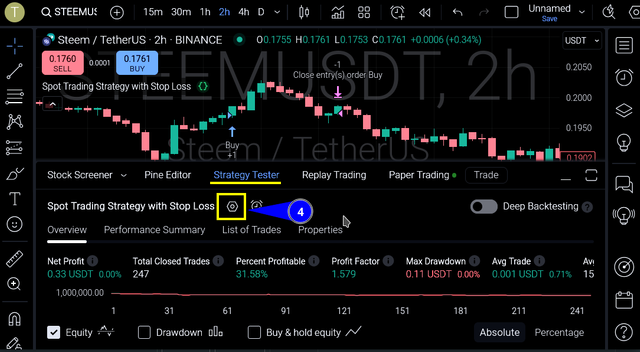
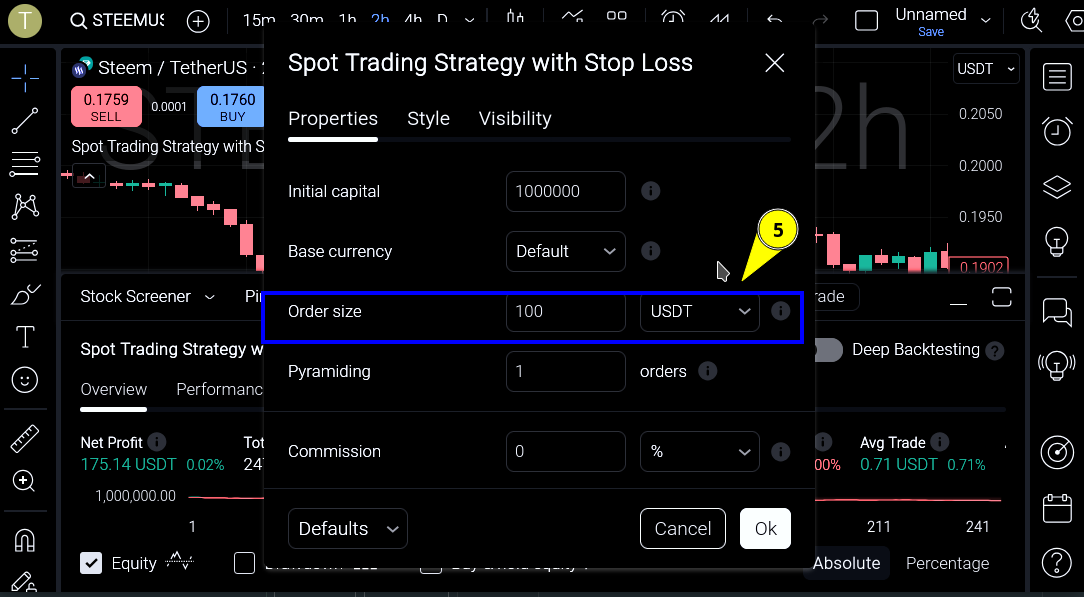
Select the settings.
Select the order size, in our case it will be 100 USDT per trade and a deposit of 1000 USDT.

Overall result without taking into account the transaction fee. (can be changed in the settings)
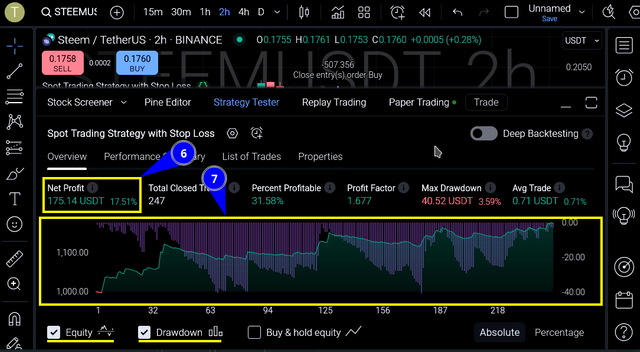
The equity and drawdown levels show that there were uncontrolled declines below the initial deposit. Significantly higher than what is specified in the strategy.
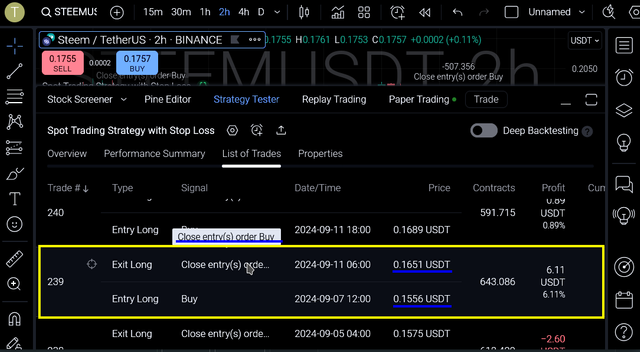
The list of test trades shows that they are not closed under the desired conditions, but as it was in the first version of the code when the Buy event occurs or on the stop loss or something else, sometimes the SL triggers approximately within the 30 point limit, and the TP with an excess of the target 250 points, or not reaching them.

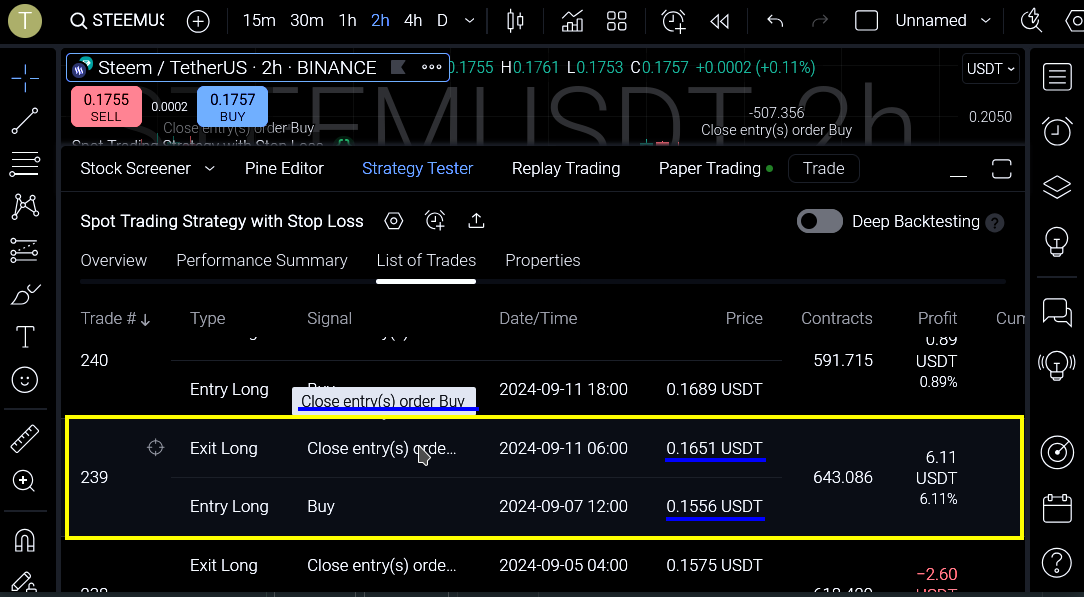
So, the strategy does not work as originally intended. It only opens one trade at a time, that is, it makes a purchase and a new one will only be after the previous sale of the purchased assets. The test result is positive, as 17% (excluding commission) per year is a good result.
Behavior in different markets:

- In a bullish market - good for a trend when the price is rising, but there will be no new trades, except occasionally on corrective sections;

In a sideways market - depending on the size of the channel, but still gives a lot of false entries, without reaching the target and closing the trade (selling the coins) with a small plus, if the commission does not eat it up, but this is how the strategy works, but under the conditions that were supposed to be in it, these would be stop losses;
Bearish - an open trade is fixed (exchange STEEM for USDT), this would rather be a stop loss, and new ones are not opened, because this is a spot, so you have to wait for the trend to change.

The effectiveness of such a strategy will be in a certain range, but not a narrow one, but a wider one, when small trends will reach the target and return in a short time, to support, to perform the crossing conditions again.
Improvements
First of all, correctly set the desired conditions so that the take profit and stop loss work, according to the specified parameters, but then the result may be different, but the risk management should be more effective.
Add variable conditions, as was the case in one of the code versions, to close the trade in positive territory without 100% reaching the target, but, for example, after a reversal from 70% of the path to the take profit and a subsequent decline to 20% of the target value, but there is much more trouble to figure it out.
For a narrow channel, add settings to close the purchase after a certain time without a significant change in the asset price, so that the result is positive.
An interesting point. The time period is not set in the strategy code, and this depends on its manual selection, but if you set the parameter in the code to take into account the H2 TF, then the manual selection on the H4 chart shows much higher indicators than the H2 test without such a parameter in the code and H4, which in the usual version is weak. So there are many different options that need to be taken into account for effective optimization.
Regarding real trading, there are no guarantees that it will correctly buy and sell coins, this needs to be checked, because this is just educational material. Also, moving averages are not always reliable (like everything in the market), because the test can show a good picture, even be with a positive result in real time, but when switching to a real account with live money, the result will be different. Therefore, the setting and testing of an algorithmic strategy should be carried out gradually with an understanding of how it works and why certain events occur.
The main image of the post was made using SDXL 1.0 and Inkscape. Screenshots on the Binance and TradingView platforms (used the Dark Reader browser extension to have a dark background, because I didn't have the brains to turn on the corresponding night theme in the site settings), this information is present there.
Sources used:
Picking the Right Algorithmic Trading Software
Algorithmic Trading
Basics of Algorithmic Trading: Concepts and Examples
Consultations, tips, and coding with the help of AI
| UA original |
|---|
Вступ
Згадуючи попередній тиждень челенжу W3 у КриптоАкадемії, подумалось що це аж занадто різкий перехід від звичайних фракталів до алгоритмічної торгівлі, але приділивши трохи часу питанням. Виявилось, що це доволі просто, якщо підібрати потрібні інструменти, принаймні для написання коду й тестування стратегії на історичних даних. Основною причиною полегшення є розвиток ШІ, котрий швидко вирішує прості завдання із написання коду, бо раніше це б вимагало багато часу на розуміння, а зараз це доступно багатьом. Головне ставити правильні питання й запити.
Основний матеріал
1. Вступ до алгоритмічної торгівлі
Торгівля із використання алгоритмів має на увазі використання комп'ютерних технологій та заздалегідь прописаних інструкцій. Тобто без участі людини в процесі прийняття рішень та виконання команд. В цьому є перевага, бо відсутній емоційний фактор та присутня швидкість і точність. Особливо при розміщенні такої стратегії на серверах, найближчих до біржі, тобто з мінімальною затримкою мережі на передачу команд. До недоліків відносяться технічні особливості, які не завжди дають змогу правильно обробляти вхідну інформацію при раптових змінах на ринку, що призводить до різних наслідків. Криптовалюти торгуються без вихідних, але задовго до них і зараз є класичний робочий тиждень, котрий включає п'ять робочих днів та два вихідних, також перерви виникаю під час великих свят (новий рік, Різдво і т.п.) чи непередбачуваних подій. Тоді статистика зазнає змін - набір вхідної інформації для алгоритму - і можуть бути не правильно виконані команди оперування угодами.
Прописані інструкції або радники чи роботи - це набір різних параметрів, на основі яких будуть виконуватись торгові дії. Починаючи від простих, із декількома змінними, до складних. Останні включають більше умов й обробляють великі масиви вхідної інформації, в тому числі може бути залучений ШІ й комбінування різних підходів, залежно від ринкових умов.
Приклад
MA універсальні індикатори і їх можна застосувати до будь-якого графіка. А зараз розглянемо приклад із простими умовами перетину середніх. Поясню простіше, помаранчева лінія перетинає блакитну, в напрямку висхідного руху, що буде розцінюватись сигналом на покупку. При настанні цієї події, алгоритм має автоматично відкрити угоду й встановити рівні тейк профіту та стоп лосу.
Приклад перетину MA знизу вверх
2. Рухомі середні в алгоритмічній торгівлі
Щоб менше плутатись в цифрах, спробую простіше. SMA, EMA, WMA базуються на статичних даних за певний період, в основі яких лежить ціна активу. Це може бути відкриття, закриття середнє значення між ними та інші варіанти. Проте є різниця у формулах розрахунку:
- SMA - просто знаходить середнє значення за певний період, якщо за 5 днів, то сума ділить на 5;
- WMA - у своїх підрахунках середнього значення надає перевагу новішим даним, а застарілі будуть мати менший вплив. Кожному дню присвоюється пріоритет важливості, тобто якщо остання ціна буде значно відрізнятись від попередніх періодів, якщо це 5 днів, тоді зміщення лінії буде суттєвіше;
- EMA - замість змінення пріоритетів в бік свіжих даних, застосовує коефіцієнт згладжування, тоді відбувається трохи краще реагування на події на рику, ніж у SMA.
Окрім формул розрахунку, якими зараз не дуже переймаються, тобто всі підрахунки закладено в код індикатора. На зображені нижче, можна помітити різницю кожної із зазначених рухомих середніх, підписи відповідають кольорам.
Різниця SMA, EMA, WMA із періодом 5, за ціною відкриття
В алгоритмічній торгівлі їх не обов'язково наносити на графік, бо все відбувається автоматично й візуальна складова не така важлива, бо майже всі умови настають чисто у цифрових вираз та інших їх варіантах. Але треба розуміти й бачити, що це може впливати на результат, бо різниця може бути суттєва.
3. Розробка алгоритмічної торгової стратегії
Згадуючи попередній тиждень КриптоАкадемії W3, виникає ще одне питання, бо тоді розрахунок був на звичайні умови, як на ф'ючерсі, коли є еквіті, тобто при покупці відкривається угода і закривається лише при досягненні цільової позначки TP або SL, чи вручну. Але це ніби одна угода. На спот ринку продаж чи покупка це фактичний обмін одного товару на інший, в нашому випадку криптовалюти. Тоді TP не буде, тобто його можна забезпечити розміщення лімітного ордера, а гри на зниження не буде. Реалізувати таку стратегію для алгоритму не просто, без знань та певного часу на розбирання нюансів. Бо демоторгівля (паперова), показує що воно це не бере до уваги й за звичайними правилами встановлює TP чи ніби бере його до уваги в звичайному режимі. Але точно не скажу, що буде якщо такий алгоритм чи робота поставити на спотову торгівлю, тож це аспект не зовсім досліджений і вимагає ретельного вивчення. Тому стратегія представлена тут лише для ознайомлення із принципами дії й може не дати бажаного результату, в питанні фіксації прибутку, з боку вдалого відкриття прибуткових угод теж.
| Стратегія |
|---|
Це один із простих варіантів перетину EMA, щоб було розуміння та провести тест на історичних даних, бо безоплатна підписка багато не дозволяє. Тож це більше для навчання.
Вид: переважно трендова.
Торговий інструмент: STEEM/USDT (STEEM/TeherUS)
Часовий період: H2
Індикатори:
- EMA швидка 5 (період);
- EMA повільна 15;
Умови входу на покупку коли швидка перетинає повільну знизу вгору. По факту на споті будуть просто куплені активи для фізичного володіння).
Розмір ордера 100 USDT. Тобто покупка на 100 USDT
Вихід:
- по досягненню тейк профіту 250 пунктів. Тобто фактична зміна активі від початкової ціни. (Ймовірно має бути відкрита угода продажу, щоб обміняти одні активи на інші, тоді за монету STEEM буде отримано USDT, але система (залежно від параметрів стратегії) на тесті помічає це як тейк профіт)
- по стоп лосу 30 пунктів. Принаймні цей параметр теж прописується в змінних, але не зовсім зрозуміло як він обробляється.
Ймовірний результат. Кожного разу коли настають умови на покупку, отримується STEEM, а по досягненню рівня тейк профіту STEEM продається за USDT. Тобто це для невеликих трендів на H2.
Приклад вдалої угоди
Приклад вдалої угоди помічено на графіку від покупки до продажу чи фіксації по тейк профіту.
Поведінка алгоритму.
Що відбувається на графіку, приклад окремо, бо на безоплатній ліцензії не можна додати більше двох індикаторів на графік, включаючи автоматичну стратегію.
Поведінка індикаторів EMA 5 та 15.
4. Впровадження алгоритмічної торгівлі
Від інструментів залежить використання мови програмування, бо в пошуках рішень було три варіанти, а може й більше, але вони скоріше за все потребують більшої бази знань та технічних нюансів підключення API й ще чогось. Адже основне питання полягає в тому, щоб протестувати на даних STEE/USDT, тому не так багато простих (легших) можливостей. Траплявся мені один сервіс, де можна просто встановити параметри у візуальному меню, а не кодом і стратегія буде працювати, навіть тест проводить без реєстрації, але там немає криптовалют, хіба ETF на біткоїн. Тому спочатку були спроби щось отримати від QuantConnect, але там складніші мови C# та Python і немає історичних даних для STEEM (або треба більше знань), тож це більше для знавців коду, а на початку там не так цікаво й легко, але є можливість отримати платні потужності. Тому завдання виконати допоміг TradingView, де все можна робити із графіка, а мова програмування Pine Script (що нічого мені не каже), яка дає змогу легко тестувати прості стратегії й впроваджувати нові, які радо допомагає створити ШІ, як мінімум для початку, щоб оцінити що до чого. Легко змінювати параметри коду й майже відразу бачити результат тесту.
Основний робочий код стратегії:
//@version=5
strategy("Spot Trading Strategy with Stop Loss", overlay=true)

// Визначаємо змінні
fast_len = 5
slow_len = 15
take_profit_points = 250  // Кількість пунктів для тейк-профіту
stop_loss_points = 30    // Кількість пунктів для стоп-лосу

// Розраховуємо EMA на поточному таймфреймі
fast_ema = ta.ema(close, fast_len)
slow_ema = ta.ema(close, slow_len)

// Визначаємо сигнали
buy_signal = ta.crossover(fast_ema, slow_ema)
sell_signal = ta.crossunder(fast_ema, slow_ema)

// Змінна для зберігання ціни покупки
var float entry_price = na

// Купуємо актив при buy_signal
if (buy_signal)
    entry_price := close  // Зберігаємо ціну покупки
    strategy.order("Buy", strategy.long)  // Виконуємо покупку

// Продаж активу при досягненні тейк-профіту
if (not na(entry_price))  // Перевіряємо, чи є ціна покупки
    take_profit_price = entry_price + take_profit_points * syminfo.mintick  // Ціна для тейк-профіту
    stop_loss_price = entry_price - stop_loss_points * syminfo.mintick  // Ціна для стоп-лосу

    // Закриття угоди при досягненні тейк-профіту
    if (close >= take_profit_price)
        strategy.close("Buy")  // Продаємо актив
        entry_price := na  // Скидаємо ціну покупки

    // Закриття угоди при досягненні стоп-лосу
    if (close <= stop_loss_price)
        strategy.close("Buy")  // Продаємо актив
        entry_price := na  // Скидаємо ціну покупки

// Закриваємо позицію при sell_signal
if (sell_signal)
    strategy.close("Buy")  // Продаємо актив
    entry_price := na  // Скидаємо ціну покупки
Має одну умову на покупку, фіксований тейк профіт та стоп лос. По ідеї, саме для споту, має після покупки зберігати ціну й порівнювати її після змін, коли настає досягнення тейк профіту тобто ціна покупки+250, тоді монети продаються. А стоп лос має спрацьовувати коли ціна буде нижче покупки на 30 пунктів, щоб уникнути великого здешевіння монети.
5. Огляд ефективності - тест на історичних даних
Тестування на платформі TradingView. Покроково показано шлях.
- Вставити код у віконце редактора та зберегти.
- Натиснути на піктограму індикаторів та стратегій.
- Обрати потрібну (яку було збережено для тесту). Можна побачити що на графіку з'являться помітки.
- Обрати налаштування.
- Обрати розмір ордера, в нашому випадку це буде 100 USDT на одну угоду та депозит 1000 USDT.
- Загальний результат без врахування комісії за угоди. (можна змінити в налаштуваннях)
- Рівень еквіті та посадки, показує що були неконтрольовані зниження нижче початкового депозиту. Значно вищі ніж це прописано у стратегії.
- Список тестових угод показує, що вони закриваються не по бажаних умовах, а як то було в першому варіанті коду при настанні події Buy або по стопу чи ще якось, подекуди SL спрацьовую приблизно в межах 30 пунктів обмеження, а TP із перевищенням цільових 250 пунктів, або не досягненні їх.

Отже, працює стратегія не як задумувалось на початку. Відкриває лише одну угоду за раз, тобто виконує покупку й нова лише буде лише після попереднього продажу придбаних активів. Результат есту позитивний, адже 17% (без врахування комісії) за рік, це хороший результат.
Поведінка на різних ринках:
- бичачому - добре для тренду, коли ціна зростає, але нових угод не буде, хіба подекуди на корекційних ділянках;
- боковий - залежно від розміру каналу, але все одно дає багато хибних входів, без досягнення цілі й закриттям угоди (продажем монет) з маленьким плюсом, якщо його не з'їдає комісія, але це так працює стратегія, але за умовами які в ній мали бути, то це були б стоп лоси;

- ведмежий - фіксується відкрита угода (обмін STEEM на USDT), це був би скоріше стоп лос, а нові не відкриваються, бо це спот, тож доводиться чекати зміни тренду.
Ефективнісь такої стратегії буде в певному діапазоні, але не вузькому, а ширшому, коли невеликі тренди будуть досягати цілі й повертатимуться за невеликий проміжок часу, до підтримки, щоб знову виконати умови перетину.
Покращення
В першу чергу правильно налаштувати бажані умови, щоб спрацьовували тейк профіт і стоп лосс, по зазначеним параметрам, але тоді може бути інший результат, проте має бути ефективніше управління ризиками.
Додати змінні умови, як було в одному із варіантів коду, щоб закривати угоду в позитивному значенні без 100% досягнення цілі, а, наприклад після розвороту від 70% пройденого шляху до тейк профіту й зниження після цього до 20% від цільового значення, але там значно більше клопоту, щоб розібратись.
Для вузького каналу додати налаштування, щоб закривати покупку, після певного часу без значно зміни ціни активу, щоб був позитивний результат.
Цікавий момент. Часовий період не встановлено в коді стратегії, а це залежить від його вибору вручну, але якщо задати параметр в коді, щоб враховувався саме ТФ H2, тоді ручний вибір на панелі графіка H4, показує значно вищі показники ніж на тестування H2 без такого параметра у коді та H4, що у звичайному варіанті слабенький. Тож багато різних варіантів, які треба враховувати для ефективної оптимізації.
Щодо реальної торгівлі, то ніяких гарантій, що воно буде правильно купляти й продавати монети, це потрібно перевіряти, бо це лише навчальний матеріал. Також рухомі середні не завжди надійні (як і все на ринку), бо тест може показувати хорошу картинку, навіть якийсь час бути із позитивним результатом в дійсному часі, але при переході на реальний рахунок із живими грошима буде інший результат. Тому налаштування й тестування алгоритмічної стратегії має проходити поступово із розуміння як це працює й чому відбуваються ті чи інші події.
Головне зображення допису згенеровано SDXL 1.0 та відредаговано. Знімки екранів на платформі Binance та TradingView (використано розширення для браузера Dark Reader, щоб був темний фон, бо відповідну не вистачило розуму увімкнути відповідну нічну тему в налаштуваннях сайту), там присутня ця інформація.
Використані джерела:
Picking the Right Algorithmic Trading Software
Algorithmic Trading
Basics of Algorithmic Trading: Concepts and Examples
Консультації, підказки та кодування за допомогою ШІ
#ukraine #cryptoacademy-s20w4 #s20w4 #steemexclusive #club5050 #steem #crypto #tradingview
i do not understand the language but you wrote your post very well. i am so impressed from the screenshot you added with too many details and also i see you added the code its amazing
Дякую за добрі слова. Хай щастить )) ☀️☀️☀️
I don't know how to create Algorithmic Trading Strategy with Python or code but surely I can if I try it Thank you very much you created Statsity with codes and share with us Best of luck for you.
ШІ добре допомагає з кодом. Хай щастить))) ☀️☀️☀️