Trading Steem with Harmonic Patterns [EN/UA]

| EN translated by AI Claude 3 Haiku |
|---|
1. Explain the key harmonic patterns
Harmonic patterns are one of the types of technical analysis figures that have proportional sizes and have been relying on Fibonacci numbers for some time, as they are believed to reflect the Harmony of the Universe, i.e. the Golden Ratio.
One can conclude that they are similar, for example, to Elliot waves. The difference lies in the principle of visual identification and marking. That is, waves take into account the continuation after the initial impulse and based on it build the development of the trend movement. And the key harmonic patterns are focused on the reversal of the price, when the market is most inclined to it, so they are considered more effective.
Looking at a schematic example, on the left are waves, on the right (something similar to Gartley), it has the following areas at its core:
XA - active market movement in one direction;
AB=CD - accumulation of positions.

Together they form the XABCD structure, which takes into account the initial price movement and correction, which, combined with the Fibonacci levels, should provide better signals. In simpler terms, these are M and W-shaped figures.
At first they are more difficult to understand, because there is a lot of information and numbers, but the result should be better. It is described in detail and in depth in the book "The Harmonic Trader" (and others), because there are really a lot of details.
A bit about Fibonacci numbers
Here they are, a simple sequence: 0, 1, 1, 2, 3, 5, 8, 13, 21, 34, 55, 89, 144, 233, 377 and to infinity. It has the principle of adding the previous one to the next, i.e. 1+1=2, 2+1=3 and so on. Starting from double-digit numbers, when dividing the smaller neighboring one by the larger one (in ascending order), we get the magical 0.618, and the larger one by the smaller one (in descending order) - 1.618. Based on this, the main, i.e. basic extensions, are 0.618, 0.786, 1.27, 1.618. Additional: 0.382, 0.50, 1.00, 2.0, 2.24, 2.618, 3.14.
Key Points
The basis of harmonic patterns is the distance between the points, which is measured by the numbers 0.618, 0.786, 1.27, 1.618 (in the classic version) and others.

Example of the distance between points A and C, within the ABC pattern
The distance must be harmoniously coordinated with the other points, then the best result will be achieved. Each of the proportional agreements has its own figure. Therefore, the graphic examples of the figures and the probable distances between the main points that are allowed (sometimes there are several options) are given below.
Gartley
The model has the classic distances between the key points described in the book, but there are also other options from the Investopedia resource.
XD = 0.786
XB = 0.681
BD = 1.618 (classic), 1.13
AC = 0.618 (classic), 0.382, 0.886

D is usually considered as a reversal point, and a safer place for a stop loss, a little below it for bulls, and above it for bears.
Butterfly

Bullish Butterfly
XD = 1.27
XB = 0.786
BD =1.618, 2.24
AC = 0.382, 0.886

Bearish Butterfly
Bat

XD = 0.886
XB = 0.382, 0.5
BD = 1.618, 2.618
AC = 0.382, 0.886
Crab
It looks like a crab, because it's something small, reaches out with its claw and raises or lowers it. Considered one of the most accurate.

2. Defining Harmonic Models on the Steem Graph
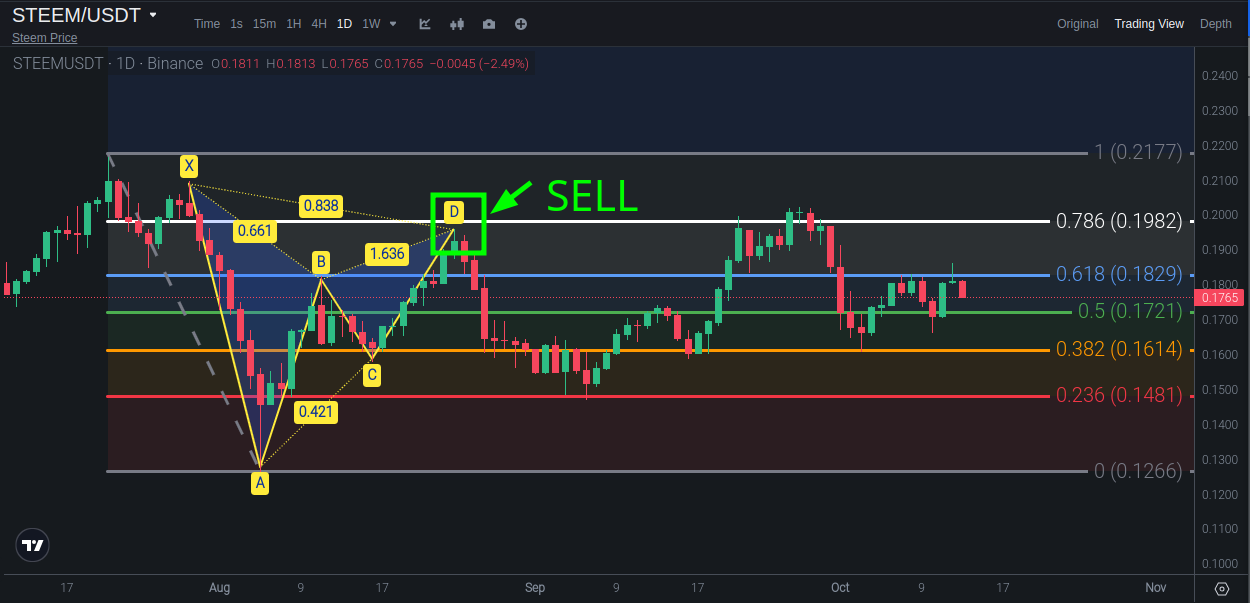
Something similar to the Hartley bear construction has been found. The ratio is not entirely harmonic, so it is an example, because it takes a lot of numbers to search and match to be exact and beautiful.

So even an approximate model shows that the pattern works and at least 80% of its size has passed.
3. Applying Fibonacci to Harmonic Models
In combination with Fibonacci levels, harmonic patterns have a better alignment effect, i.e., even a non-100% Hartley bear figure has a resistance level at 0.78, which adds confidence for the decline.

4. Trading Strategies Using Harmonic Models
| Strategy |
|---|
Time frames can be any, but on smaller ones, the power of the patterns will be weaker, and their search will take much more time than other types of analysis. So older TFs are much better, they occur less often, but will be stronger. And the main rule is that the occurrence of the strategy conditions does not guarantee profit.
Trading Instrument: STEEM/USDT
Time Frame: All.
Indicators:
- Fibonacci Levels;
- Harmonic Patterns: Gartley, Bat, Butterfly, Crab;
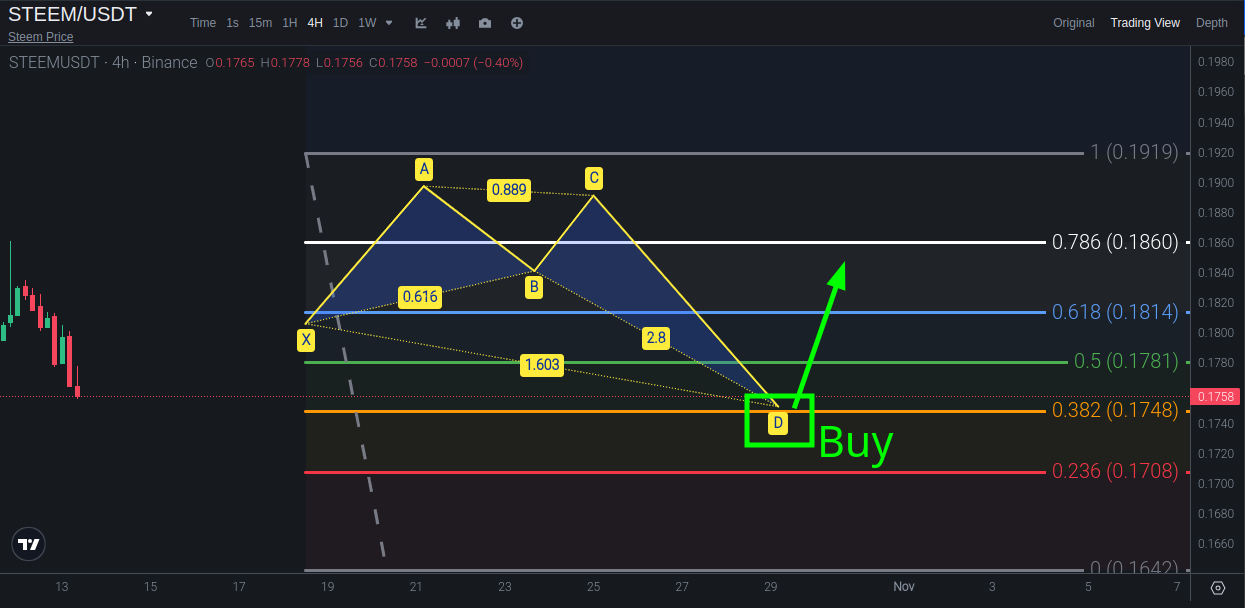
Entry Conditions - Buy: The buy condition occurs when one of the four bullish harmonic patterns is formed and at the point D, it is supported by the Fibonacci level. In fact, STEEM coins will simply be bought on the spot to hold them in the hope of increasing their value.
Order Size The calculation depends on the deposit
Exit - Sell: This can be the exit from the deal through a limit sell order or manually. Reaching 70%-80% of the figure height, but it can be earlier, depending on the market situation. Exchange STEEM for USDT when the price rises to make a profit on the difference.
Risk Management: While the purchased coins are in the wallet, two aspects need to be considered in order for them to grow in price and exit the risk area. The first is realized through timely sale of coins in accordance with the conditions or changes in the market situation. The second is the approximate stop loss under point D. It can be realized by placing limit orders. Take profit to fix the target, and stop loss to minimize losses in case of a sharp drop in the asset price.
5. Analysis of the Current Market Using Harmonic Patterns
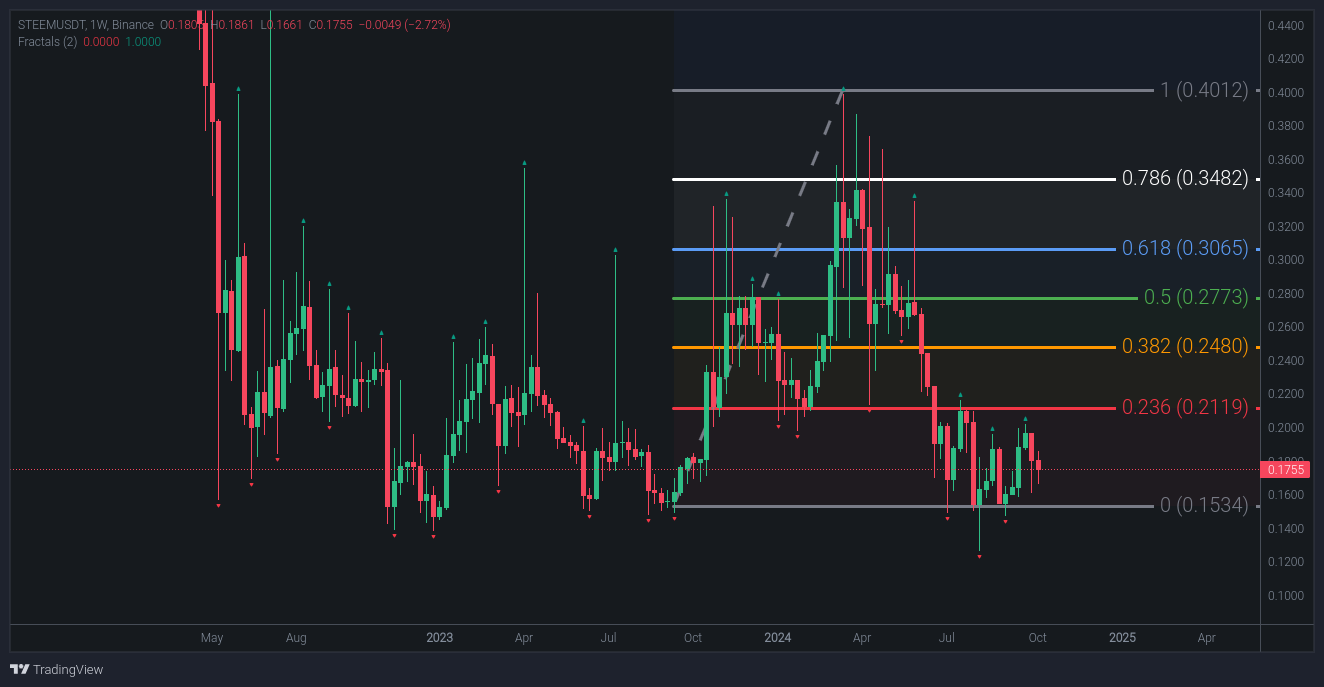
But what to analyze here, harmonic patterns are not fractals to constantly appear, and the market is currently in a sideways position, if you look at the older TFs. And as it sometimes happens that there are a little similar, small and weak ones, they are mostly bearish, like the one that was above in one of the questions. There is also the factor of inattention. So what kind of forecasts can be made based on what is not there, or I do not recognize what is hidden on the chart.
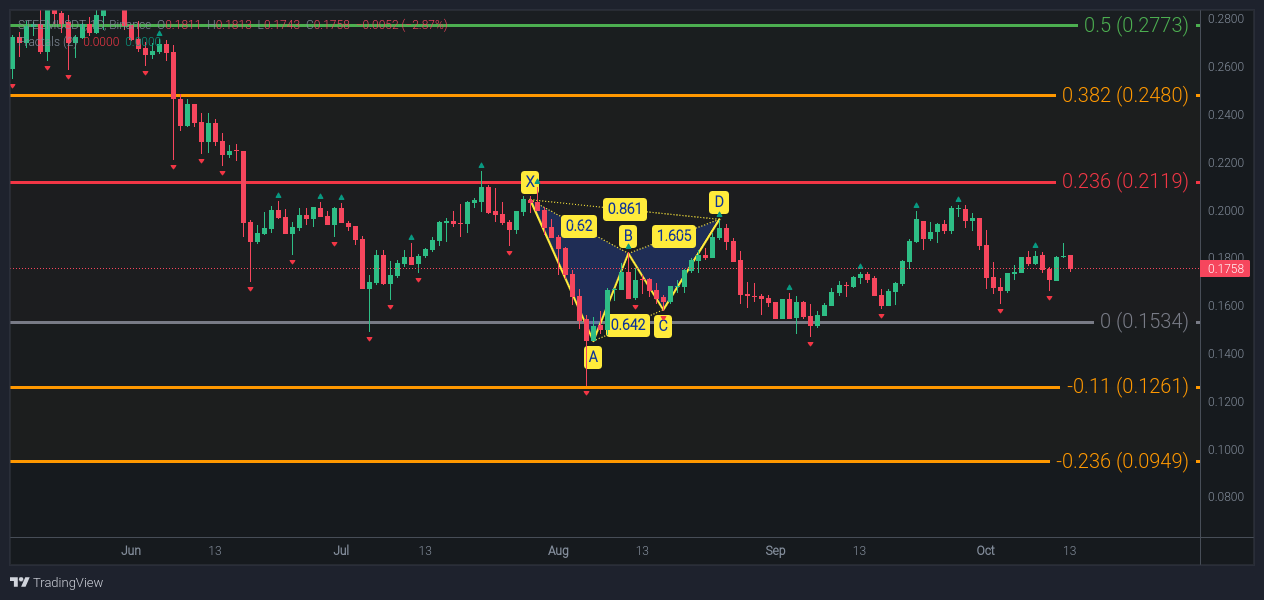
On a younger TF, you can only see a figure that has already done its job, this is the most interesting thing that has happened. So to make some forecasts, you need to wait for a good pattern, because they are rare.
All screenshots were taken on the Binance platform, including examples of harmonic patterns.
Sources:
- The book "The Harmonic Trader";
- Investopedia;
- Consultation and assistance from the AI.
| UA original |
|---|
Торгівля монетою STEEM з гармонійними патернами
1. Поясніть ключові гармонійні патерни
Гармонійні патерни це один із видів фігур технічного аналізу, котрі мають пропорційні розміри та з якогось часу почали опираються на числа Фібоначчі, адже вони за деякою думкою відображають Гармонію Всесвіту, тобто Золотий перетин.
Можна прийти до висновку, що вони схожі, наприклад, із хвилями Еліота. Відмінність полягає в принципі візуально виявлення та розмітки. Тобто хвилі беруть до уваги продовження після початкового імпульсу і на його основі будують розвиток трендового руху. А ключові гармонійні патерни орієнтовані на розворот ціни, коли ринок найбільше до того схильний, тому їх і вважають більше ефективними.
Поглянувши на схематичний приклад, зліва хвилі, праворуч (щось схоже на Гартлі), має в основі ділянки:
XA - активний рух ринку в одному напрямку;
AB=CD - акумуляція позицій.
Разом вони формують структуру XABCD, яка враховує початковий рух ціни та корекцію, які поєднуючись із рівнями Фібоначчі мають дати кращі сигнали. Якщо простіше, то це фігури типу M та W.
На початку є складнішими для розуміння, бо там багато інформаціїомрації, проте має бути кращий результат. Детально й поглиблено розповідається у книзі "The Harmonic Trader" (та інших), бо насправді там багато деталей.
Трохи про числа Фібоначчі
Оце вони, простий ряд: 0, 1, 1, 2, 3, 5, 8, 13, 21, 34, 55, 89,144, 233, 377 і нескінченно. Має принцип додавання попереднього до наступного, тобто 1+1=2, 2+1=3 і так далі. Починаючи із двозначних чисел, при діленні меншого сусіднього на більше (в порядку зростання), отримуємо чарівні 0.618, а більшого на менше (в порядку спадання) - 1.618. Виходячи із цього, основними, тобто базовими розширеннями, є 0.618, 0.786, 1.27, 1.618. Додаткові: 0.382, 0.50, 1.00, 2.0, 2.24, 2.618, 3.14.
Головне
В основі гармонічних патернів лежить відстань між токами, котра саме вимірюється цими числами 0.618, 0.786, 1.27, 1.618 (в класичному варіанті) та іншими.
Приклад відстані між точками A та C, в складі ABC
Відстань має гармонічно узгоджуватись з іншими точками, тоді буде найкращий результат. Кожне із пропорційних узгоджень має свою фігуру. Тому нижче наведені графічні приклади фігур та ймовірні відстані між основними точками, котрі допускаються (бува, декілька варіантів).
Гартлі
Модель має класичні відстані між ключовими точками, котрі описані в книзі, але є й інші варіанти з ресурсу Investopedia.
XD = 0.786
XB = 0.681
BD = 1.618 (класичний), 1.13
AC = 0.618 (класичний), 0.382, 0.886
D зазвичай розглядається як точка розвороту, а безпечніше місце для стоп лосу, трохи нижче під нею для биків, а вище для ведмедів.
Метелик
Бичачий Метелик
XD = 1.27
XB = 0.786
BD =1.618, 2.24
AC = 0.382, 0.886
Ведмежий Метелик
Кажан
XD = 0.886
XB = 0.382, 0.5
BD = 1.618, 2.618
AC = 0.382, 0.886
Краб
На краба схоже, бо ніби щось невеличке, дотягується клешнею та підіймає її чи опускає. Вважають одним із найточніших.
XD = 1.618
XB = 0.618, 0.382
BD = 2.618, 3.618
AC = 0.382, 0.886
2. Визначення гармонійних моделей на графіку Steem
Знайдено, щось схоже на ведмежу конструкцію Гартлі. Співвідношення не зовсім гармонійне, тож як приклад, бо це шукати і зіставити купу цифр, щоб точно було й гарно.

Тож навіть приблизна модель, показує, що паттерн працює й принаймні 80% від свого розміру пройшло.
3. Застосування Фібоначчі до гармонійних моделей
У поєднанні із рівнями Фібоначчі, гармонічні патерни мають кращий ефект узгодження, тобто навіть не стовідсоткова фігура ведмежий Гартлі, має рівень опору на 0.78, що додає впевненості для зниження.

4. Торгові стратегії з використанням гармонійних моделей
| Стратегія |
|---|
Часові періоди можуть бути будь-які, але на менших сила патернів буде слабшою, а їх пошуки будуть займати значно більше часу ніж інші види аналізу. Тож старші ТФ значно кращі, трапляються рідше, але будуть сильніше. І головне правило, що настання умов стратегії не гарантує прибуток.
Торговий інструмент: STEEM/USDT
Часовий період: всі.
Індикатори:
- Рівні Фібоначчі;
- Гармонічні патерни: Гартлі, Кажан, Метелик, Краб;
Умови входу - покупка: умова покупки настає, коли сформується один із чотирьох бичих гармонійних патерни і в точці D, буде підкріплено підтримкою рівня Фібоначчі. По факту на споті будуть просто куплені STEEM монети для володіння ними в надії на зростання їх вартості.
Розмір ордера Розрахунок залежно від депозиту
Вихід - продаж: Власне це може бути й вихід з угоди шляхом лімітного ордера на продаж або в ручному режимі. Досягнення 70%-80% від висоти фігури, але можна й раніше, залежно від ситуації на ринку. Обмін STEEM на USDT, коли ціна виросте, щоб заробити на різниці.
Управління ризиками: Доки куплені монети лежать у гаманці, потрібно брати до уваги два аспекти, щоб вони росли в ціні та вихід в область ризику. Переш реалізується шляхом вчасного продажу монет відповідно до умов або зміни ситуації на ринку. Друга, це орієнтовний стоп лос, під точкою D. Реалізувати можна шляхом виставлення лімітних ордерів. Тейк профіт для фіксації цілі, а стоп лос, щоб при різкому падінні ціни активу, мінімізувати втрати.
5. Аналіз поточного ринку з використанням гармонійних патернів

А що тут аналізувати, гармонійні патерни не фрактали, щоб постійно з'являтись, а ринок зараз перебуває в боковому положенні, якщо дивитись на старші ТФ. А як бува, трапляються трохи схожі, маленькі та кволенькі, то переважно ведмежі, як той, щоб був вище в одному із питань. Ще є фактор неуважності. Тож які можуть бути прогнози на основі того, чого немає, або не впізнаю того, що заховано на графіку.

На молодшому ТФ можна хіба побачити фігуру, котра вже відпрацювала своє, це найцікавіше, що трапилось. Тож щоб зробити якісь прогнози, потрібно чекати хороший патерн, бо вони рідкісні.
Всі знімки екрана (починаючи із третього зображення) зроблені на платформі Binance, в тому числі приклади гармонічних патернів.
Джерела:
- Книга "The Harmonic Trader";
- Investopedia;
- Консультація та допомога ШІ.
Congratulations on bringing a quality content. You have earned a positive vote from team 2, and it is delivered by @starrchris.
Many Blessings...🙏🏻
Дякую ☀️ 💜☀️💚☀️💜☀️💚☀️💜☀️💚☀️