Trading Steem with Harmonic Patterns
Hello everyone! I hope you will be good. Today I am here to participate in the contest of Steemit Crypto Academy about the Trading Steem with Harmonic Patterns. It is really an interesting and knowledgeable contest. There is a lot to explore. If you want to join then:
.png)
Question 1: Explain the Key Harmonic Patterns
Describe the four major harmonic patterns: Gartley, Bat, Crab, and Butterfly. Discuss their specific Fibonacci levels and how each pattern can be used to identify potential reversal zones in the Steem/USDT pair.
Harmonic patterns are used by the traders to predict the reversal of the market. They help to analyze the price movements. They use specific Fibonacci retracement as well as extension level. These patterns help in the identification of the turning points in the market. We can predict the turning points of STEEM/USDT pair by analyzing these patterns. We can identify market reversals.
There are different harmonic patterns such as Gartley pattern, Bat Pattern, Crab pattern and Butterfly pattern.
Gartley Pattern
The Gartley pattern is one of the most common harmonic patterns. It provides information about the potential reversals in trends. It is typically useful to examine the market trend and pattern during a retracement of an ongoing trend. We use it before the price resumes its original direction.
Fibonacci Levels:
- XA: Initial leg.
- AB: Retraces 61.8% of the XA leg.
- BC: Retraces 38.2% to 88.6% of AB.
- CD: Extends to 78.6% retracement of XA.
Use in Steem/USDT:
When the price of Steem forms a Gartley pattern then a potential reversal zone can be identified near the 78.6% retracement of the XA leg. Traders can place the buy orders near this level. Because it signals a bullish reversal. Moreover we should also place sell orders near this zone to protect the funds when the pattern suggests a bearish reversal.
Bat Pattern
The Bat pattern is another retracement pattern. But the Bat pattern is considered to be more accurate and constructive. Because it uses specifically the Fibonacci ratios.
Fibonacci Levels:
- XA: Initial leg.
- AB: Retraces 38.2% to 50% of XA.
- BC: Retraces 38.2% to 88.6% of AB.
- CD: Extends to 88.6% of XA.
Use in Steem/USDT:
In the Bat pattern the potential reversals zone is near the 88.6% retracement of the XA leg. This is a deep retracement. If this pattern forms then the traders look for a reversal at this zone. If Steem/USDT prices approach this level then the traders may expect a significant price bounce or a trend reversal.
Crab Pattern
The Crab pattern is an extension pattern. This pattern offers one of the most extreme Fibonacci ratios. And it becomes a more volatile pattern than other patterns.
Fibonacci Levels:
- XA: Initial leg.
- AB: Retraces 38.2% to 61.8% of XA.
- BC: Retraces 38.2% to 88.6% of AB.
- CD: Extends to 161.8% of XA.
Use in Steem/USDT:
For the Crab pattern the potential reversal zone occurs at the 161.8% extension of the XA leg. It is a level far beyond the initial XA movement. In Steem/USDT this pattern suggests a highly aggressive potential reversal. Traders monitor this level for a strong price reversal. It is an overextension in the current trend.
Butterfly Pattern
The Butterfly pattern is another extension pattern. It helps to identify the potential reversals after the price has extended beyond its previous high or low.
Fibonacci Levels:
- XA: Initial leg.
- AB: Retraces 78.6% of XA.
- BC: Retraces 38.2% to 88.6% of AB.
- CD: Extends to 127.2% to 161.8% of XA.
Use in Steem/USDT:
In the Butterfly pattern the potential reversal zone is identified near the 127.2% to 161.8% extension of the XA leg. If Steem/USDT forms this pattern then the price may reverse around this extended Fibonacci zone. Traders can watch for price exhaustion or reversal signals to enter the market with buy or sell positions.
Identifying Potential Reversal Zones (PRZ) in Steem/USDT
Each harmonic pattern provides a precise zone. This zone is called the Potential Reversal Zone. It is the zone where price is likely to reverse. In Steem/USDT trading:
- Traders will watch the Fibonacci levels for confirmation of the different patterns. They will look at the candlestick patterns, momentum and divergence. It will help them to identify the market reversals.
- They may enter positions based on the completion of the pattern. It is required to place stop loss orders beyond the potential reversal zone to manage risk.
- Harmonic patterns provide high reward, low risk setups. It is possible when we use them with other technical indicators like volume or RSI to validate the reversal.
By applying these patterns in the Steem/USDT pair, traders can enhance their ability to predict reversals and capture profitable moves.
Question 2: Identifying Harmonic Patterns on a Steem Chart
Using a historical price chart of Steem/USDT, identify one or more harmonic patterns that have formed. Explain how the pattern adheres to the Fibonacci ratios and predict the potential price movements based on the pattern's completion.
As we have discussed earlier that the harmonic patterns play an important role in the determination of the potential reversal zones as well as turning point in the crypto market. Similarly we can apply harmonic patterns to to Steem/USDT trading pair to identify the harmonic patterns and ultimately the reversal zones of the Steem/USDT trading pair.
Steps to Identify Harmonic Patterns in Steem/USDT:
So in order to identify the harmonic pattern and the reversal zones in the Steem/USDT trading pair as well as to spot the key price movements and Fibonacci ratios at that time we can follow these following steps:
Analyze the Chart for Potential Turning Points
First of all we need to analyze the chart for the potential turning points. We need to identify the significant price movements in the upward and downward direction. Each movement leg will be considered as a turning point. And these turning points will form the key legs of the harmonic pattern XA, AB, BC and CD.
Measure the Fibonacci Levels
After the identification of the price legs such as XA, AB, BC and CD we need to measure the Fibonacci levels. We can use a Fibonacci retracement tool to measure the pullbacks or extensions. Each harmonic pattern has specific Fibonacci levels.
Identify Potential Patterns
Then in order to recognize the correct pattern we need to match the price movements and Fibonacci levels with the harmonic patterns such as Gartley, Bat, Crab, or Butterfly.
Example of Harmonic Pattern Identification
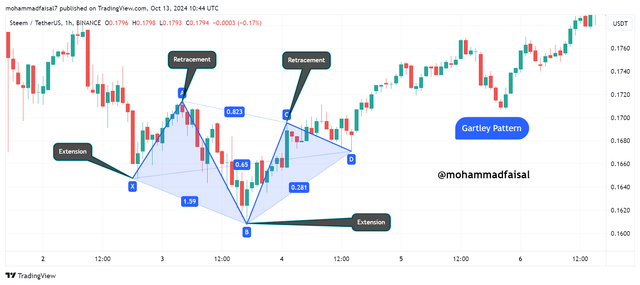
Here you can see I have identified a pattern on the STEEM/USDT chart. There are a number of patterns on the charts. Similarly STEEM/USDT chart has also numerous patterns. According to the above chart I have identified these points.
Identified Points:
- X: $0.1648
- A: $0.1714
- B: $0.1607
- C: $0.1696
- D: $0.1670
These are points from where the legs are starting or ending. And according to these points we will identify the harmonic pattern and determine the name of the pattern.
Steps to Identify the Harmonic Pattern:
XA Leg: This is the initial move from X to A.
- XA = $0.1648 to $0.1714 This is an upward move.
AB Leg: The price retraces downward from A to B.
- AB = $0.1714 to $0.1607 This is a downward retracement.
- Then in order to calculate the Fibonacci retracement of AB as compared to XA:
- (0.1714 - 0.1607)/(0.1714 - 0.1648) ≈ 157% .
This retracement is greater than 100% which is larger than typical retracements in common harmonic patterns like Gartley or Bat. We cannot determine it here so we will continue analyzing the chart and price movements.
BC Leg: The price moves upward from B to C.
- BC = $0.1607 to $0.1696. It is an upward retracement.
- Then in order to calculate the Fibonacci retracement of BC as compared to AB:
- (0.1696−0.1607)/(0.1714−0.1607) ≈82.14%.
This falls within the range for a Gartley pattern (typically between 38.2% and 88.6%).
CD Leg: The price moves downward from C to D.
- CD = $0.1696 to $0.1670 It is a downward move.
- Then in order to check the Fibonacci retracement of CD as compared to XA:
- (0.1696−0.1670)/(0.1714−0.1648) ≈36.36%.
This CD leg does not extend deeply enough for a Crab but it can fit a Gartley.
Pattern Identification:
The structure of X to A to B to C to D fits most closely with a Gartley pattern because:
- The AB leg retraces within a reasonable extension slightly large but it can still fit.
- The BC leg retraces within 38.2%–88.6% of AB which fits the Gartley requirements.
- The CD leg completes near the 78.6% retracement of the XA leg.
Potential Price Movements Based on Pattern Completion
1.Reversal at D:
- In a Gartley pattern D typically indicates the Potential Reversal Zone. As D is at $0.1670 and this is a crucial support level. From this support level the price may reverse and move upward. And you can see in the chart example that from D price moved upward from $0.1669 to $0.1770.
2.Targets:
- The price may retrace back upward toward the C point $0.1696 or even the A point $0.1714. It will as potential take profit levels. Here you can see in the chart that the price touch near the C point at the price level of $0.1707 which is quite near the point C which is at $0.1696.
3.Stop Loss:
- Stop loss is necessary to manage the risk. It can be placed just below the D point at around $0.1650. Because below this level the price suggests that the pattern has failed of the reversal zone. And due to this the price will move downward except going in the upward direction. So it is better to manage your risk by applying stop loss.
4.Price Targets:
- First target: A reversal can happen after the downward retracement of D. The price can reach to the C level at $0.1696.
- Second target: If the price continues to move upward then next level is to watch is $0.1714. It is equivalent to A level. It represents the previous high. We can see the price continuously moved in the upward direction and it reached A level and it retraced a little bit and then again it started next upward movement.
This price structure fits well within the Gartley pattern. It particularly fits with the BC and CD legs. It adheres to Fibonacci ratios. Based on the completion of the pattern at $0.1670, we can expect a potential bullish reversal. It will drive price to move upward to reach the targets at $0.1696 (C) and $0.1714 (A). It can go beyond these targets as well as we can see in the chart.
Question 3: Applying Fibonacci to Harmonic Patterns
Demonstrate how Fibonacci retracement and extension levels are used in harmonic pattern analysis. Provide an example of how a harmonic pattern predicted a significant price reversal in the Steem market.
In the above question I have used a harmonic pattern and it is a Gartley pattern. In this chart I have used extension and retracement levels. And my this pattern gave me a significant signal of the bullish reversal. And according to this prediction the market moved in the upward direction.
Similarly here again I will use Fibonacci retracement and extension levels in the harmonic pattern. As mentioned earlier fibonacci extension and retracement levels are important in the determination of the reversal zones. And these levels are derived from the Fibonacci sequence. In the trading they represent key points from where the price retracement or extension take place. In the harmonic pattern analysis each leg represent specific Fibonacci ratio.
Here is how these levels are applied in the harmonic pattern:
Fibonacci Retracement
- Retracements levels are used to determine how much the earlier move such as XA retraces the price before the next move. These levels are used for the AB and BC legs of harmonic patterns. These levels may be 23.6%, 38.2%, 50%, 61.8%, 78.6%.
Fibonacci Extension
- Fibonacci extension levels may be 127.2%, 161.8%, 200%, etc. They help to predict how far the price may extend beyond the original move. These are crucial for the CD leg. They predict the completion of the pattern at the reversal point.
So in this way these levels are used in the harmonic patterns.
Provide an example of how a harmonic pattern predicted a significant price reversal in the Steem market.
After exploring the STEEM/USDT chart a lot I have identified a harmonic pattern which predicted a significant price reversal in the Steem market. This pattern led the price of Steem in the upward direction by storm and the traders who followed this pattern at that time they made a lot of profit from this profit. So here is there the harmonic pattern. I will not disclose it here which pattern it was but I will tell it at the end after analysing completely and supporting my thoughts with proper explanation.
According to the above pattern I will explain it in detail what the above patterns says and what type of harmonic pattern is this further I will explain how this pattern led to a significant price movement in the upward direction. I will explain how it led to a bullish trend after the price reversal.
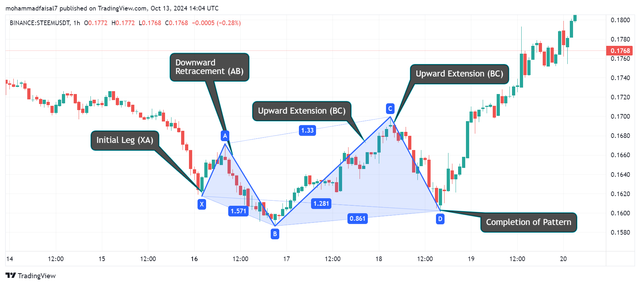
Identified Points:
- X: $0.1619
- A: $0.1672
- B: $0.1586
- C: $0.17
- D: $0.16
XA Leg Calculation
- The XA leg represent the initial move which is starting from $0.1619 (X) to $0.1672 (A). In order to check how the pattern will work with the Fibonacci retracement I will determine the difference between these points.
AB Leg Retracement of XA
In the next leg the price retraces from leg AB. This moves from $0.1672 and ends at $0.1586. In order to check how much the leg XA is retraced I will use Fibonacci Retracement:
The Fibonacci retracement of the XA leg is calculated as:
- As we have already calculated the difference so I will directly divide and multiply both the value to find the Fibonacci retracement.
(0.0086/0.0053)x100 ≈162.3%
It means B has retraced about 162% of XA leg. It is an extension rather than a retracement. This type of deep retracement is common in the Crab or Butterfly harmonic patterns.
BC Leg Retracement of AB
The BC leg moves from $0.1586 and it terminates at $0.0.17. If we find the length of the BC leg it becomes:
In order to calculate the Fibonacci retracement of the BC as compared to Ab I will use the following formula:
It suggests that the leg BC is the extension of the AB leg. It again aligns with the aggressive harmonic pattern such as Crab in which the BC extends beyond the common retracement levels such as 38.2%–88.6%.
CD Leg Retracement of BC
Finally the CD leg moves from $0.17 to $0.16. The length of the CD leg is:
Now we can calculate the Fibonacci retracement of CD as compared to BC. I will use the following formula:
This is a classic retracement which is a key Fibonacci level in the harmonic patterns. It is again special in the Crab and Butterfly harmonic patterns.
Pattern Identification
Based on the Fibonacci ratios:
- B retraces 162% of XA, which is beyond typical Gartley or Bat levels.
- BC extends 132.6% of AB, again suggesting a more aggressive pattern.
- CD retraces 87.7% of BC, aligning with the final leg of a harmonic pattern.
This pattern fits more closely with a Butterfly pattern. I have deter,ined it as a Butterfly harmonic pattern. A butterfly pattern has the following properties:
- AB is typically between 78.6% and 161.8% of XA.
- BC is between 38.2% and 88.6% of AB, or an extension up to 127.2% or 161.8%.
- CD is an extension of 161.8%–261.8% of XA or an 88.6% retracement of BC.
Significant price reversal in the Steem market
As it is a butterfly pattern D point at $0.16 represents the potential reversal zone. After the completion of the pattern at this level the price will reverse the trend and it will go in the upward direction after the consolidation phase.
- The price can easily move back to the C point which is $0.17
- Then the price will retrace to A point which is $0.1672.
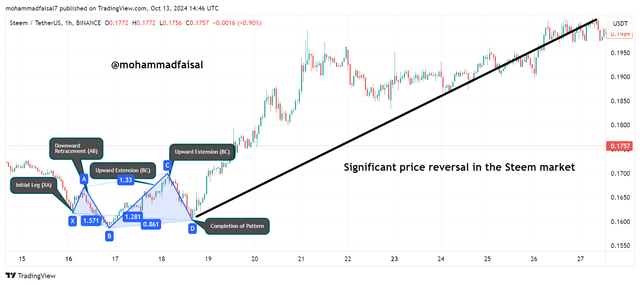
This bullish butterfly pattern proved to be very significant to drive the price of the Steem in an upward direction. It drove the price from $0.16 to $0.20 which is a nice movement. This pattern completed on 18 September 2024. And from that date 24 September 2024 the price moved significantly from $0.16 to $0.20+. This chart and the above analysis highlights how the harmonic patterns with Fibonacci retracement and extension levels can help us to predict the potential price reversals in the market.
Question 4: Trading Strategies with Harmonic Patterns
Develop a step-by-step trading strategy for the Steem token using harmonic patterns. Outline your entry and exit points based on the completion of a harmonic pattern and explain how you would manage risk throughout the trade.
In the above chart we can see that a butterfly pattern is forming. The completion of the pattern at the point D is representing it a bullish butterfly pattern. In order to develop the step by step strategy for the Steem token using the harmonic patterns involves simple steps as mentioned earlier in the above questiions. These are given below:
Determination of the legs values
- X = $0.1619
- A = $0.1672
- B = $0.1586
- C = $0.17
- D = $0.16
Pattern Identification
- XA rises from $0.1619 to $0.1672.
- AB retraces to $0.1586 approximately a 78.6% retracement of XA which fits the Butterfly pattern requirements.
- BC extends to $0.17 representing around a 78.6% retracement of AB.
- CD completes at $0.16 representing around a 127% extension of XA. It is a hallmark of the Butterfly pattern.
This suggests that the D point is a potential bullish reversal zone. As we can see it is located near a strong Fibonacci extension level 127% of XA.
Entry Point
The D point at $0.16 is the ideal entry point for a long position. So we can take long entry based on the completion of the Bullish Butterfly pattern. This is the point from the price will move in the upward direction.
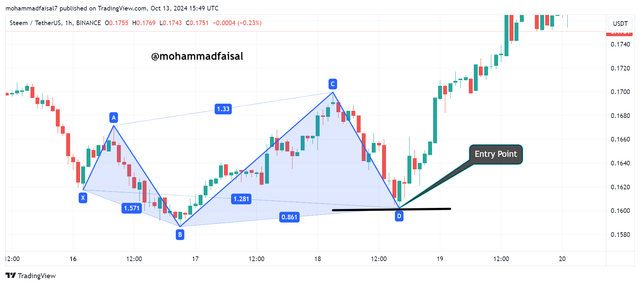
- Entry: We can take a buy enter at $0.16. But before the entry we need to confirm the reversal with the bullish candle pattern. We should confirm the reversal zones.
Exit Points (Profit Targets)
To maximize potential profits, you should aim for multiple profit targets based on Fibonacci retracement levels of the CD leg.
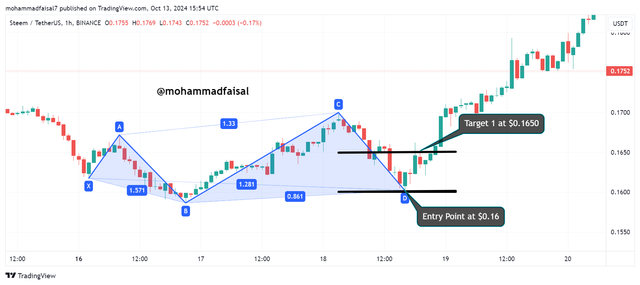
Target 1: 38.2% retracement of the CD leg, around $0.165.
- This represents the first potential resistance level.At this point taking partial profits is a good strategy.
Target 2: 61.8% retracement of the CD leg, around $0.17.
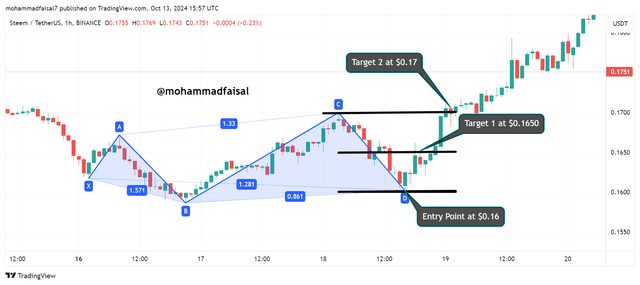
- It is a more substantial exit point as this level typically sees significant price action in harmonic patterns.
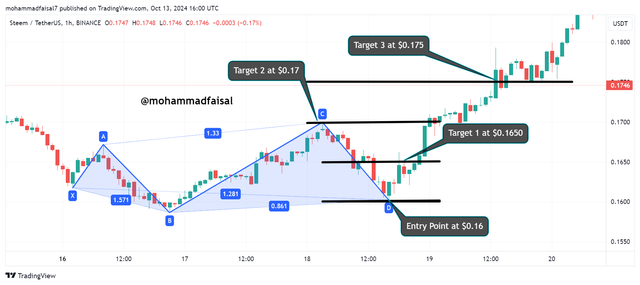
Target 3: Full retracement of the CD leg to $0.175, which would be a complete price reversal based on the pattern.
4. Stop Loss Placement
Risk management is key to protecting the capital. Sometimes it may happen that the pattern becomes fail to execute as expected then at that time we should be well prepare to manage the risk. SO we should apply stop loss to the trade to avoid unlimited loss. We can place the stop loss slightly below the D point.
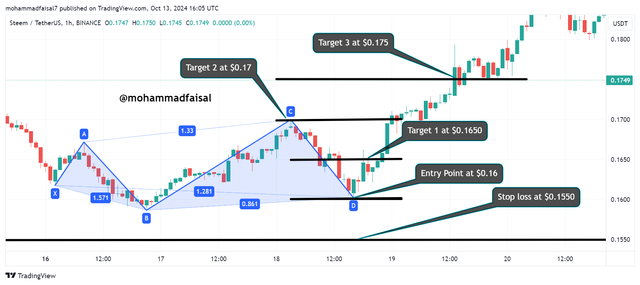
- Stop Loss: We can set stop loss below $0.16. And ideally around $0.155. It will help to manage the risk associated with the trade except to loose all the money.
Risk Management
This Butterfly pattern offers a good risk to reward ratio. Here are the details:
- With a 3% stop loss if the stop is set at $0.155 below $0.16 and a first target of $0.165. In this way we achieve a 1:1.67 risk to reward ratio.
- The second target at $0.17 offers a 1:3.33 risk to reward ratio.
- If the price moves up to $0.175 the risk to reward ratio increases to 1:5.
As a way to manage risk:
- Once the price reaches Target 1 which is $0.165 we should move stop loss to ($0.16). It will secure the position and it will help to avoid loss in the trade.
- It is a wonderful technique to manage the risk. We should take partial profits as the market move as expected. We can take some profit at target 1 and some at target 2 and we can hold remaining assets until the target 3.
This Bullish Butterfly pattern strategy suggests entering the trade at $0.16. And it suggests exit points at $0.165, $0.17 and $0.175. It suggests to set the stop loss around $0.155. This strategy presents a balanced approach to capture profits while protecting against downside risk. Using Fibonacci levels and trailing stop loss we can ensure to maximize potential gains while limiting losses.
Question 5: Current Market Analysis Using Harmonic Patterns
Analyze the current market conditions for Steem and apply harmonic patterns to forecast potential future price movements. Explain how these patterns could influence your trading decisions and the accuracy of your predictions.
In order to analyze the current market conditions for Steem by applying the harmonic patterns and to forecast the potential future price movements I have moved towards the current chart data of the Steem through TradingView.
I have tried to find out a pattern in the current situation of the market. So here in the below picture you can analyze the pattern which I have detected on the recent price chart of Steem. In this chart I have taken 1 hour time frame to analyze the current market situation and the next move of Steem.
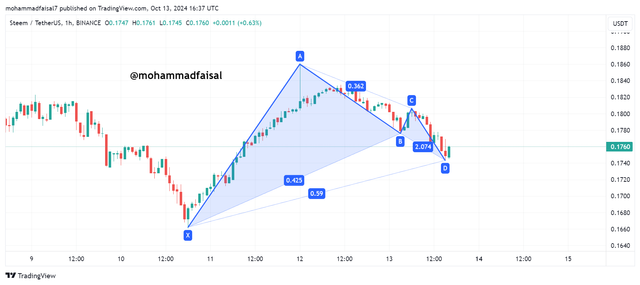
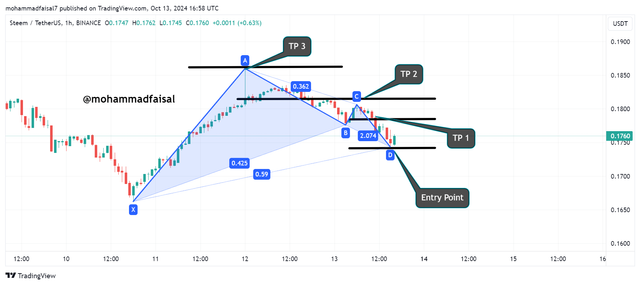
Based on the points in the chart I have simplified the data here:
- X = $0.1663
- A = $0.1861
- B = $0.1775
- C = $0.1807
- D = $0.1742
We can analyze this setup as a potential Bullish Gartley pattern.This structure suggests that a reversal can occur around the point D or at the completion of the pattern.
Pattern Analysis and Fibonacci Ratios
According to the above data it is looking a Bullish Gartley harmonic pattern.
XA Leg: This initial movement from $0.1663 to $0.1861 sets the foundational range for the pattern.
AB Leg: The retracement from A ($0.1861) to B ($0.1775) appears to be close to a 61.8% retracement of the XA leg. It is a key level for Gartley patterns.
BC Leg: The subsequent move from B ($0.1775) to C ($0.1807) represents a 38.2% to 50% retracement of the AB leg. This is another common Fibonacci relationship in harmonic patterns.
CD Leg: The final leg from C ($0.1807) to D ($0.1742) is approaching the 78.6% retracement of the XA leg, which is a critical Fibonacci level for the Gartley pattern.
The alignment of these Fibonacci levels suggests that D ($0.1742) is a potential reversal zone. So after the completion of this harmonic pattern as shown in the above picture we can suggest that this point D is a significant reversal point zone.
Trading Strategy and Forecasting Price Movements
Entry Point
The D point at $0.1742 is the expected reversal zone in this Bullish Gartley pattern. Once the price reaches this level and shows signs of reversal such as a bullish candlestick or other technical indicators. It will be a suitable entry point for a long position.
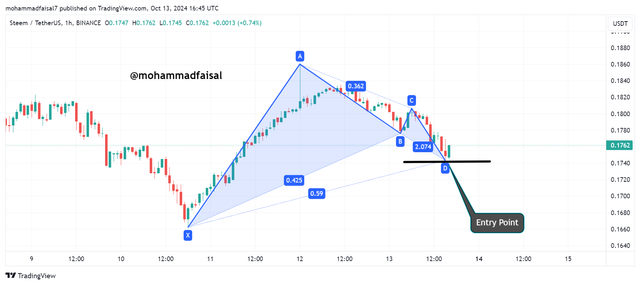
- Entry: When the trend has been confirmed with the help of the other indicators. Then we can place buying entry at the price range of $ 0.1742 from where the point D is ending.
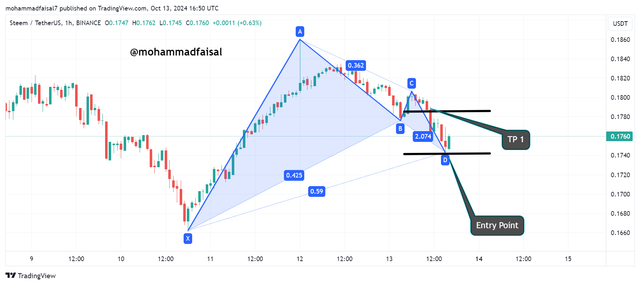
Profit Targets
Setting profit targets is essential for maximizing gains:
Target 1: The first target can be at the 38.2% Fibonacci retracement of the CD leg, which is around $0.1785.
Target 2: The second target can be at the 61.8% retracement, around $0.1815, as this represents a deeper retracement where the price might face resistance.
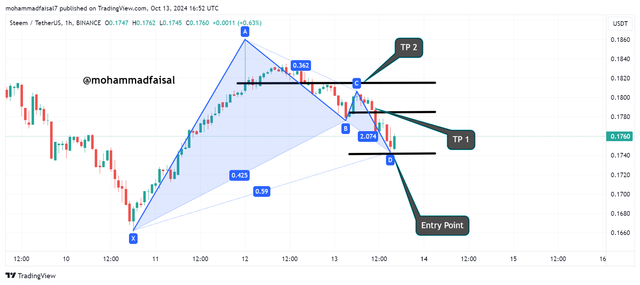
- Target 3: If bullish momentum continues then the final target can be at $0.1861. It is the high point of the previous high at Point A. It represents the full retracemment of the pattern.
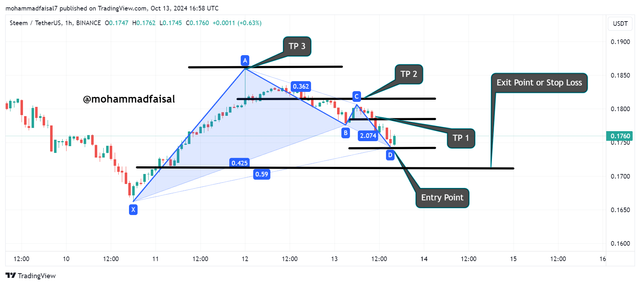
Stop Loss
To manage risk, place a stop loss just below the D point. Given the potential volatility, a stop loss at $0.1715 (just under the D point) would provide a reasonable buffer to protect against downside risks.
Risk to Reward Ratio
- With a stop loss at $0.1715 and a first profit target at $0.1785the risk to reward ratio is roughly 1:2. It makes it a favorable trade.
- The second target at $0.1815 improves the risk to reward ratio to 1:3. And similarly the final target at $0.1861 offers even higher potential returns.
Market Context and Impact on Trading Decisions
The Steem market has recently shown volatility. The price of Steem has increased in trading volume. The price movements suggest that Steem could be building towards a short term reversal. And it will follow this harmonic pattern while forming the next trend.
Bullish Momentum: If the price holds above the $0.1742 level. And if the price starts rising the it can confirm the bullish Gartley pattern. And it offers a good long opportunity.
Breakdown Risk: If the price breaks down below $0.1742 and falls toward the $0.1715 stop loss level. It may be a wrong or invalid pattern. And it will then the signal of bearish trend.
Accuracy of Predictions
Harmonic patterns provide a systematic approach to identifying potential reversals. But this accuracy depends upon the Fibonacci levels in the market. Indeed all the harmonic patterns are very productive to determine the reversal and the next trend.
But on the other hand some factors such as market sentiment, external news or major changes in the cryptocurrency trends impact the reliability of the forecast. So the above pattern suggest a bullish potential. But risk management is always important.
On the basis of this Bullish Gartley pattern the price of Steem can see a reversal near $0.1742. And it can lead the trade to upward direction. And the next targets of this move may be at $0.1785, $0.1815 and $0.1861.
Disclaimer: All the chart screenshots for the explanation have been taken from TradingView otherwise stated.
Upvoted! Thank you for supporting witness @jswit.
X Promotion: https://x.com/stylishtiger3/status/1845516016077730111