CANDLESTICK PATTERENS - Steemit Crypto Academy Season 5 - Homework Post for Task 10 || for Prof @reminiscence01 || by @msalmanjaved
Hello Everyone!
Greetings to All
Hope everyone is doing well!
About me
My name is Muhammad Salman Javed from Pakistan. I am Software Engineer by Profession but I love to Writing and Public Interaction. I love to meet and work with different people. As My complete Introduction is here

About Today Home Work Task
Today i am very excited to attempt my Homework Task # 10, given by Crypto-Professor @reminiscence01. Task is related to CANDLESTICK PATTERENS. During the preparation of this task i have learned many new concepts and new things.
Get Started
There are Some Questions related to this Home Work which i am supposed to answer are given Below as
1. What is the meaning of the Japanese candlestick chart? (A screenshot of the original is required) ?
2. Explain why the Japanese Candlestick chart is the most popular in the financial market in your own words ?
3. Explain the difference between a bullish and a bearish candle. Explain its anatomy as well. (A screenshot of the original is required) ?
Question 1 : What is the meaning of the Japanese candlestick chart ?
In today’s time the international Stock market, Forex Trading, and Crypto Exchanges are showing very variable results, fluctuating the prices and now investment in crypto is very risky investment, and without the complete understanding and knowledge one should not jump into the ocean of Crypto Market.
For the understanding of market trends and fluctuations there are many tools where we can analyze the ups and downs and we can determine the time which is best to invest or not. Japanese candlestick chart is one of the chart which helps us to effective technical analysis of market and also helps to make a good investment decision.
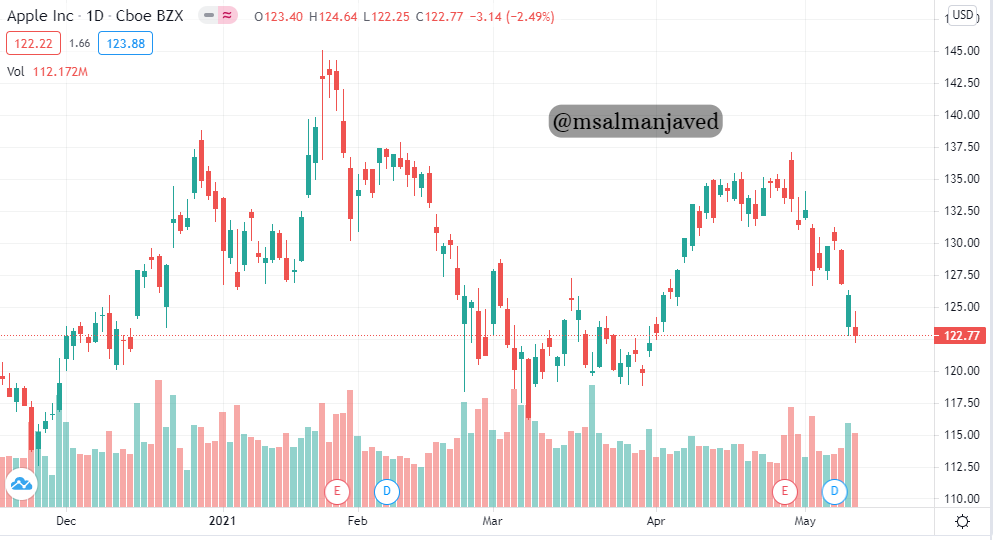
The Japanese candlestick Chart is graphical representation of the market assets with their prices, this system is developed in 1700s by a trader named Munehisa Homma who was doing trade in Rice, and the main reason to develop this system is the conflict between the Demand and Supply in the market between the seller and buyer.
Candlestick chart is now using worldwide to understand the financial market trends for detailed market technical analysis. These charts are using by traders to determine the price movements up and down and they use it to make future investment decisions on the basis of the previous trends.
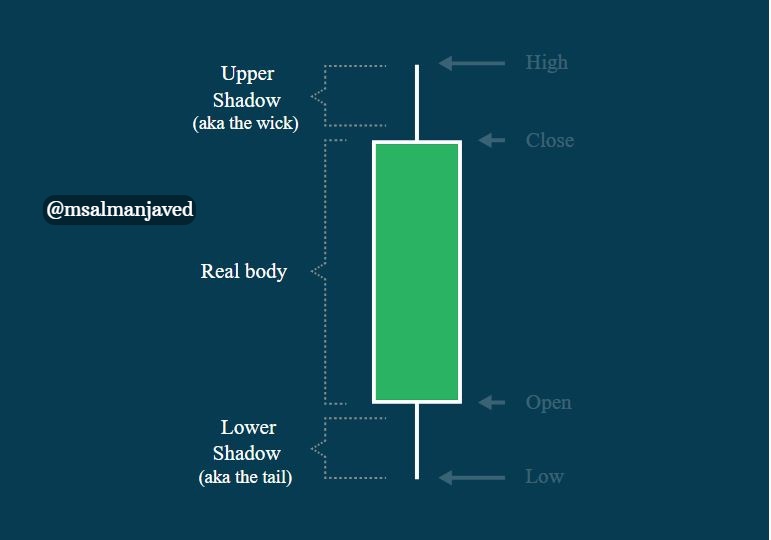
Candlestick Components
Candlestick chart shows the prices on Three main points.
- Open Price
- Closed Price
- Action of Price (Low, High)
These prices points taken from a specific time frames, it could be from start to end and or for half day interval or could be 1 hour.
1. Open Price
This term is associated with the opening price of market in a specific time period, if we analyzing the market for last week then this would be opening price of particular on that week when market have started.
2. Closing Price
This term is associated with the Ending price of market in a specific time period, if we analyzing the market for last week then this would be last price of particular on the end of week when market closed.
3. Action of Price (Low, High)
This term is associated with the fluctuation of price up and down during specific time frame price could be low and high with respect to opening price.
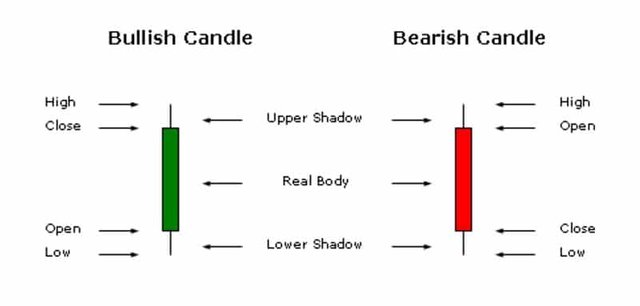
When prices of a particular currency is high it shows the demand of that currency in market, and traders are interested to invest in, then green candlestick shows its behavior is called Bullish candle.
And vice versa of it when price of a particular currency is going down and no more demand is there in market its behavior shown by Red Candle is said to be Bearish Candle.
Candlestick chart are very important tool to judge the market stats, and predict the future behavior of market on technical grounds and now this is most common tool used in Crypto market.
Question 2 : Explain why the Japanese Candlestick chart is the most popular in the financial market ?
Explain in your own words?
The origin of Candlestick chart is Japanese, and this chart is mostly used worldwide to make technical analysis and use for the future decision in Finance involved markets like crypto markets and Stock markets.
These charts are preferable over the other bar charts because these are easy to understand and we can analyze market trends in any specific time of frame.
1. Determine Market Behavior
By the help of Candlestick charts traders can easily determine the state of market and its behavior either it would be bullish or bearish, they can easily identify the sentiments of trade by up and down candles.
2. Determine Future Directions
Candlestick charts helps to define the future trends also, on the basis of past patterns. By the colorful representation of candles it is easy to judge where to buy and sell, this also helps in future decision making also.
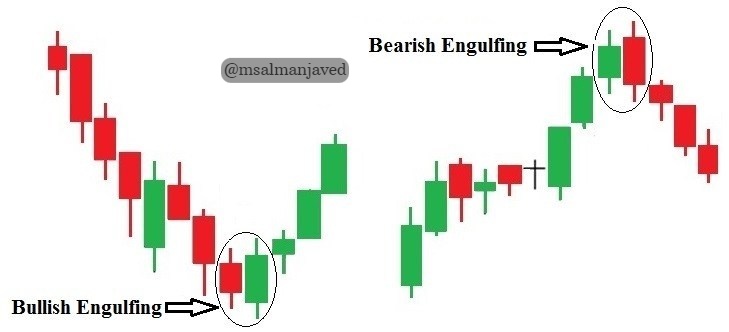
3. Point out market Patterns
By the help of Candlestick charts it is very easy to point out the bullish and bearish patterns which are not easy to identify in other bar charts and financial graphs.
Question 3 : Explain the difference between a Bullish and a Bearish candle. Explain its anatomy as well?
Currently Candlestick charts are most popular tools to understand the market behavior and technical analysis for investment point of view. Statistics have drawn on the chart with the help of candlesticks which shows the up and down movement of prices. And these candles are sometime bullish and sometime bearish. Depend upon the demand of coin in which we are going to invest.
At the start of the market every currency have its own value, which Is indicate by the candlestick if the price is higher at the end of the day, then the candle which indicate the price fluctuation is said to be Bullish candle shows in green color. This candle always close to previous candle and start from a higher point which shows it is increasing gradually.
Anatomy of Bullish Candle
A Bullish candle starting from a lower price always when a market have started and ends on the higher price. It shows the price on four points.
1. Open Price
This term is associated with the opening price of market and candle starts at this point in case of bullish candle it always starts from the lower price and ends on higher price.
2. Close
This term is associated with the Closing price of market during specific time period and in case of Bullish Candle this price always higher than starting price.
3. Low
This term is associated with the lowest price of market of any currency during the specific time frame and it may be low from the starting point of market price but in case of bullish candle it would be for short time of interval and price would be up after some time also.
4. High
This term is associated with the highest price of market during the specific time frame this shows that the high demand of a particular, and its trading demand in market.
Anatomy of Bearish Candle
This candle is totally vice versa of the Bullish candle, its starts always from higher price than its ending price. And Red candle have drawn its impact. This candle also depicts the sentiments of market on four points.
1. Open Price
This term is associated with the opening price of market and candle starts at this point in case of bearish candle it always starts from the higher price and ends on lower price.
2. Close
This term is associated with the Closing price of market during specific time period and in case of bearish Candle this price always lower than starting price.
3. High
This term is associated with the highest price of market during the specific time frame this shows that the high demand of a particular, and its trading demand in market. It shows the buying was high in the market in this specific time.
4. Low
This term is associated with the lowest price of market of any currency during the specific time frame and it may be low from the starting point of market price but in case of bearish candle it would be for long time of interval and there is very less chance that price would be up. This is due to high selling in the start of market which leads towards the low price.
Conclusion
This was about my home work task #10, which was related to candlestick patterns, I got to know about many new concepts and about investment in Crypto market which is Easy but not as Simple as we think, without knowledge and proper understanding there are 100% chances we will lose our wealth I also came to know the other things in this homework task which would be really helpful for me in the world of Crypto.
I hope I would get some good remarks from professor on my effort.
Note : All the Images that i have used have been citied and source have given with every image.
Cc :
Professor:
@reminiscence01
@awesononso
@nane15
@dilchamo
Dear SteemIt team, I have participated many time in #club5050 and #club75 but not get curated need your support here also.
CC:
@steemcurator01
@steemcurator02