Steemit Crypto Academy Season 5 Week 1 [Beginner's Course] - Understanding Trends by @msalmanjaved
Hello Everyone!
Greetings to All
I Hope everyone is doing well!
My name is Muhammad Salman Javed from Pakistan As My complete Introduction is here .
I am much obliged to Steemit Crypto Academy where we have so many things to learn about Crypto Market and Safe and secure Investments.
I would like to thanks Prof @reminiscence01 for this Course which helped me to develop the understanding of Market Trends.

Home Work Task : Understanding Trends
1) a) What do you understand by a Trending market?
We can define the word Trend as a change or development of new things in a general direction we can relate it as a new fashion in simple words similar to this Trending market is such type of market in which some new developments or changes are happening in some direction.
Crypto Market is also a Trending Market in which Pricings fluctuates between High and Low with respect to time, and these Fluctuations are said to be changes and direction could be Downward and Upward so we can say Crypto Market is also a trending Market.

These Prices in Crypto Market fluctuate due to High demand and Low supply and vice versa, but most of the time these are constantly changing. These trends are to very important to learn if anyone have plan to trade in the crypto currency. There are many reasons behind these trends some time these are showing extra ordinary changes in behavior.
In the Stock Market and Forex trading Market the main Trend Setter is $USD, same as in Crypto market the main Trend setter is Bitcoin. Total market trends based on the price of the Bitcoin and it sets the trend of market either it goes Upward or Downward.

Most of the time market stills in the same condition not going up and now going down, this state is called Ranging Phase or Sideway Trend. Mostly traders avoid trading during this time because they just go with the trends which could be Upward if market is high, and could be Downward in case if market is low.
1) b) What is a bullish and a bearish trend? (Screenshot required) ?
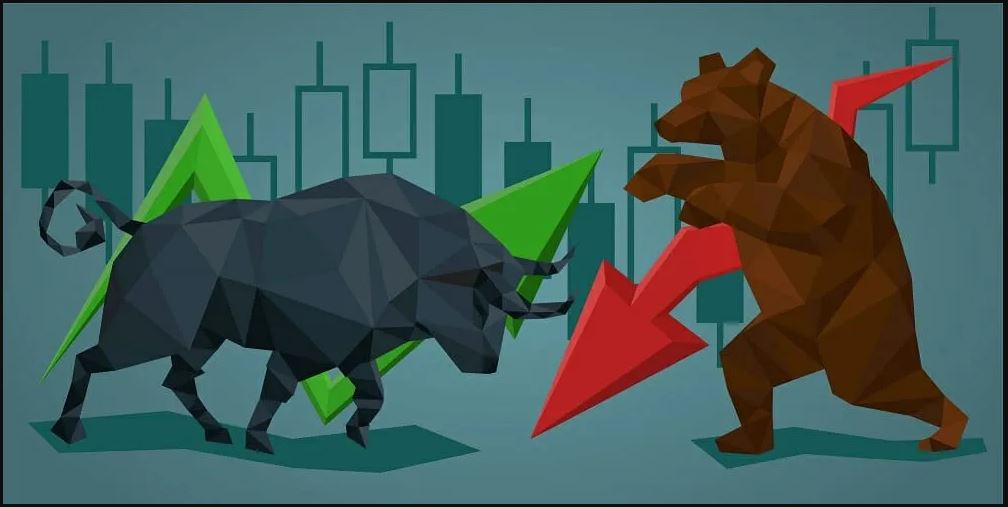
In all kinds of trading markets we hear these words Bullish and Bearish frequently actually these came from the animal behavior while they are fighting for their survival.
Bullish came from the animal Bull, when a Bull fights it will always lift up the opponent with his horns. So in the World of Trading Market whenever Market is High, going upward then we say this is Bullish Trend.
Bearish Trend came from the Bear, when a bear fights it always laydown his opponent. So in the World of Trading market whenever market is going downwards it would relate as Bearish Trend.

When a market going upward in a specific time of interval then we can say this is Bullish trend. In crypto market when the prices goes up then the holders feels much secure and the risk of loss is very low to them, and in this Bull Season overall demand of specific item goes high and in result trade also goes high mostly traders just go for buy and hold.
I just gone through the comparison of SHIB/USDT pair in the crypto market I got a clear idea of Bullish trend.
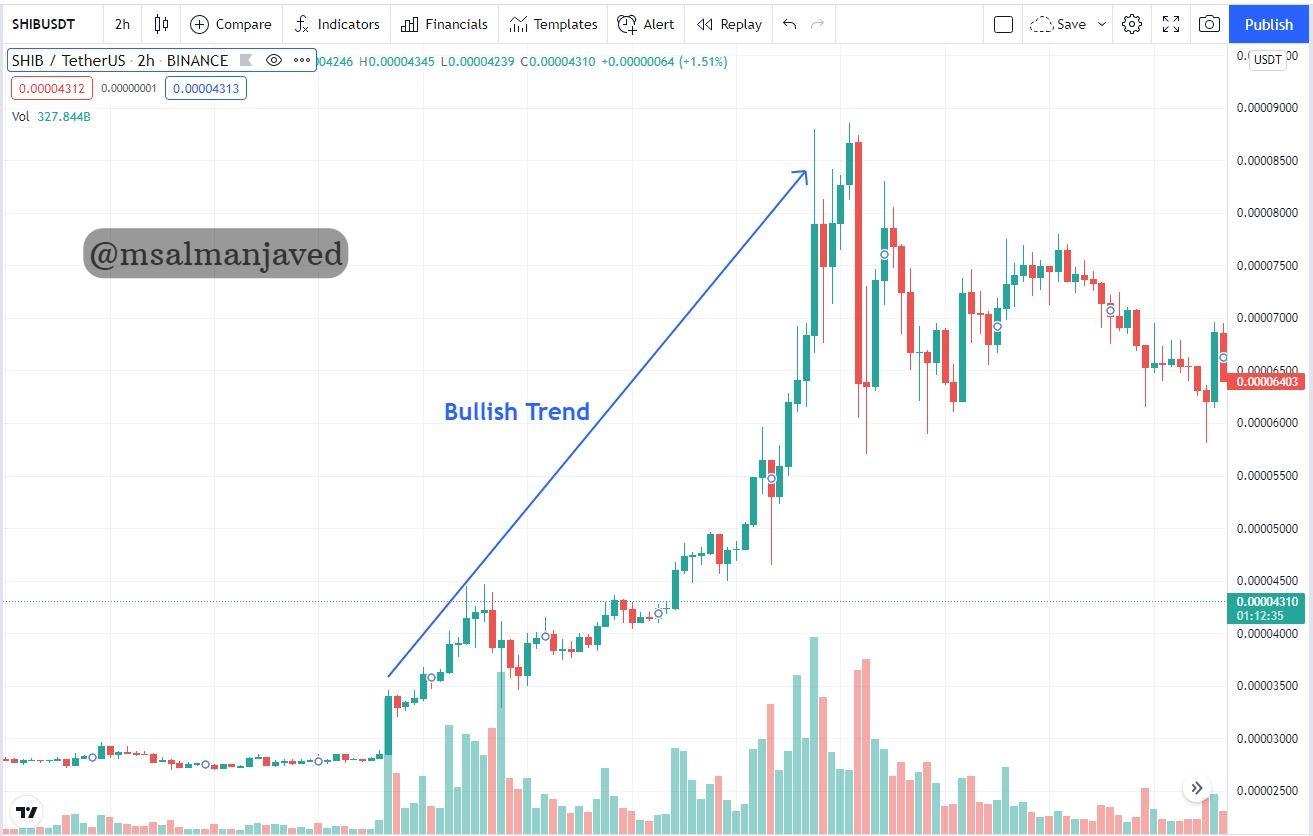
Source: SHIB/USDT bullish trend on tradingview
When a market direction is downward for specific time of interval then we will say this is Bearish trend. In the market when prices of a specific item decreases. then investors feels more unsecure and mostly go for selling to save the utmost lost. In this time of period situation got worst and pessimistic for investors and traders.
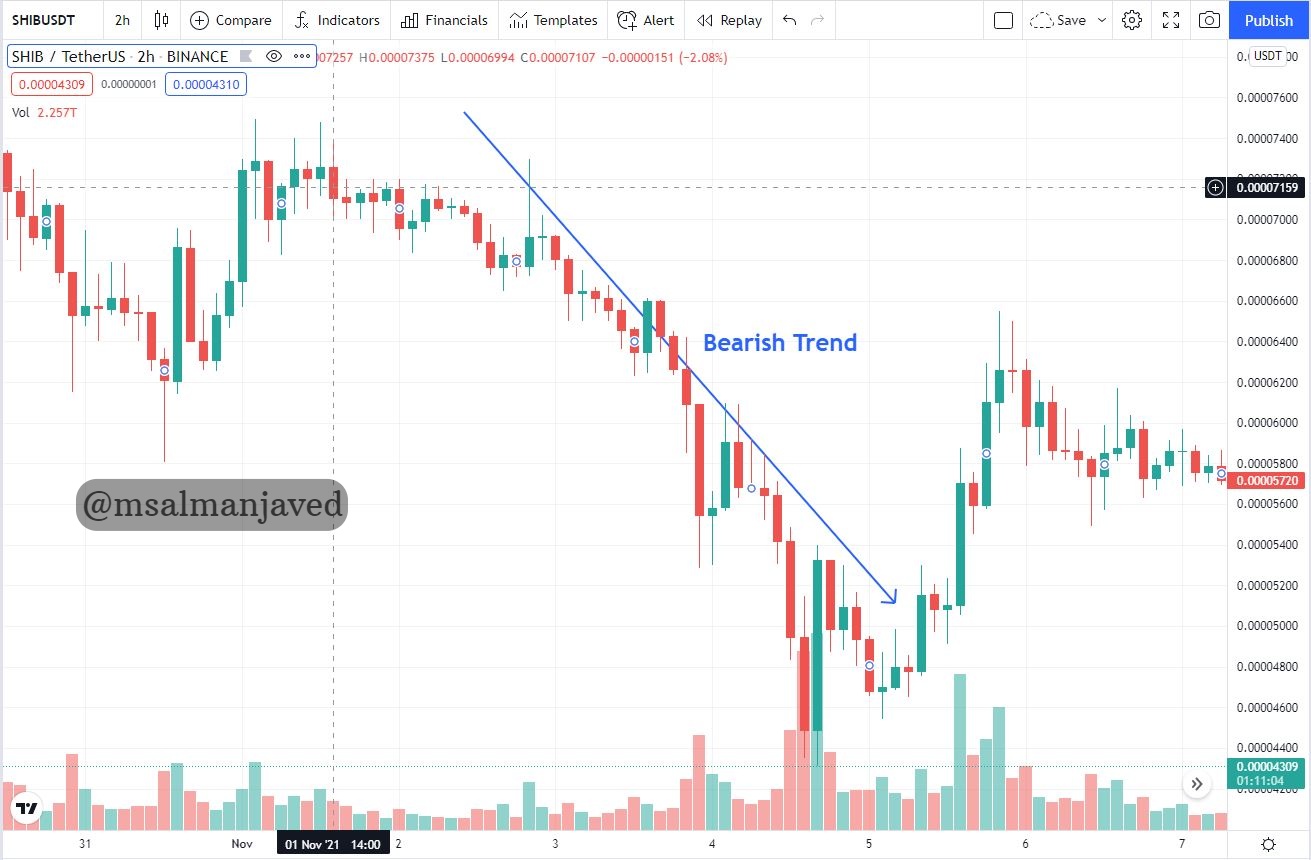
Source: SHIB/USDT bullish trend on tradingview
2) Explain the following trend identification and give an example of each of them. (Original screenshot needed from your chart). Do this for a bullish and a bearish trend.
i) Market Structure
Investors and traders analyze the situation of market by its structure, and this give us detailed information of market Trend we can see clearly either market is low and high and if we analyze this structure by its detailed examination then we can easily get the idea about what would be the future trend for the investment point of view.
We can easily understand the structure of the market by candlesticks pattern which are commonly use for better understanding.
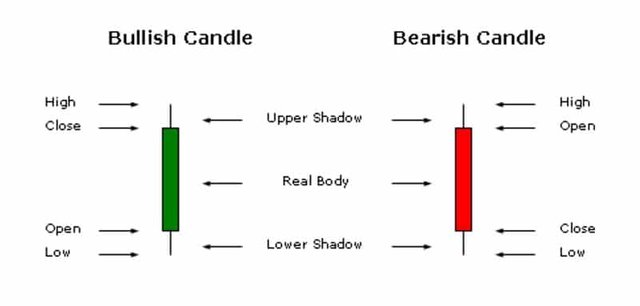
1. Bullish Trend Structure
If we look into the Bullish market structure then we see that H-H and H-L formations. Here is H-H higher to High and Higher to Low formation. In H-H Formation trade price is increasing gradually and in simple words market trends is going upward where price will not trade less to the previous low. Same case with H-L also where traders prefer to buy on low point and sell on high point.
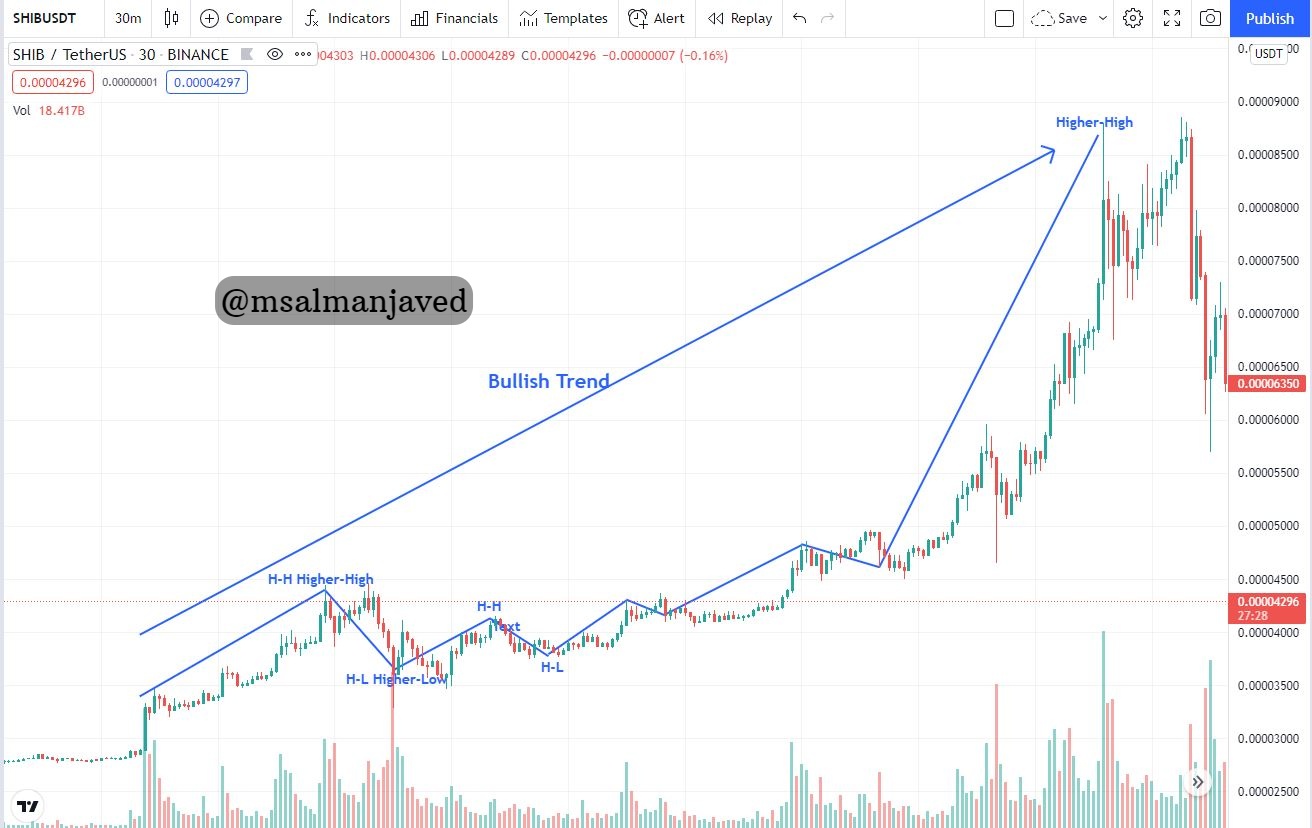
Source: SHIB/USDT bullish trend Structure on tradingview
2. Bearish Trend Structure
Same as if we look into the Bearish trend Structure we see the L-H and L-L formation which is Lower to High and Lower to Low pattern which shows price is going down in this case price will never close higher than its previous opening it always less than that. This situation is pessimistic and alarming to the investors and traders.
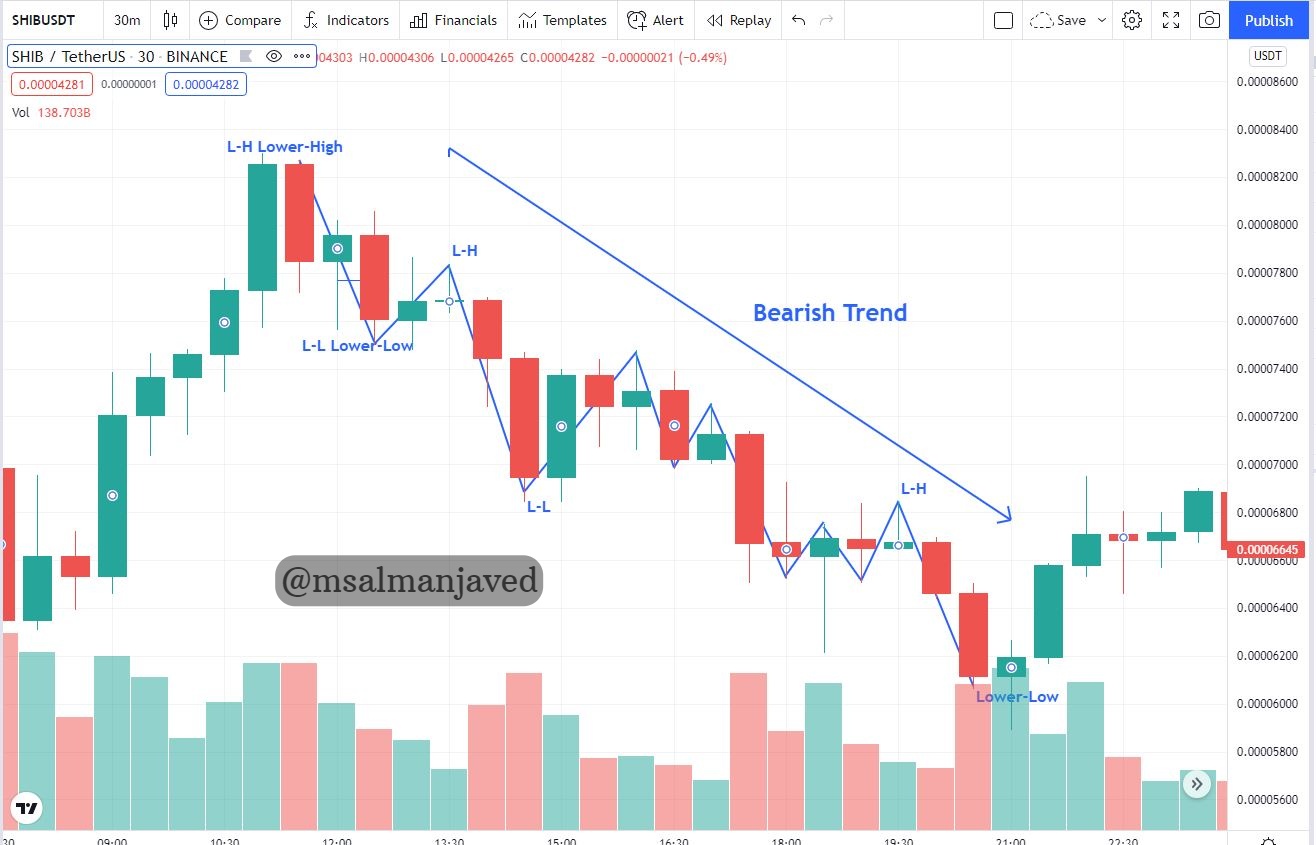
Source: SHIB/USDT Bearish trend Structure on tradingview
2. Ranging Phase Structure
Two trends of market are most common one is Bullish and Second is Bearish where market goes up or down but despite these two there is third Situation where market behaves neutral, either not goes up and nor goes down this time it continually moves horizontally this is called Ranging Market Phase. This state usually happens when big giant like whales purchase in bulk from small traders.
Source: SHIB/USDT Ranging Phase Structure on tradingview
ii) Trendlines
Trend line is a tool which we use to analyze the market structure, this line plays an important role to determine the direction of market. This line helps to those who wants to buy or sell the specific item they can analyze easily the market future trend by this line. This is one of the best method of analysis which developed for the buyers and sellers for making good profit in trade.
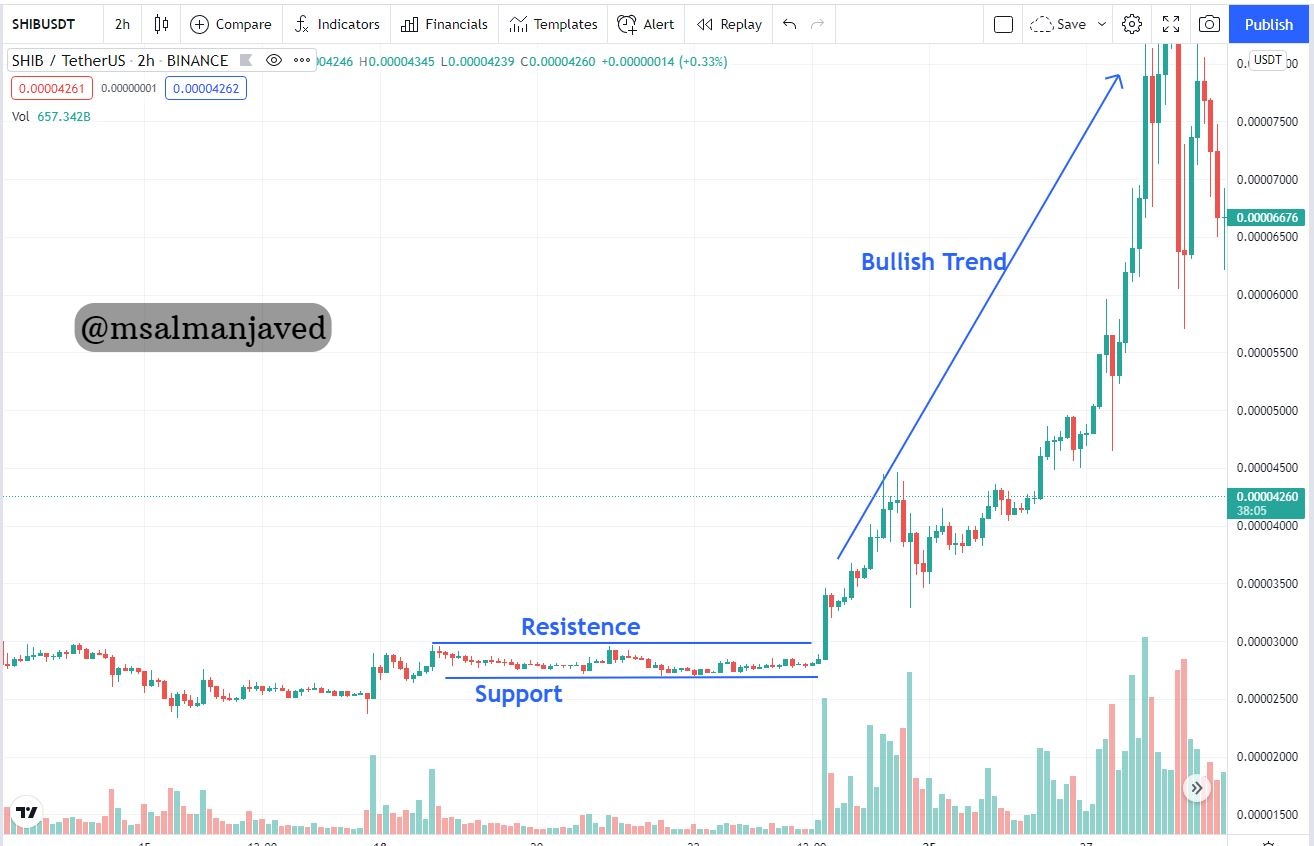
1. Bullish Trend Line
In Bullish trend where market is going up and price of an item is going high then we draw a line and combine the two lowest point and draws its extension to upward. When prices of item touch this lines it gets support and goes up again until the trend line is broken, and when this line get broken then traders should step back from trading.
For check the Better Trend and trend line i changed my selected pair from SHIBUSDT to ETHUSDT pair.
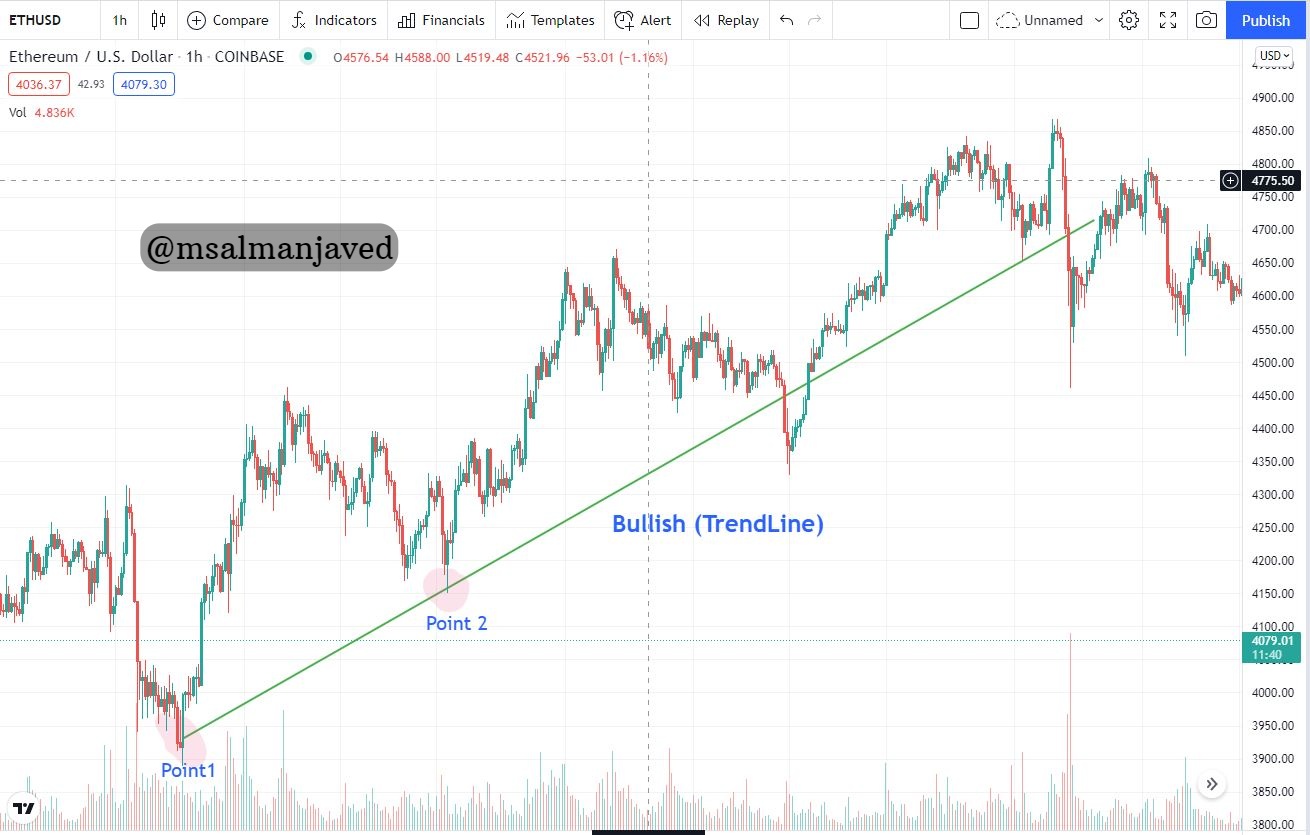
Source: ETH/USDT Bullish trend line on tradingview
2. Bearish Trend Line
In bearish trend where market is going down gradually and price of an item is decreasing then we draw a line and combine the two highest points and draws its extension to downward. When price of relevant item touch this line it bounce back due to the resistance of line and get back to lowest point until the Trend line got broken.
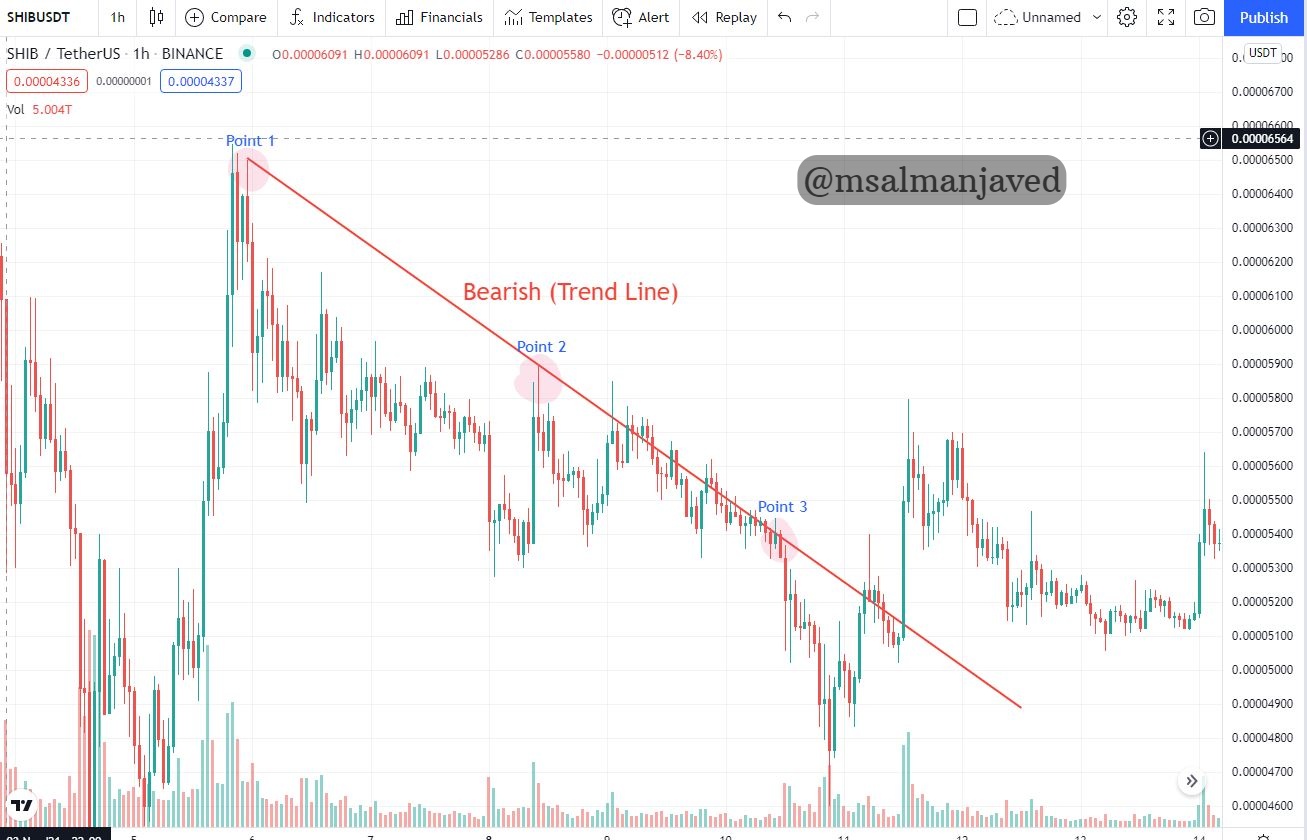
Source: SHIB/USDT Bearish trend line on tradingview
3) Explain trend continuation and how to spot them using market structure and trendlines. (Screenshot needed). Do this for both bullish and bearish trends ?
When we talk about the market trends we see the fluctuation of price it goes high and low and some time it touches trend lines many time in a specific time frame and get resistance or support to go down and for go up to continue the trend either bullish trend or bearish trend. During this some traders earn profit and some goes in loss and many of new traders enter when price goes down these all things ensure the continuity of a trend.
Bullish Trend Structure
There are some important things which to be learnt in Bullish Trends every time new price will not trade less to the previous low it would always high then previous higher price and new low always be higher than previous ended low.
Source: SHIB/USDT bullish trend Structure on tradingview
Bearish Trend Structure
There are some important things which to be learnt in Bearish Trends every time new price will trade less to the previous high it would always low then previous higher price and new low always be lower than previous ended low. It means price is decreasing gradually.
Source: SHIB/USDT Bearish trend Structure on tradingview
If the trend line is not broken, the following Trend Continuation is valid. A breach that crosses the trendline might indicate a trend reversal. It may violate the following trend and cause phase reversal. It may be seen in the illustrations below with both the bullish and the bearish trend.
Trend Structure Continuation
When we talk about the trends in terms of Trend line, During the continuation of a specific trend either Bullish and Bearish if the line hit many time but not get violated or broken then this is continuation is valid. And if it violate and change the behavior then line will be broken and it can be cause of phase reversal. Both Bullish and Bearish Trends examples are here.
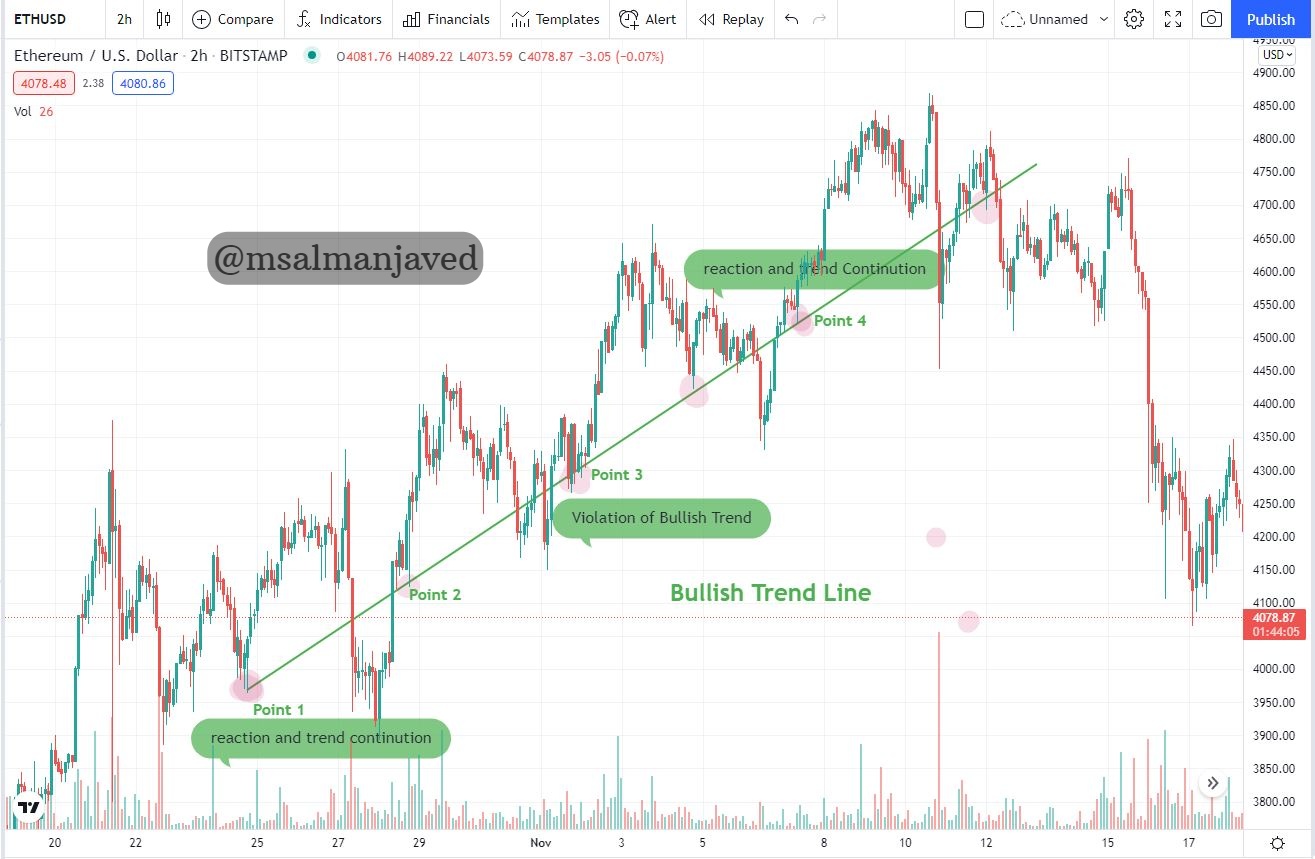
Source: ETH/USD Bullish trend Structure Continuation on tradingview
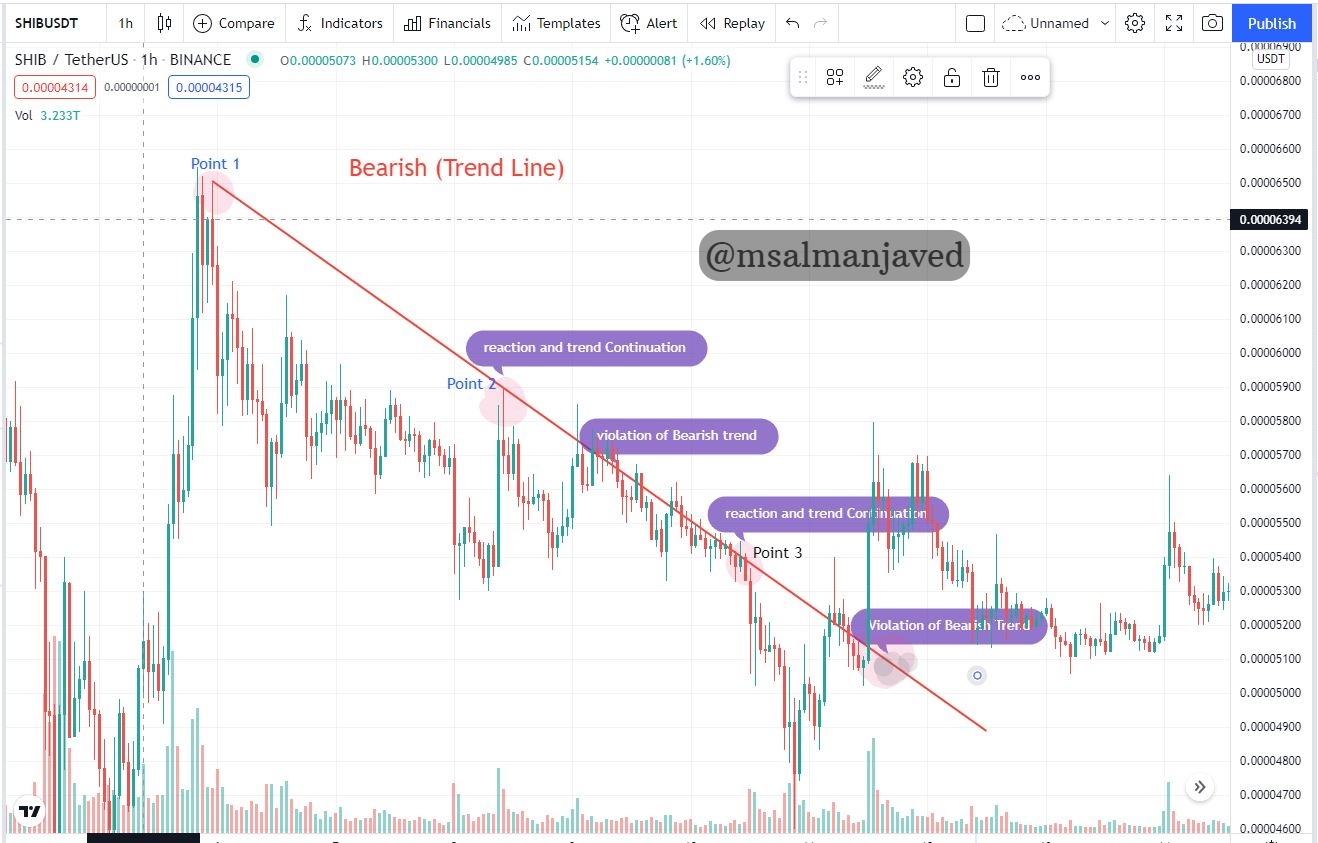
Source: SHIB/USDT Bearish trend Structure Continuation on tradingview
4) Pick up any crypto-asset chart and answer the following questions ?
i) Is the market trending?
To analyze the current market trend I selected the pair of SHIBUSDT and I just analyses the today market with respect to previous 2 hours, in which I came to know in the start trend was Bearish and now this in in Ranging State no current trend is showing now. I selected this pair because of less trading in this pair happened in market.
ii) What is the current market trend? (Use the chart to back up your answers) ?
I examined the market Stats of previous 2 hours and i saw that there is no current trend showing as the graph is given. it started from the bearish Trend then after some time it comes in the ranging Phase . however if any one wants to invest in these coins they should do some technical analysis on it before going for it.
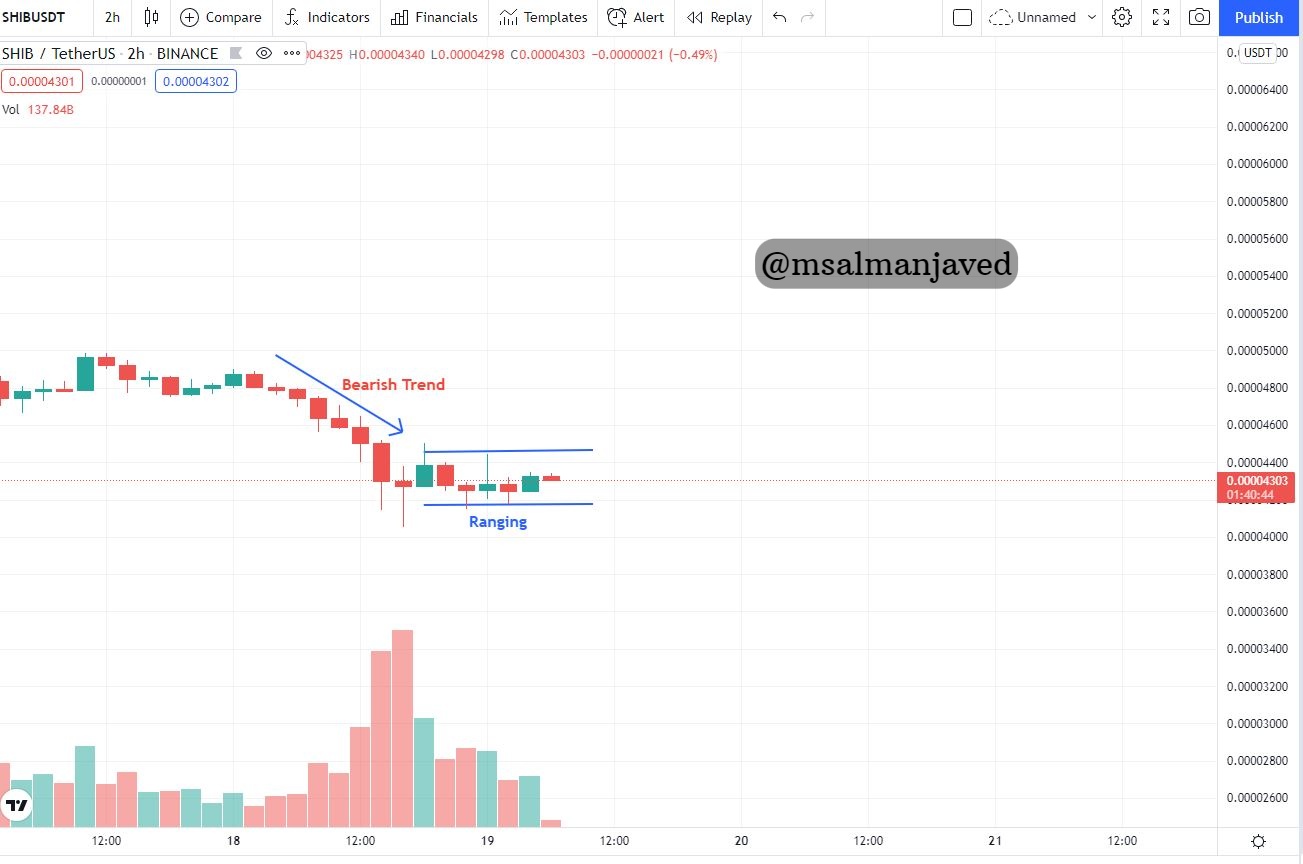
Source: SHIB/USDT Current Trend on tradingview
Conclusion
Trends in trading market are most important things needed to understand by every trader and investor for better profit in market. These trends helps to understand about which time is better for investment and where to stop and step out from trading. This is just a technical analysis which helps us to make good decisions about crypto investment to avoid the loss in trading.
In the attempt of this Course I do a lot of research and study which cleared many concepts of mine related to Crypto Market and trends in Crypto Market. At the end I would like to thank, professor @reminiscence01 for his precious time and effort for beginners like me.
I hope I would get some good remarks from professor on my effort.
Note : All screenshots are taken from www.tradingview.com and all the Images that i have used have been citied and source have given with every image. I prepared and Attempt this Course on the education purpose and not for the technical advice for investment point of view.
Cc :
Professor:
@reminiscence01
Hello Dear professor @reminiscence01
it was my first Crypto academy Beginner task and i spent alot of time on it and finished it but unfortunately its not voted/Curated yet and it will be expired shortly please have a look at it .
Thank you
Post Link:-
https://steemit.com/hive-108451/@msalmanjaved/steemit-crypto-academy-season-5-week-1-beginner-s-course-understanding-trends-by-msalmanjaved
CC:
@steemcurator01
@steemcurator02
@sapwood
#club75 , #club5050
Sorry about that. Please kindly repost your article with a screenshot on your grade.
Thank you for your kind Response Professor @reminiscence01, i have reposted it now.
Alright.