[Hekin-Ashi Trading Strategy]- Steemit Crypto Academy | S4W2 | Homework post for @reddileep

Introduction
Goof day everyone,
It is another beautiful week, the week 2 of the season 4 in CryptoAcademy. I am Kehinde Micheal and my username is @msquaretwins. It is my pleasure to be submitting my homework post for Professor @reddileep who has presented a lecture on a great chart called Heikin-Ashi Trading Strategy in the intermediate class. He has explained in detailed the concepts of the chart and how a trader can use it with other indicator for effective trading. Thank you Prof. @reddileep. Series of question were posted in the homework section and I will be answering them one after the other in this post. Happy reading!
1- Define Heikin-Ashi Technique in your own words.
Heikin-Ashi which can also be written as Heiken-Ashi is the average bar in Japanese Language. It is a chart pattern that measures the average price of market data to create a better and modern candlestick which helps to minimize market noise. Heikin-Ashi Technique was a brainchild of a man called Munehisa Homma who is often regarded as the Father of Candlestick Pattern.
The chart pattern of Heikin-Ashi could be seen as a modification of Candlestick pattern. Merely looking at the two charts, Heikin-Ashi and Candlestick, they both appear similar. But Heikin -Ashi differs in the sense that the current candle data are the result of the average of the previous candle. The chart pattern help traders to read market data esp. When to get into and out of market since it filters the noise generated by price in market.
Heikin-Ashi consists of candles with a body, lower shadow and upper shadow. Each candle has high, low, open and close. Heikin Ashi makes use of the previous open, close, high and close of a candle to calculate the data of next candle. The continuation of this technique then makes a pattern. The technique is centered on averages of two values or period. The opening of candle in Heikin Ashi starts from the middle of the previous candles. The candlestick employed by Heikin Ashi appear neat and even unlike the Traditional Japanese candlestick.
2- Make your own research and differentiate between the traditional candlestick chart and the Heikin-Ashi chart. (Screenshots required from both chart patterns)
There are many differences between Heikin-Ashi Chart and Traditional candlestick chart. The differences are highlighted below.
Differences between the traditional candlestick chart and the Heikin-Ashi chart.
i. The Open of a Fresh Candle
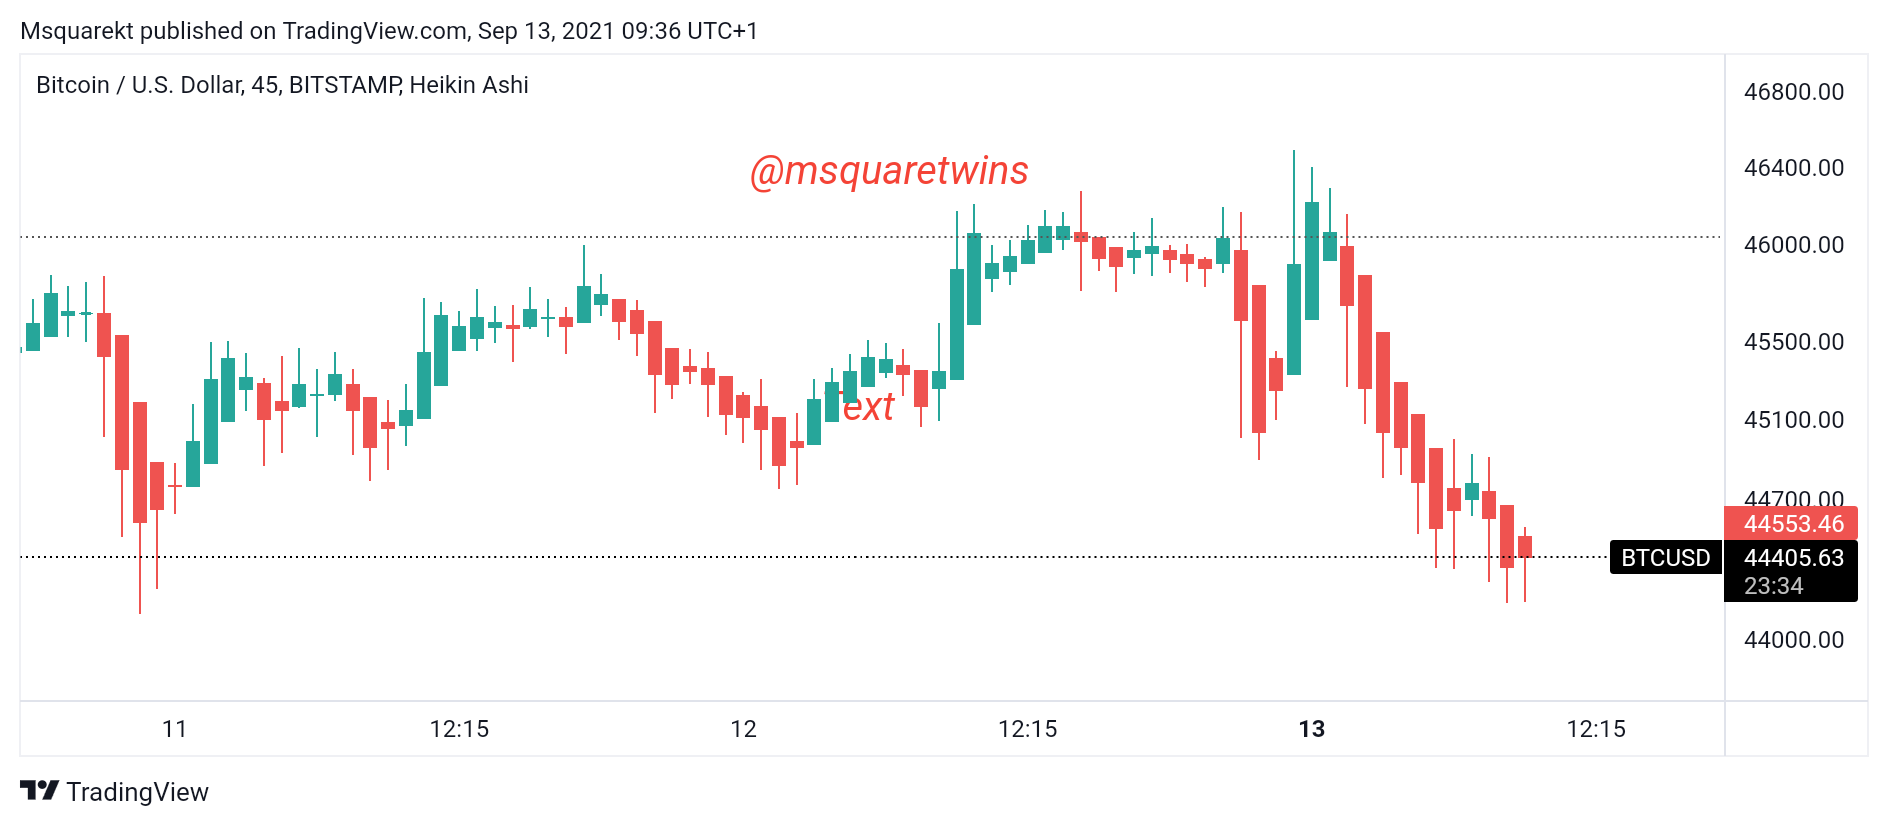
The opening of a fresh candle always open at the middle of the previous one in Heikin Ashi chart. Whereas it is not so in Traditional candlestick chart. The two screenshot below shows both Heikin Ashi and Traditional candlestick chart.
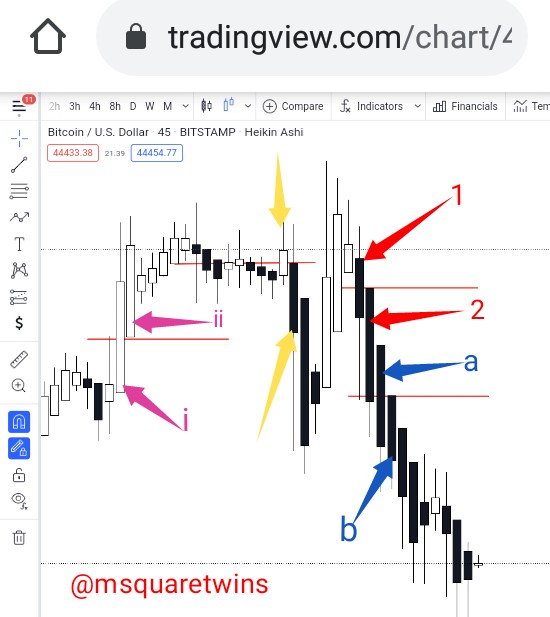
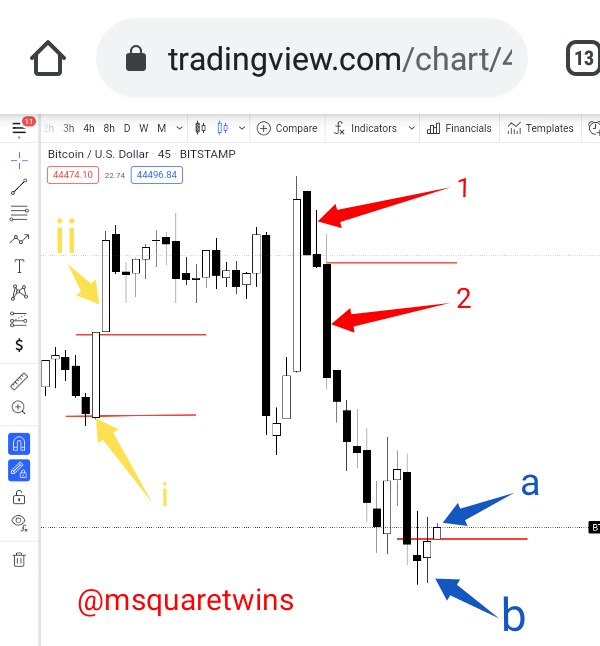
As seen from above screenshot, the red arrow 1 is the previous candle to the red arrow 2. Note that candle 2 open at the middle of the previous candle 1. The same is seen in candle a and b, and candle i & ii as indicated by blue and magenta arrows respectively. But the open of candles in Traditional candlestick do not follow this order as seen in the right screenshot.
ii. Noise and Smoothness of Chart
Heiken-Ashi chart removes or reduces noises attributed to price. Whereas, noises in Traditional candlestick chart are many. Check the two screenshot below for more clarity
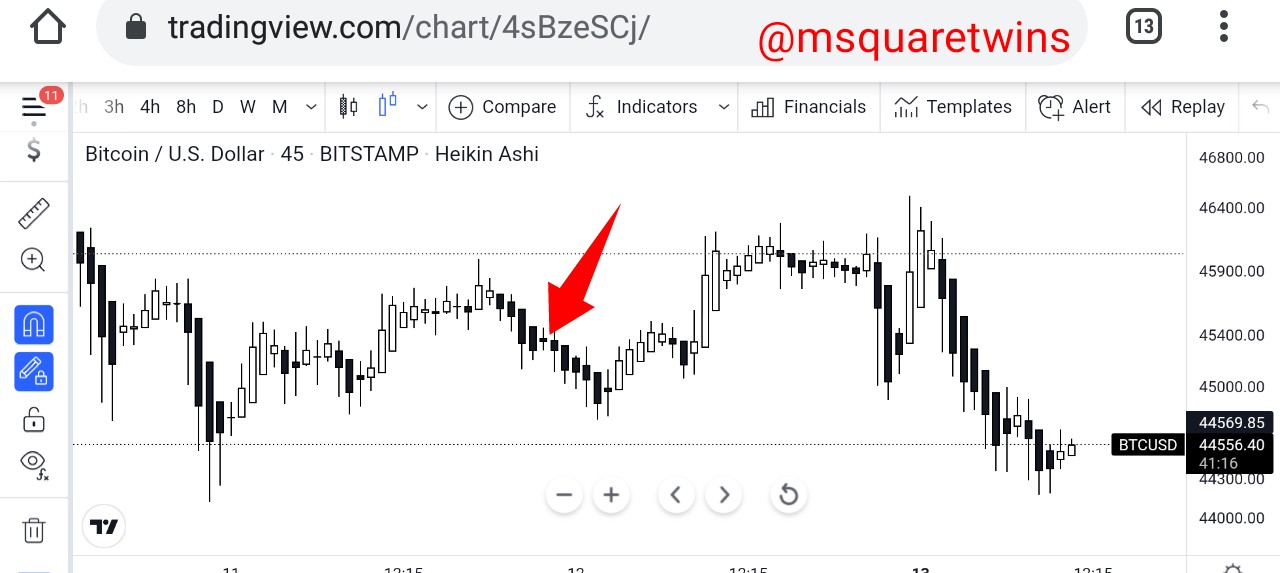
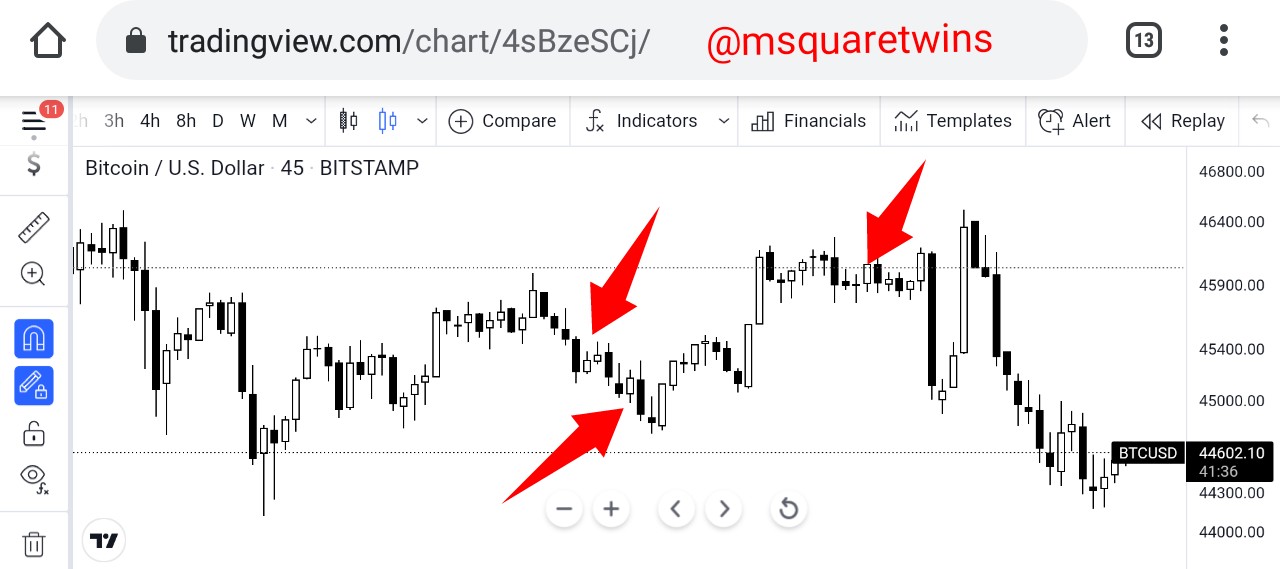
The arrow in the right screenshot shows noises that are generated in the candlestick chart. The corresponding chart is shown in the left screenshot. As seen in the left screenshot, which is Heiken -Ashi chart, the noises are total reduced.
Additionally, the graph of Heikin-Ashi appear smoother than that of traditionally candlestick chart.
iii Easy of Direction
It is easy to detect the direction of an asset with Heikin-Ashi than with traditional candlestick chart. Check the two screenshots below for more clarity.
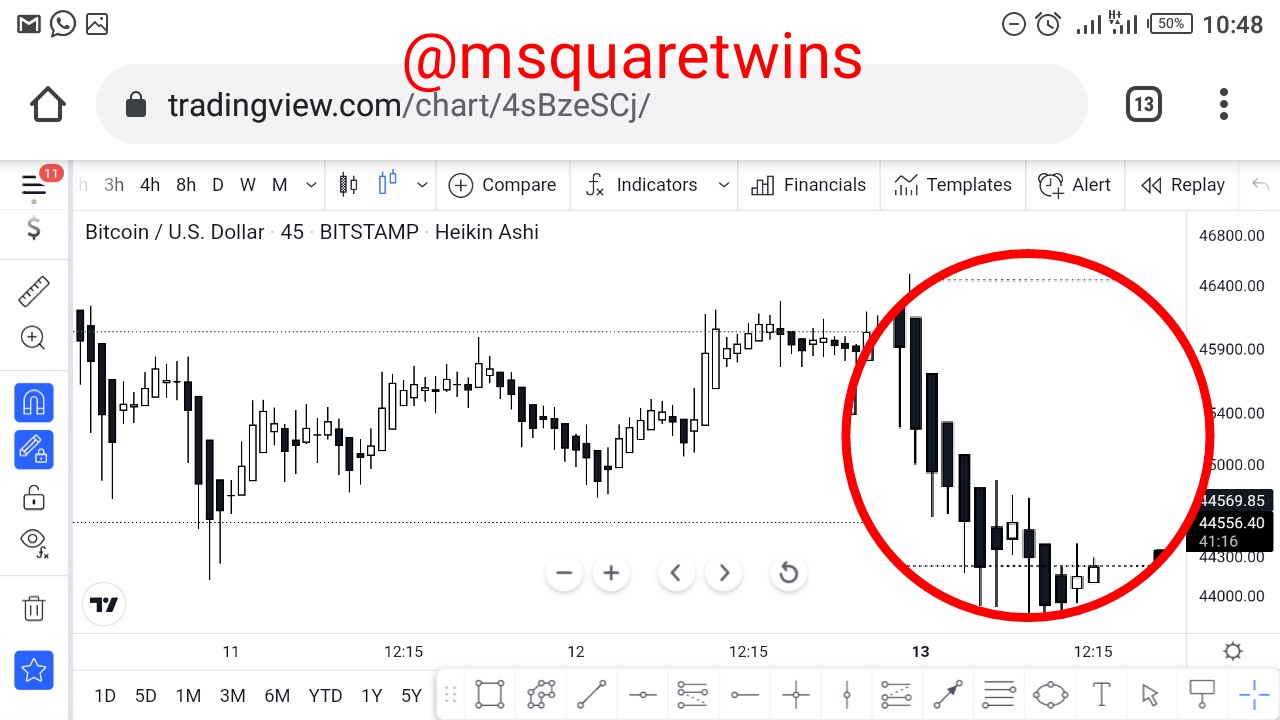
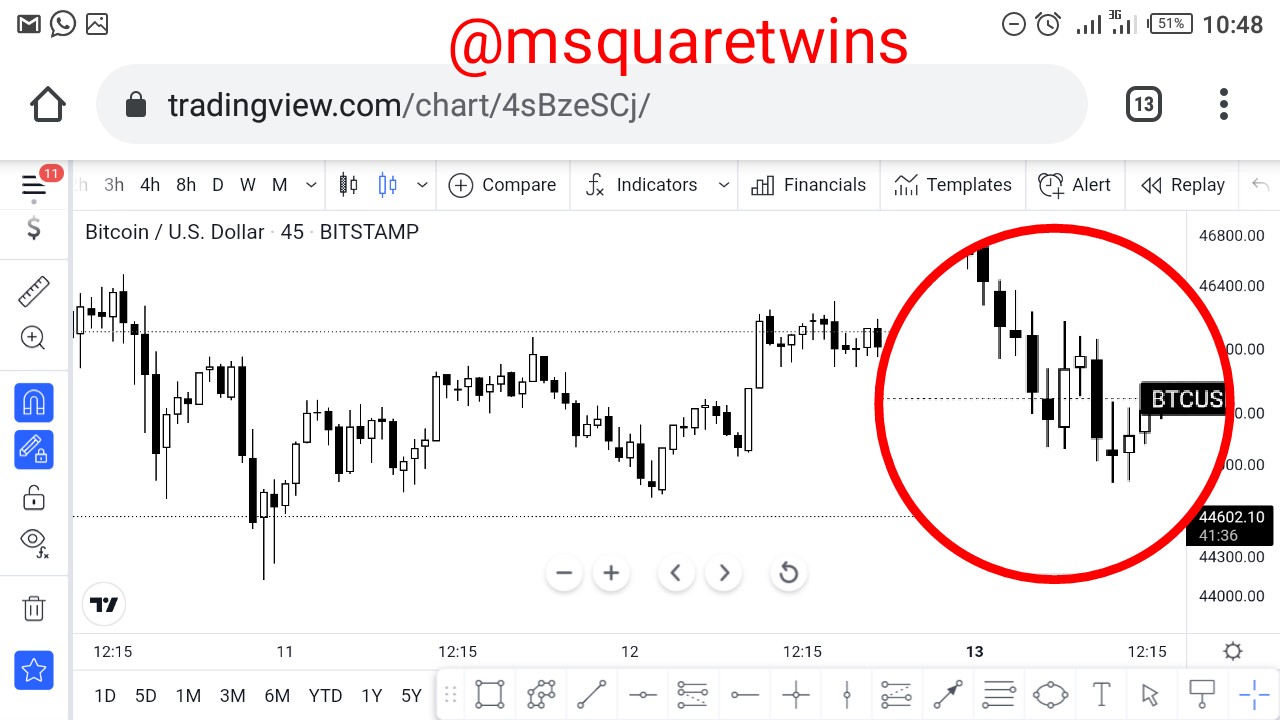
The first screenshot shows a spot highlighted on a chart with Heikin-Ashi candlestick and the second screenshot shows the same chart and the same area highlighted by a red circle in the first screenshot. As seen from these two screenshot, we can conclude that Heikin-Ashi has good ability to detect clear trend than Traditional candleatick chart.
iv. Colour of candles
The colour of candles in Heikin-Ashi is not affected by a slight change in market whereas the slightest change of price affect the colour of candles in Traditional candlestick.
3. Explain the Heikin-Ashi Formula. (In addition to simply stating the formula, you should provide a clear explanation about the calculation)
Heikin-Ashi like Traditional candlestick pattern use open, close, low and high of a previous candle to calculate the next candle. The explanation of this is given below.
Calculation of Open
Mathematically, open of a next candle in Heikin-Ashi chaty is calculated thus;
Open = (Open of a previous candle + close of a previous candle)/2
This means that the open of a previous candle is added to the close of the previous candle and the result is then divided by two. This indicate that the open of a next candle is always the mid point of the body of previous candle.
Let's see the screenshot below for clear explanation.
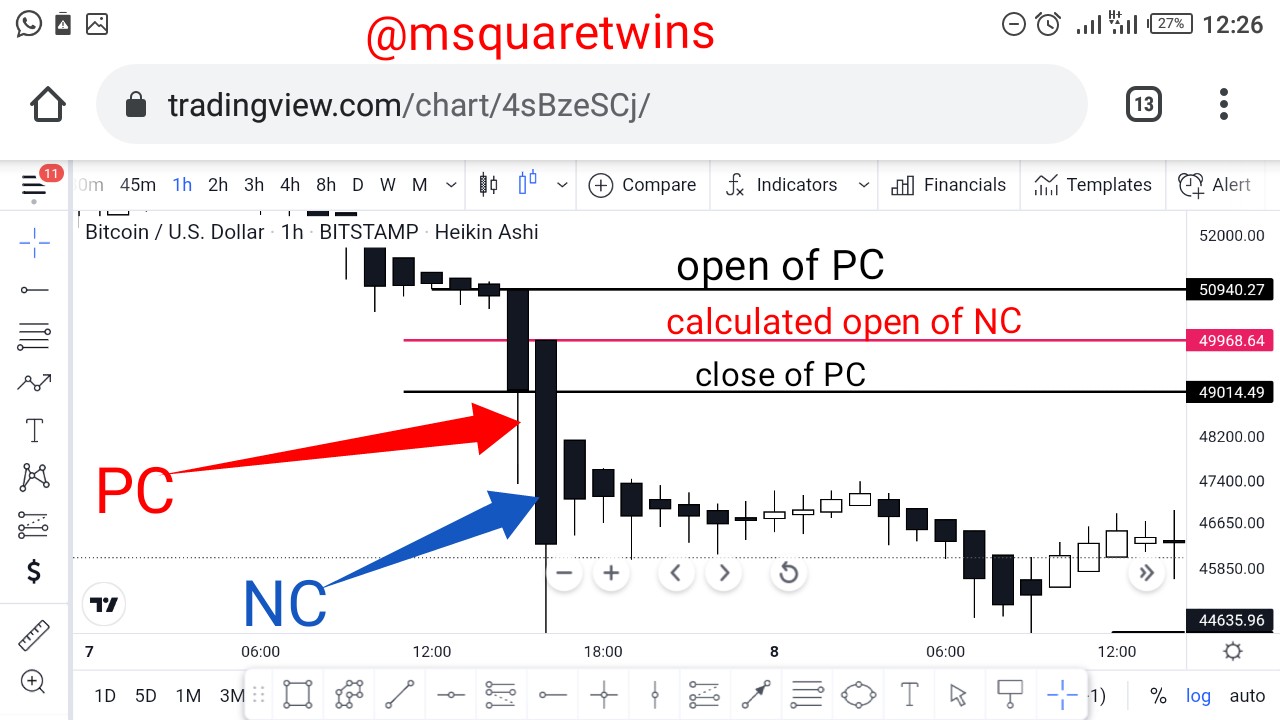
The screenshot above is the Heikin chart of BTCUSD. The candle indicated as "PC" which is also indicated by a red arrow is the previous candle. The open price of this candle is $50940.27 and close price is 49014.49. To get the open price of "NC"(Next candle) in the screenshot above, we divide the open and close price of PC by two. Therefore we have;
Open of NC = ($50,940.27+$49,014.49)/2
= $49,977.38 which equivalent to the open of NC in the screenshot above.
Calculation of close
The close of a candle is calculated by dividing open, close, high and low of a current candle by four.
Mathematically, it can be written as;
Close = (Open + Close +High + Low of current candle)/4
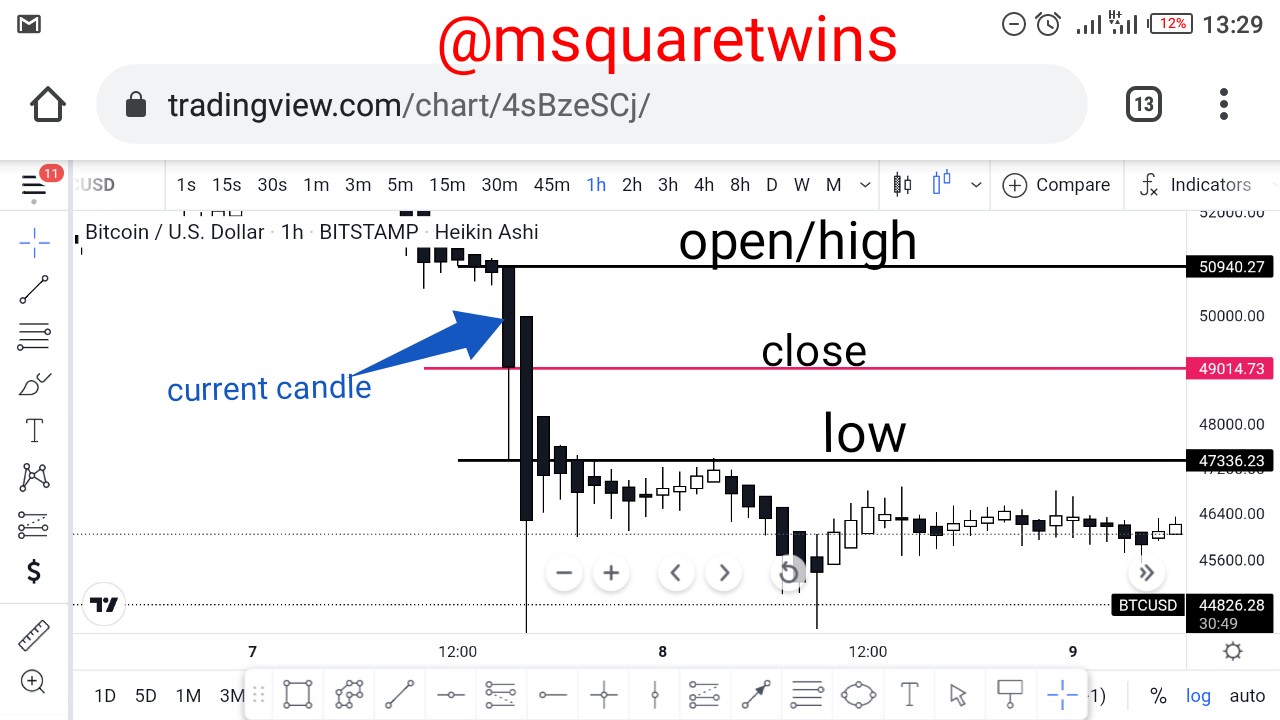
Let's assume we want to calculate close for the candle labeled as current candle in the screenshot above. Its open, high, close and low has been highlighted with their corresponding price at the right side of the screenshot.
There close is calculated thus;
Close = ($50,940.27 + $49,014.74 + 50,940.27 + $47,336.23)/4 = $49,571.28
Calculation of High
The high of a candle in Heikin-Ashi chart is calculated by dutifully noting the value of high, open and close of a current candle and then selecting the Maximum value between these data as the high.
Mathematically,
High = Max value among (High, Open or Close)
The highest value among the three data is taken as the high.
Calculation of Low
The low of candle in Heikin Chart is calculated by determining the minimum value among low, open and close of a current candle.
Mathematically,
Low = Min value among ( Low, open, close)
That is, Out of the three data in the bracket above, the minimum value is taken as the low.
4- Graphically explain trends and buying opportunities through Heikin-Ashi Candles. (Screenshots required)
Heikin-Ashi candles are often used by traders to detect the trend of an asset because of how they appear on a chart. Let's see the screenhot below
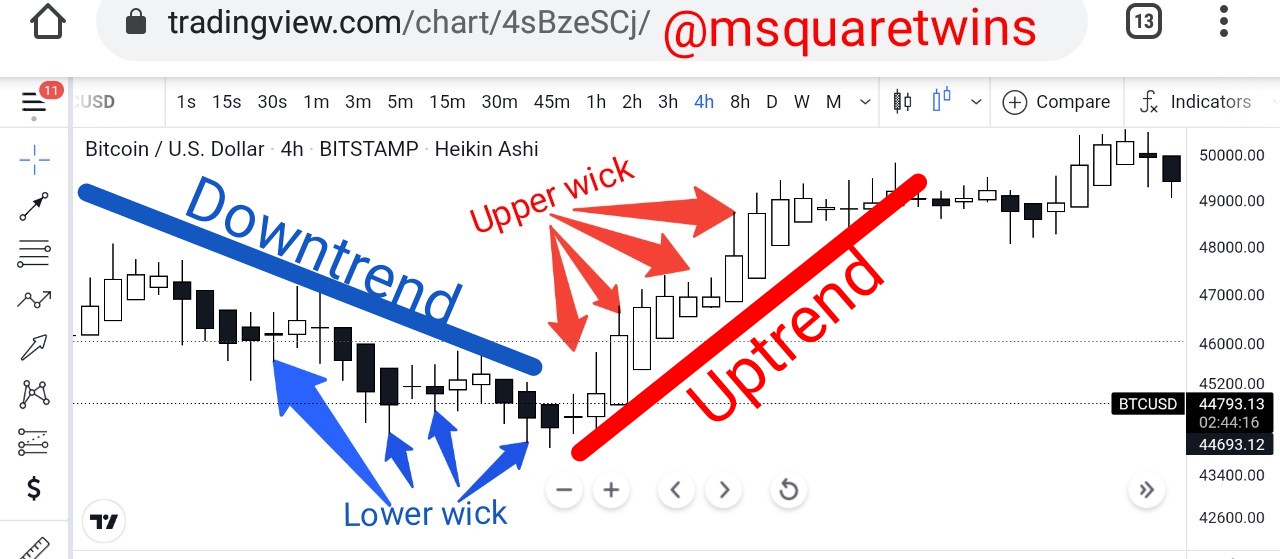
Note that in the screenshot above, as marked by red arrows, the wicks appear above the buy candles and the market is seen in a bullish direction. Also when the wick appear below the candles as indicated by blue arrows, the market move greatly in the bearish direction. In short, the market is said to be in uptrend when the wicks consistently appear above the candle and when the wicks are below the candle, it is said to be on in a downtrend.
Also, buying and selling opportunities can be spotted in the Heikin-Ashi trading technique.
Below is the screenshot that vividly explain the buying oppprtunity through the Heikin-Ashi chart.
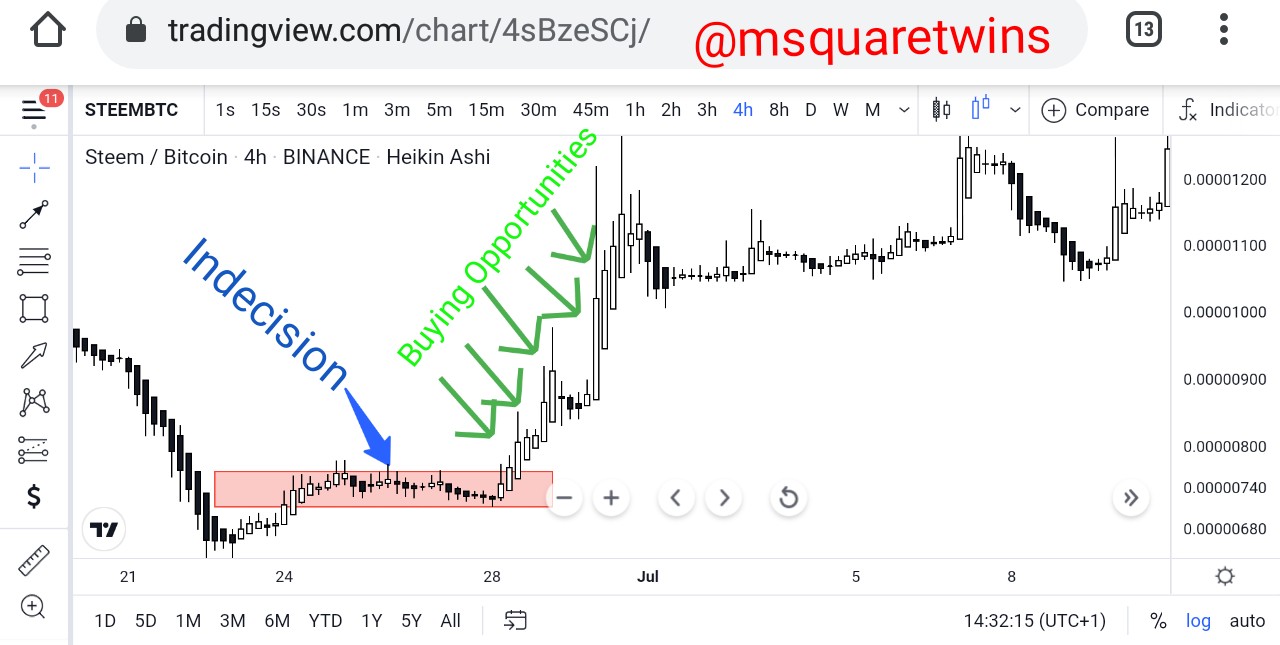
The strategy used for both buying and selling opportunities is very simple. Traders lool for a place where there is indecision in market for some time and then wait for market to get clear direction and the take position to either buy or sell. For instance, in the screenshot above, STEEMBTC has been trading indecisively for some time in the portion highlighted by a faint red box which is indicated as indecision. During this period, STEEMBTC didn't get clear direction, both buyers and sellers were dragging the price of this asset up and down.
Then around the end of June, a buy candle open with a great wick above. This indicate buy opportunity. The next candle also open with great wick above, a trader who has mastered this strategy would have enter at the formation of second buy candle. The market later bought massively upward. In short, if market has experience indecision for some time and a clear bullish candle with strong upper wick appear, it may indicate a buy signal. Similarly, if a clear bearish candle appear for a market that has been trading indecisively, it may signify a sell signal.
5- Is it possible to transact only with signals received using the Heikin-Ashi Technique? Explain the reasons for your answer.
To me, I will say it is not possible to transact with signal received using Heikin-Ashi because of behaviour of price in market. The signal that is often use to take trade in Heikin-Ashi may fail because of market behaviour. No strategy is 100% effective in trading. And No technique is used in isolation. Therefore for effectiveness and for more accuracy, more indicators should be used alongside the trade signal from Heikin Ashi.
Also, bearing in mind that cryptocurrency is a volatile market that can change in price anyhow, it is therefore always good to combine one or more strategies/indicator for more accuracy.
6- By using a Demo account, perform both Buy and Sell orders using Heikin-Ashi+ 55 EMA+21 EMA.
Let's first see the sell order below
Sell Order of ETHUSD
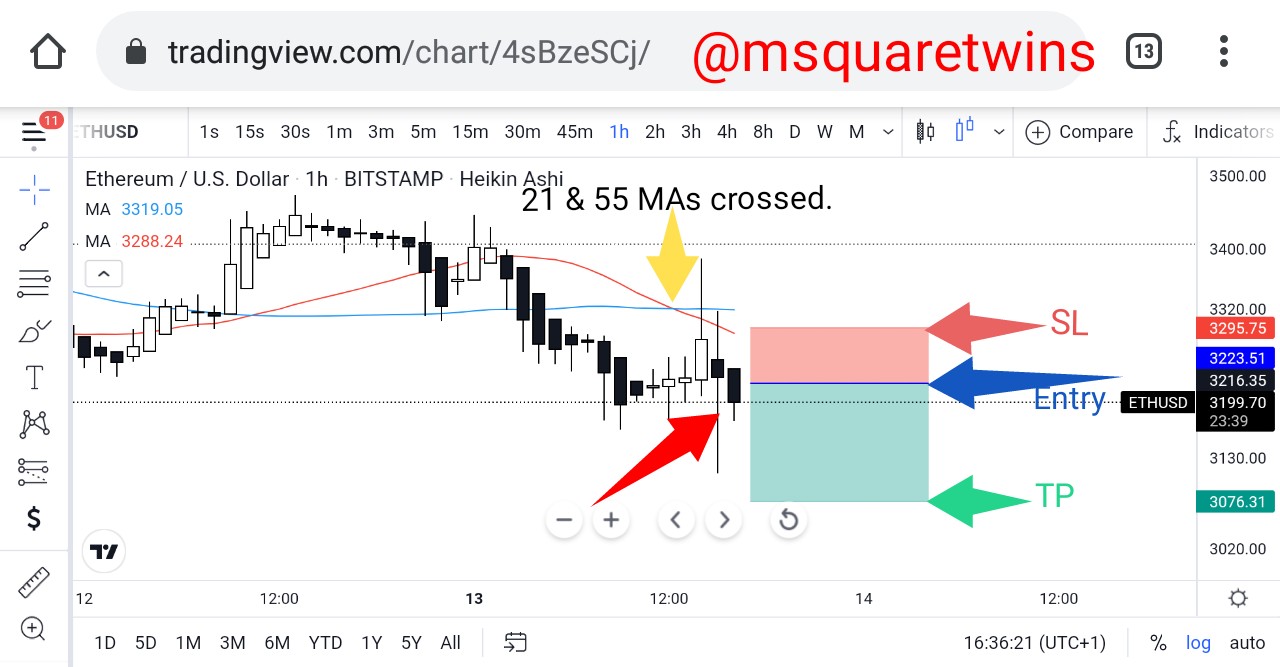
• The market has been moving on a downtrend for a while. The it moves up for certain period and the 21 and 55 MAs crossed each other as indicated by a yellow arrow in the screenshot above. Not long after this, a bearish formed and I capitalized on that to take my trade. The short order is analyzed in the screenshot.
• Then. I went straight to MT4 APP Tto take my order.
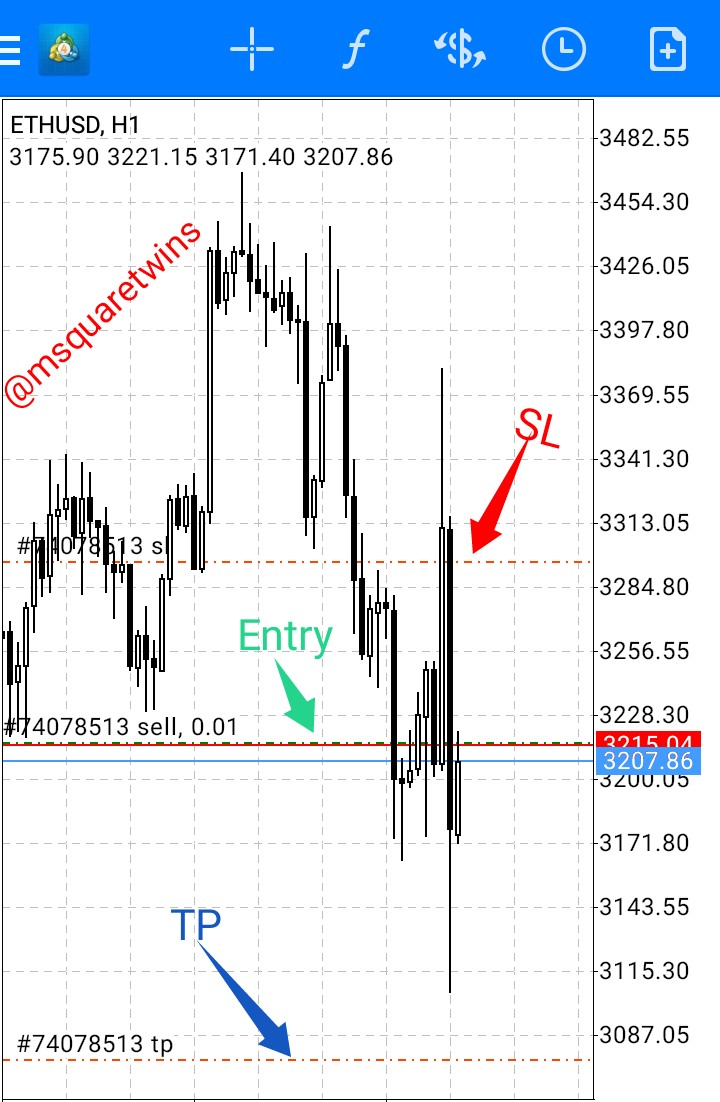
• The first screenshot shows the ETHUSD order chart. The SL which is the stop loss is indicated by a red arrow, the TP(Take Profit) is ondicated in the screenshot by a blue arrow and the entry point is indicated by a green arrow.
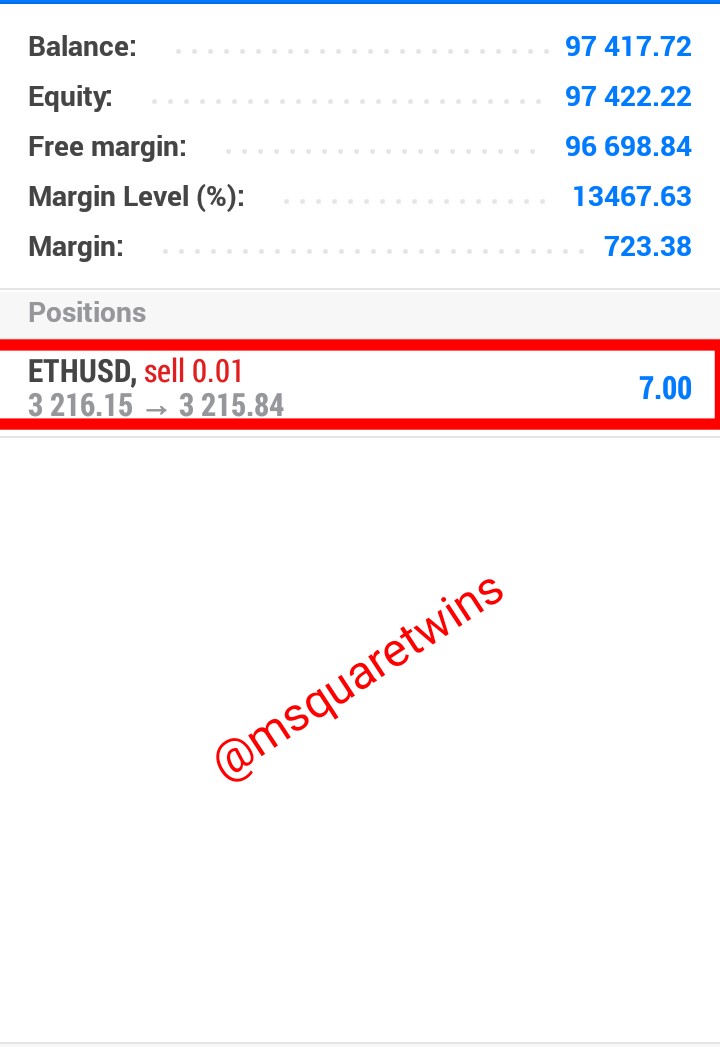
• The right screenshot shows the ETHUSD running order as indicated by a red arrow.
Buy Order of DOGEUSD
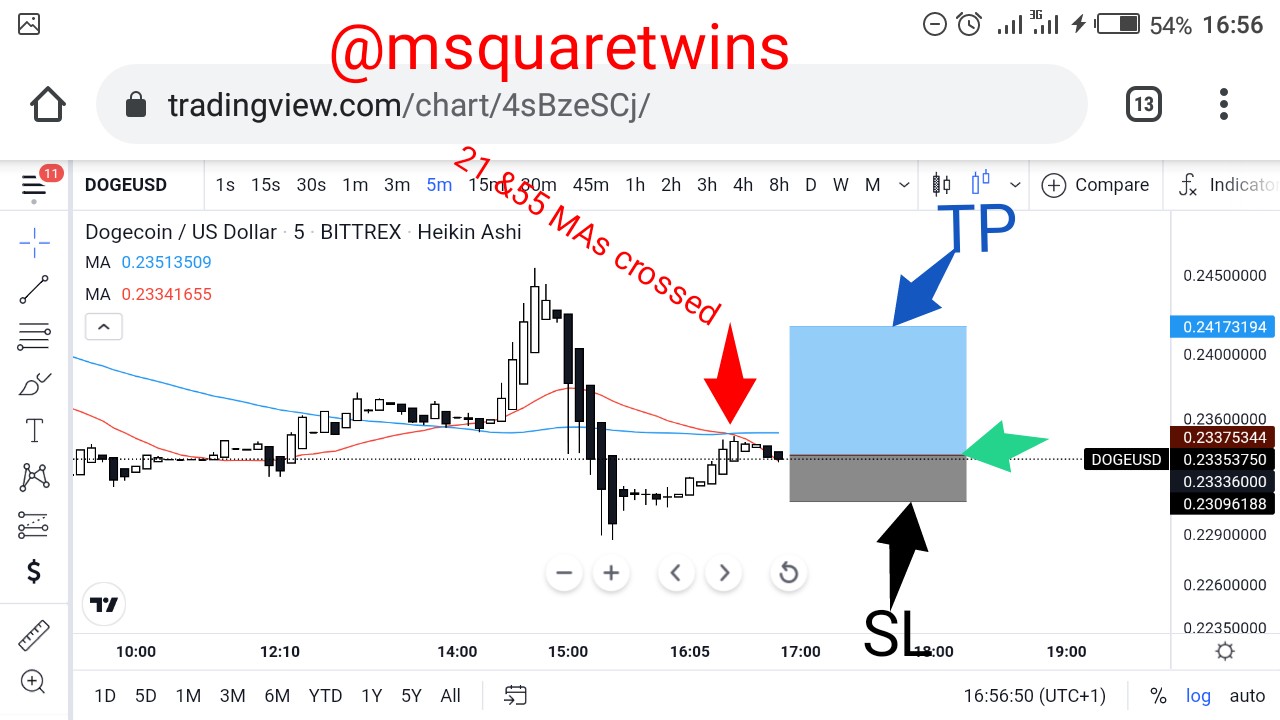
• DOGEUSD has been on a downtrend for some time. Then market traded for some time without clear direction. After this, market is seen to have change direction but the two MAs have not cross each other so we wait till we see the crossing. The two MAs crossed at a point indicated by a red arrow we then initiated the buy order as seen in the screenshot above.
• The next screenshots show the order on MT4
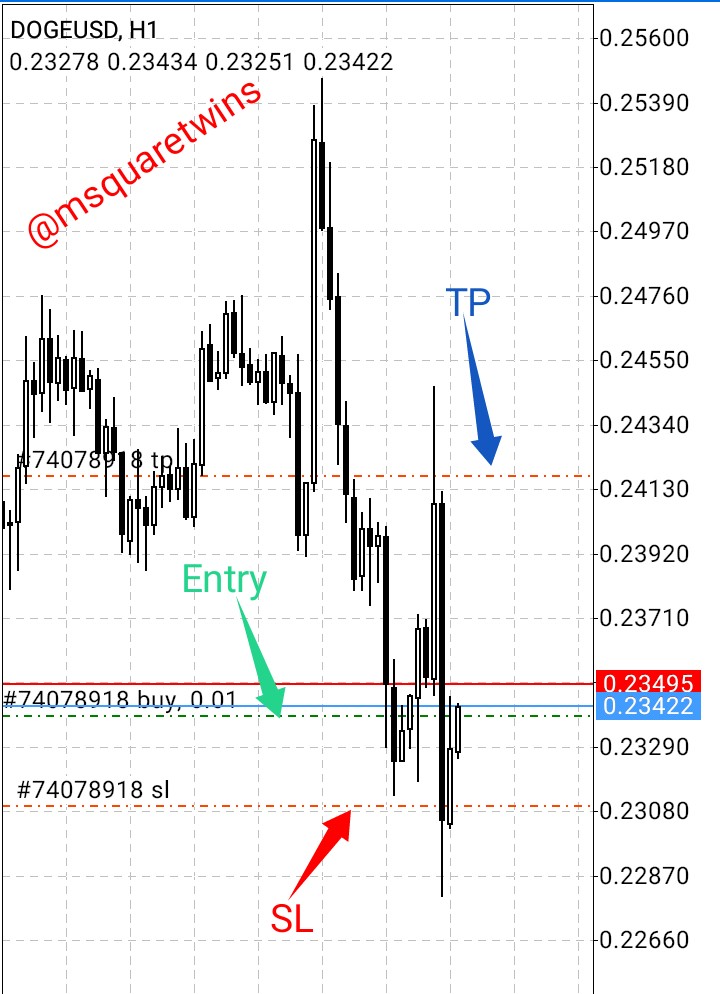
• The first screenshot shows the DOGEUSD order on MT4 chart. The entry point is indicated by a green arrow, SL is indicated by red arrow and TP is indicated by a blue arrow.
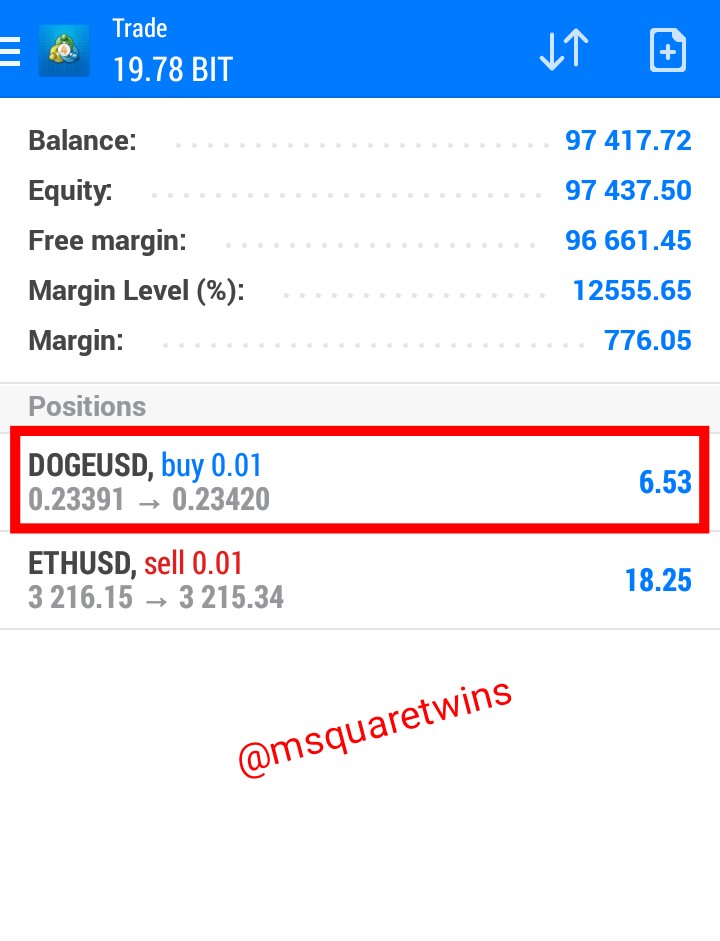
• The second screenshot shows the running order as indicated by a red box.
Conclusion
Heikin-Ashi technique is great strategy that can help traders to know the direction of an asset at a particular period of time. Apart from this, it is also a great technique to determine both the entry and exit points of a trade.
Noting that no indicator or strategy is 100% efficicent, It is advisable to use this great technique with other strategy or indicators for effectiveness and accuracy in market. This will increase the chances of wining as compared to when the technique is used in isolation.
Special thanks to professor @reddileep for this wonderful teaching. It was an eye opening.
Thank you for reading.
Written by : @msquaretwins
Cc: @reddileep