Crypto Trading Strategy with Triangular Moving Average (TRIMA) Indicator - Crypto Academy / S6W4 - Homework Post for @fredquantum
Hello everyone, today I'll be discussing another moving average indication. This is a moving average indication that is well-known for its excellent performance since it is based on calculations that employ the simpler Simple moving average indicator. The answers to the questions in this exercise are derived from professor @fredquantum's understanding of the course.
.jpg)

1.What is your understanding of the TRIMA indicator?
The TRIMA indicator is one of the moving average indicators developed to address issues with the original moving average indicator. The Exponentially Moving Average Indicator, Sanded smooth Moving Average, Triple Exponentially Moving Average, and TRIMA are some of the latest moving average signals that are addressing the issue of lagging.
The Simple Moving Average indicator highlights the foundations of moving average indicators and serves as the foundation for comprehending the TRIMA. The Simple moving average is based on the price movement's average values. The Simple Moving Average appears as a line on the price chart, tracking the oscillation and the price as it changes over time. The TRIMA has the same behaviour. On the price chart, the TRIMA produces a line that tracks the price oscillation through time. The TRIMA is designed to give a smoothed version of the Simple Moving Average while avoiding noise and misleading signals in the price movement. This permits the TRIMA to respond to price movements more slowly, providing the signal greater precision than that of the original Simple moving average.
The TRIMA gives a twofold smoothed average of an asset's price, which is presented on the price chart. With such smoothing capability, the TRIMA can prevent providing misleading signals in extremely volatile markets by slowing down the expected rapid reaction of moving average indications such as with the Simple moving average. We can use the TRIMA to create a more accurate version of our Simple moving average, which can help us avoid lagging and discover trends in our charts. On the cryptocurrency price chart, this indication may be used to spot entry and exit positions.
Important aspects of the TRIMA indicator
1)- To avoid misleading signals, it double-averages the values of assets over a certain time period.
2)- It's ideal for conjunction with some other signals, especially when daily trading take downs.
3)- TRIMA clearly identifies trends, indicating when a trend is in progress or has concluded.
4)- The TRIMA indicator avoids delivering erroneous information by not reacting quickly to market volatility.
2.Setup a crypto chart with TRIMA. How is the calculation of TRIMA done? Give an illustration. (Screenshots required).
Adding and setting up a TRIMA on a chart
To use this indicator (TRIMA) on a bitcoin chart, first open a trading platform and add the TRIMA indicator to the chart. I'll walk you through the procedure in simple stages down below. In this experiment, I will use https://www.tradingview.com/, a prominent trading platform.
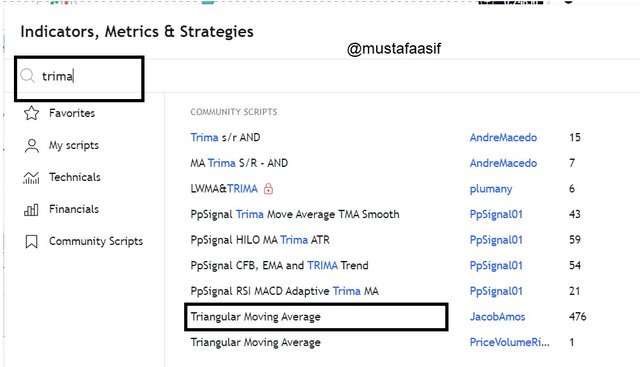
To add the TRIMA indication to my chart using this platform, I'll go to the chart page, click on "Indicators," and then put Triangular Moving Average into the search field. When this is complete, I just click on the name of my indication that shows. If we like, we may add the indication more than once. At this point, I'll have to adjust my indicator settings to fit my analysis. Here, I'll modify the length from the customized length of 9 to my chosen length of 20 for this scenario. The two screenshots will clearly clarify these prices.
Calculation of TRIMA
As I noted in the beginning to the TRIMA indication, we now know that it acts similarly to the SMA calculations, with the exception that it offers a double-average of the price over a given time period. Because the TRIMA is a double smoothed version of the SMA, its formula will have the SMA inside it. The SMA is expressed here, along with how it contributes to the TRIMA computations.
The expression of SMA is given by;
SMA= (P1 + P2 + P3 + P4 + P5... + Pn)/n
Where P1 to P5 represent the prices of our asset at the different times, "Pn" represents the price of our asset at the most recent period, and "n" represents the total number of periods utilised.
We may now look for the TRIMA using the aforementioned SMA. Remembering that the SMA is a component of the TRIMA and should be included in the TRIMA indicator formula owing to the functioning of both.
The expression of the TRIMA indicator is given by;
TRIMA= (SMA1 + SMA2 + SMA3 + SMA4 + SMA5... + SMAn)/n
Because we started working with P1 to P5, I've utilized SMA1 to SMA5. To make it easier to read, the TRIMA might be written as;
TRIMA= sum(SMAs)/n
The term "SMAs" refers to the sum of all the SMA values for the various time periods.
3.Identify uptrend and downtrend market conditions using TRIMA on separate charts.
The TRIMA indicator, like most moving average indicators, is used to identify trends. The length of the TRIMA might make the identification of the pattern more evident while also making it more difficult to read and analyze. If the time ok for which the indicator is set is made very little, the indicator line will move very near to the price, making it much more difficult to see the market price from of the TRIMA line, making trend detection very tough. To overcome this difficult problem, increase the time such that the TRIMA travels below or above the price, providing the trader a clear perspective of the trend.
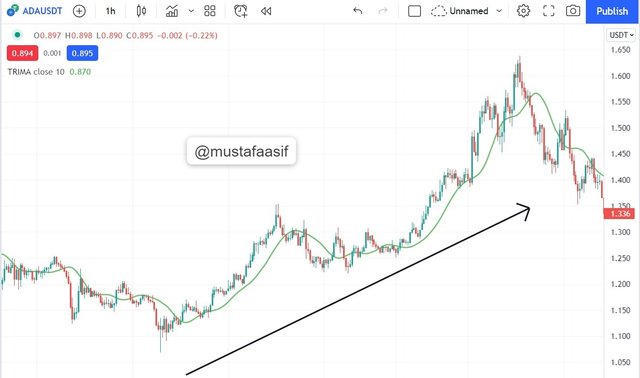
When the price is in an uptrend, the TRIMA will be below the price, highlighting the distance it maintains from the price.
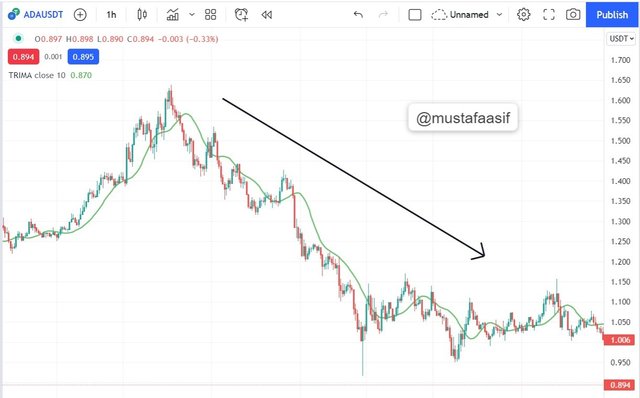
In a decline, the price trades below the TRIMA indicator, and the difference between the two is plainly visible until the trend weakens.
While trading trends, the TRIMA indicator may be a highly valuable trading tool. When the TRIMA indication dips higher to the point where it cuts through into the price, a bearish market structure is formed, and the converse is true for a bullish market formation.
4.With your knowledge of dynamic support and resistance, show TRIMA acting like one. And show TRIMA movement in a consolidating market. (Screenshots required).
TRIMA in a consolidation market
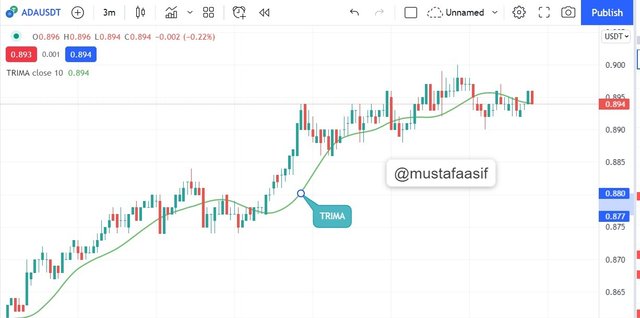
During a market consolidation period, the TRIMA indicator may be a highly useful tool for tracking such market moves. Price accumulation occurs when the price trades inside a specific price range, forming resistance and support levels. In such markets, the TRIMA indication is visible inside the price, causing the price to swing on the TRIMA over time. This means that the bulls and bears have relatively similar velocity, and none has a significant advantage over the other.
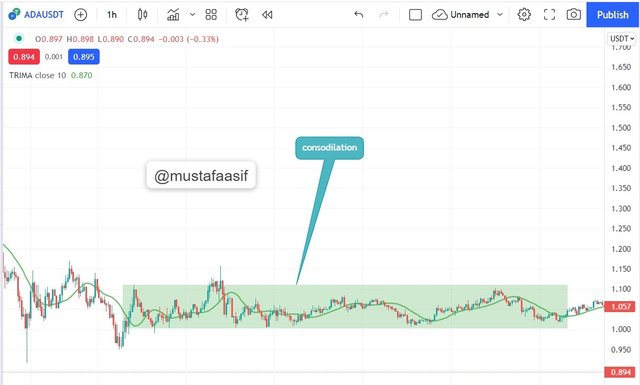
The ADAUSDT price trades in a range and crosses the TRIMA upward and downward in an oscillation, as shown in the above screenshot. Before the consolidation, there was a downtrend, and after the consolidation, there was an upswing, indicating that the bears lost their power while the bulls took over the market.
TRIMA as dynamic support/resistance
The TRIMA indicator, like the other moving average indicators, acts as a dynamic support/resistance detecting tool. When we notice the TRIMA indicator getting price bounces at most spots, we can determine a support or a resistance. When the TRIMA indicator drops below the price, suggesting an uptrend, the price will most likely trade and hit the TRIMA line before rebounding, and this point will establish a support level. When the TRIMA moves above the price chart, suggesting a bearish trend, the price strikes the TRIMA from below and returns to the bottom. This position serves as the market's resistance line.
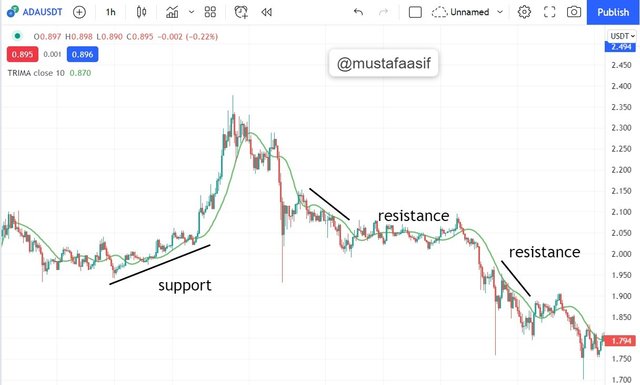
From the above chart, we can observe that the dynamically supports (in red) and dynamically opposition (in green) occur on the TRIMA with price action.
5.Combine two TRIMAs and indicate how to identify buy/sell positions through crossovers. Note: Use another period combination other than the one used in the lecture, explain your choice of the period. (Screenshots required).
Similarly to how we can use two exponentially weighted moving averages to analyze crossover possibilities on a price chart, we can use two TRIMA to understand crossover signals. Because of the TRIMA indicator's potential to be sluggish to respond to extreme market volatility, it has slowed to the point where it may not always offer alerts quickly. To address this, we must use a multi TRIMA indication with at least two TRIMA on our chart.
The two TRIMAs must be in distinct periods so that they can move apart on the price chart and avoid chart confusion. I'll be using a 15-period and a 30-period TRIMA for this workout. When both TRIMAs cross, we have entry and exit signals, which may be used to create trade exit and entrance criteria. I'll go over the crossover but and crossover sell scenarios.
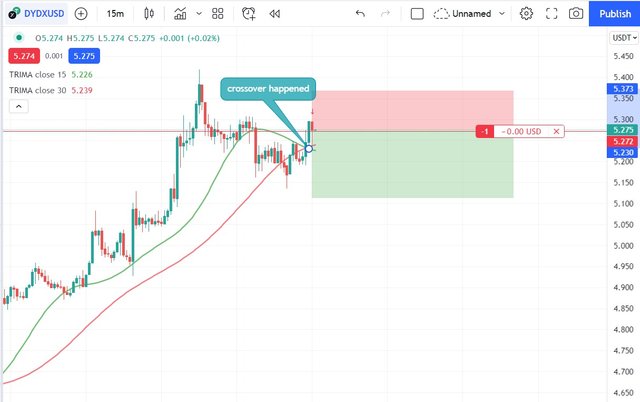
Buy Crossover
The upper period TRIMA being above the price action and below the lower period TRIMA for a "Buy" crossing. This indicates that when the smaller period TRIMA crosses over the bigger period TRIMA, we get a purchase signal and a bullish market.
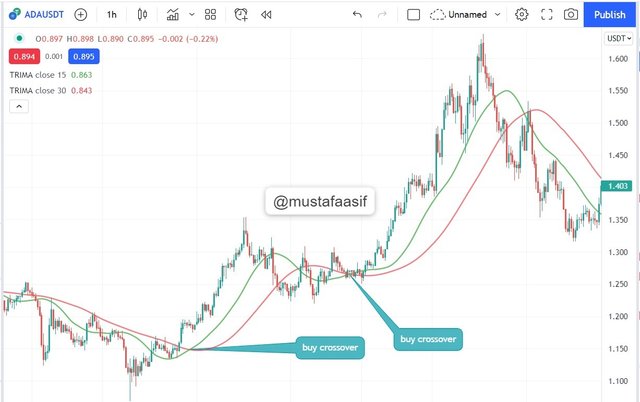
We can see how the TRIMA on the ADAUSDT trading pair provided a buy signal following the crossing of the shorter period TRIMA (TRIMA 15) into the upside. This occurs twice on the above chart, therefore the purchasing signal is a continuation of the prior one.
Sell Crossover
The shorter period TRIMA crosses the greater period TRIMA and moves below the price in the case of the sell crossover on the price chart. This occurs to pave the way for a bearish trend.
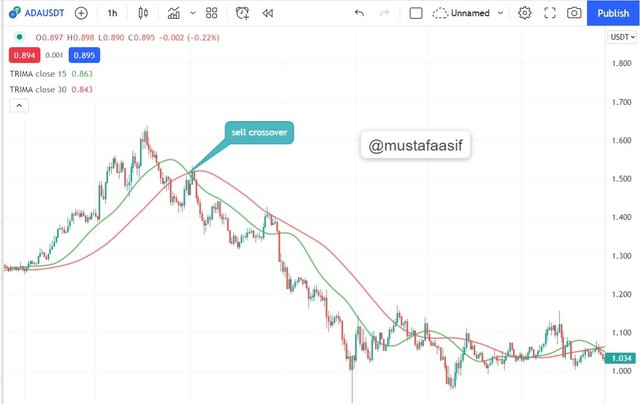
We can see in the image above how the bigger period TRIMA (TRIMA 30) crosses over the smaller period, suggesting a sell signal that travelled a long distance down the trend.
6.What are the conditions that must be satisfied to trade reversals using TRIMA combining RSI? Show the chart analysis. What other momentum indicators can be used to confirm TRIMA crossovers? Show examples on the chart. (Screenshots required).
In the same way that we use other moving average indicators in conjunction with other filter indicators, most of which are momentum indicators, we can also use the TRIMA in conjunction with other indicators. Because the TRIMA is calculated in such a way that it reacts slowly to market volatility, another indication, such as the RSI, will aid in signal detection while the TRIMA takes its time to offer and validate the signal from the RSI indicator. In this situation, we use the two TRIMA methods in conjunction with the RSI indicator to clarify the signal.
We can consider the following conditions or criteria for trading with two TRIMA and an RSI indicator in place for a bullish reversal market.
The two TRIMAs, as well as the RSI, should be included to the chart.
During a downtrend, we must wait for the RSI to approach the oversold level before looking for a reversal signal.
3). The smaller period TRIMA must cross over the bigger period TRIMA to indicate an upward reversal. Following this crossing, we must wait for at least two candlesticks to appear on the trend side's upper side.
4). The stop loss for the exit criterion should be set close below the immediate dynamic support. The take profit may be calculated using a risk-reward ratio of 1:2, which means that you can only benefit from a trade if you make nearly double as much as you are willing to lose.
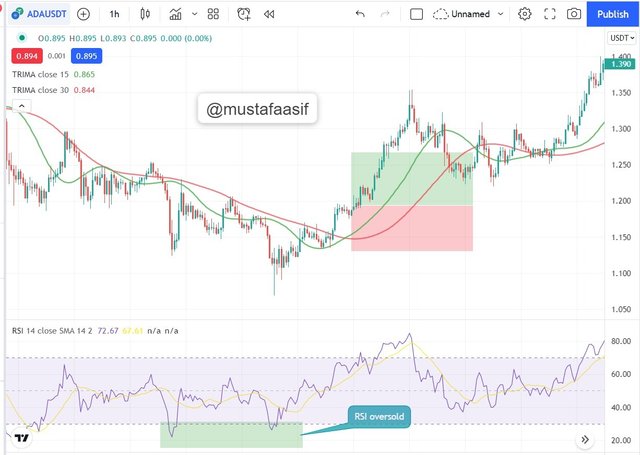
The RSI indicator displayed oversold signs in our chart above, indicating a positive reversal. The crossover of the smaller TRIMA to the upside confirmed the reversal. The stop loss and take profit levels are set at a risk-reward ratio of 1:2.
For a bearish reversal market, we may evaluate the following circumstances or requirements for trading with two TRIMA and an RSI indicator in place.
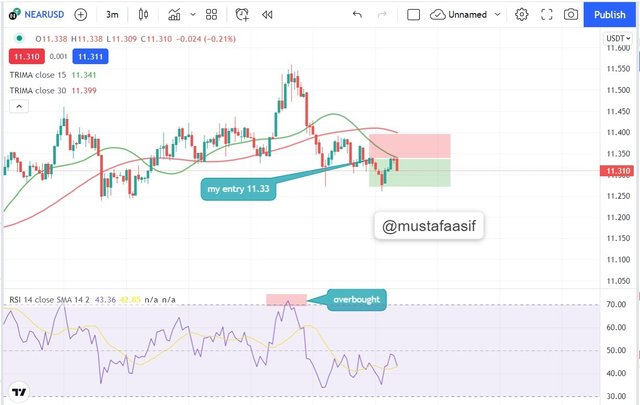
1). During an upswing, we look for the RSI to enter the overbought zone in order to anticipate a bearish reversal.
- To the downside, the smaller period TRIMA must cross the bigger period TRIMA. This implies that the bigger period TRIMA line must cross the smaller period TRIMA line. After this occurs, we must wait for at least two candlesticks to develop below the crossing.
3). We set a stop loss slightly above the immediate dynamic resistance and a take profit two times our stop loss, resulting in a risk-reward ratio of 2:1.
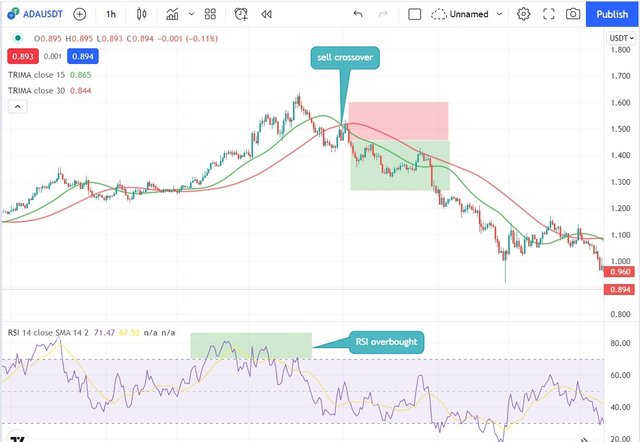
Looking at the screenshot above, we can see that the RSI confirms the overbought level, indicating a bearish reversal. The TRIMA indicator confirms this, since the bigger period TRIMA crosses the smaller TRIMA. An Optus entry is observed, and a risk-reward ratio of 1:2 is chosen so that the stop loss is just above the current support.
MACD
Moving Average Convergence Divergence can also be used with the TRIMA indication.
Whenever the oscillations bars just on MACD are over the graph 0 line, the market is bullish; if there are well below the zero line, the marketplace is bearish. We have just a solid entry signal when the MACD and the TRIMA offer the same signal or when they agree on a given trend.
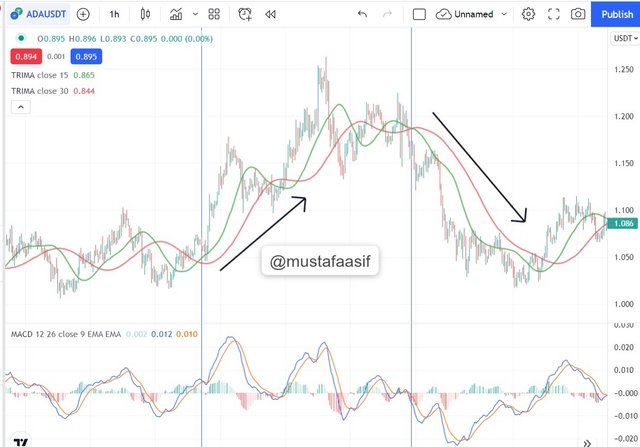
The preceding screenshot shows that the MACD is trading just above zero line, and the TRIMA indicator indicated that it is a crossover of the smaller period TRIMA over the bigger period TRIMA. We have a downward possibility in the others area with both the red arrow on the screenshot, which was verified by the MACD as it goes underneath the zero line and the TRIMA of higher period crosses the TRIMA of lesser duration.
7.Place a Demo and Real trade using the TRIMA reversal trading strategy (combine RSI). Ideally, bullish and bearish reversals. Utilize lower time frames with proper risk management. (Screenshots required).
sell (demo trade)
On the above chart, the price was in a declining trend. Then we added two TRIMAs, one with a 15-foot length and one with a 30-foot length. When long length TRIMA crosses short length TRIMA and begins to move downward, purchase signals are generated, signaling a bearish trend. We may now put a sell order because the trend has altered.

The RSI is over 70 bars and in the overbought zone in the screen photo below. TRIMA should be considered as well. To be bearish, the long TRIMA must surpass the short TRIMA and continue to rise. This shows that the bullish trend has given way to a bearish trend. After both prerequisites have been satisfied, we can place the sell order.

8.What are the advantages and disadvantages of TRIMA Indicator?
| Advantages | Disadvantages |
|---|---|
| That can be used in conjunction with those other signals. | On turbulent markets, it might be sluggish to detect dramatic changes. |
| A double-smoothed averaged of an asset is provided. | Before usage, the device must be properly configured. |
| Indications from of the price chart are simple to read. | Bot is useful when used independently since it may provide indications later than when the market has already made significant moves in the desired direction. |
| Excellent for identifying trends. | Signals are frequently issued after the market has closed. |
| Can best recognize dynamic degrees of support and resistance. |
CONCLUSION
The TRIMA indicator is a moving average indicator that shows the trader the double-smoothed average of an asset of interest over time. This indication eliminates the lagging issue that appears to be widespread with the SMA indicator. The TRIMA indicator may be a very valuable tool in technical analysis after recognizing patterns on the price chart. This indicator may be used to generate buy/sell signals when two TRIMAs of various periods are applied to a certain price chart in such a way that the two TRIMAs cross each other from time to time, providing buy and sell signals as well as exit criteria. We may create a highly good exit criteria by using the fluid support/resistance that somehow this indication tool displays.
Although the TRIMA indicator's positive characteristics, it is also useful when used in conjunction with those other filter signals like the RSI and other movement indications.
#fredquantum-s6week4 #cryptoacademy #club75 #pakistan #trima-indicator #steemexclusive #crypto