PHYSIOLOGY OF TREND CYCLES/CRYPTO ACADEMY S6W4/HOME-WORK POST FOR @REMINISCENCE01.
Trading crypto currencies is quite volatile; you require specialists to teach you the fundamentals until you can fully exploit the turbulent market. Many thanks to this fantastic platform; trust me, we have got a lot of knowledge on how to trade properly.
For me, trading is the act of purchasing and selling in order to generate profits. Profits are the essential term here on—like our regular food stuffs market trader's out there buys goods in large quantities, sells at a reasonable price, and in the end profits are maximized.
However, there are drawbacks to trading cryptocurrencies because the market in general is quite volatile, so you must be cautious. Many analyses are carried out primarily via the use of charts and patterns (technical analysis), and as a result of this, we will analyze the father of technical indicators, Dow theory.


Explain your Understanding of the Dow Jones Theory. Do you think Dow Jones Theory is Important in technical analysis?
Technical analysis is the study of line charts, and the father of this none other than Dow Jones, who devised a concept that explicitly asserts that market rate movements have a large influence on the available knowledge of various price fluctuations and trends.
This same method we evaluate cost behavior in technical indicators utilizing graphs was formally perpetuated by Dow in the 1990's, and the methodical approach even now works today. Presently, let's take a gander at value behavior, and technical indicators still think that prior trends are repetitive, which occurs in the market today.
In summary, I feel Dow's theory is amazing since it implies trends; for me, if the market is moving, new trends will undoubtedly emerge, and they have been classified into three aspects, which are as follows.
Primary trends..
intermediate trends and.
Minor trends.
Since Dow Theory discusses technical indicators and the capital sector, I believe we cannot legitimately disregard trends. Let's break down the different patterns for a greater understanding.
Primary Trends.
The prevailing trend depicts the primary motion in the worldwide market overall; we understand what trends exist in the market overall, but the real trends are critical.
Intermediate Trends
This sort of trend is tough to discern since it occurs a long time before the pullback. Trends are highly significant in technical analysis.
Minor Trends.
Minor Trends, like other trends, are quite trustworthy and provide long-lasting effects; when this Trends happens, it may be trusted. Trusted in the sense that it can be proven correct with additional study.
The relevance of dows theory in technical analysis cannot be overstated, especially when it comes to dows belief, which holds that trends can operate as a follow-up to confirm market quantities.
Dow's belief is still very much applicable today, as we all know price goes with trends, and that isn't going to change anytime soon; price and trend will continue to move in a straight line till there is a breakthrough.
With just this theory, traders can easily identify market trends, and when this is done, the trader is bound to maximize high gains in the long term, since when there's so many trends in the market, some Indicators larges behind.
Dows theory, in my opinion, is very highly valued and necessary to our everyday trading operations; yet, what does theory mean in all ramifications continues to occupy centre stage.
In your own words, explain the psychology behind the Accumulation and Distribution phases of the market. (Screenshots required)
As the question requires, I will describe the collection and dispersion stages using screenshots to back up my statements. But first, you need be aware that the market is moving in irregular patterns (circles).
Realistically, the market travels in the very same way all the time, and the structure corresponds to the very same phase; whenever the marketplace is really not stabilizing, they create a sequence of greater and lesser, and so forth.
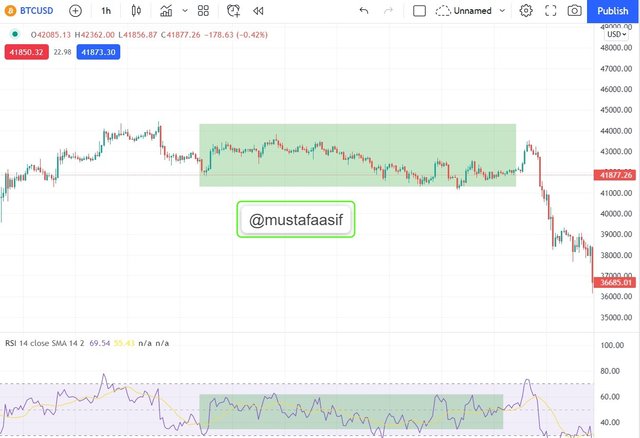
Accumulation phase; the psychology behind such a phase is simple consolidating (range); whenever we see an accumulating process, it implies that the tendency has no defined shape and is therefore filled out in a ranging fashion; please have seen the graph below of the better explanation.
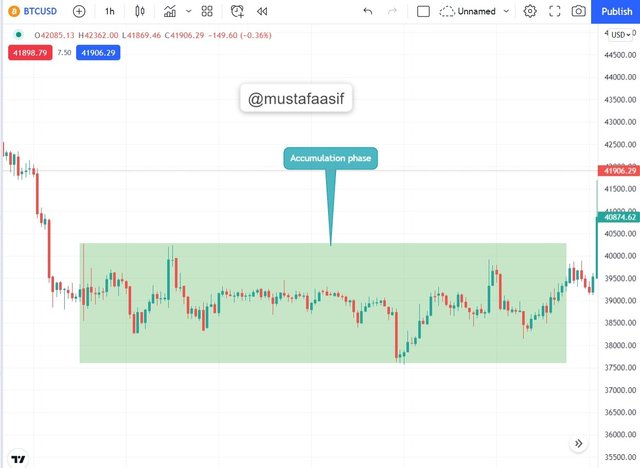
This marketplace consolidating phase, also known as the basing period, is typically observed after the downturn has ended. At this time, sellers have begun collecting their maximum profits from previously placed sell orders.
During accumulation times, indicators frequently give/provide inconsistent signals but there isn't any atom of moving in the market all around until there is a breakout either to the uptrend or downtrend, at which point we can identify the trend based on the forms.
Glancing at the screenshot I supplied, you can see a definite stabilization and a quick tear to the industry's Upswing phase; nevertheless, glancing at the Indicators, the signal it produced was quite contradictory.
For me, I won't put any orders unless I observe a definite pattern in price action, and till I see definite elevated and elevated forms, I won't be responsible for placing any other since patterns haven't really been defined.
Distribution phase; A broad range is a marketplace stage in which the value reaches its maximum peak. At this moment, the marketplace is generating sell choices for different traders; when this occurs, the market formally migrates to another range period.
For me, it makes no difference whether it is accumulation or distribution; the main thing here is the capacity to recognize patterns rather than anticipating the next move; this is technical analysis, not predictive analysis; we should be discussing analysis rather than forecasts.
Spread has a pattern known as the skull and shoulder pattern; if you can recognize this, you're ready to go.
Trust me, this is an extremely unusual head and shoulders pattern, and once this geographical distribution appears, a decline is likely to begin.
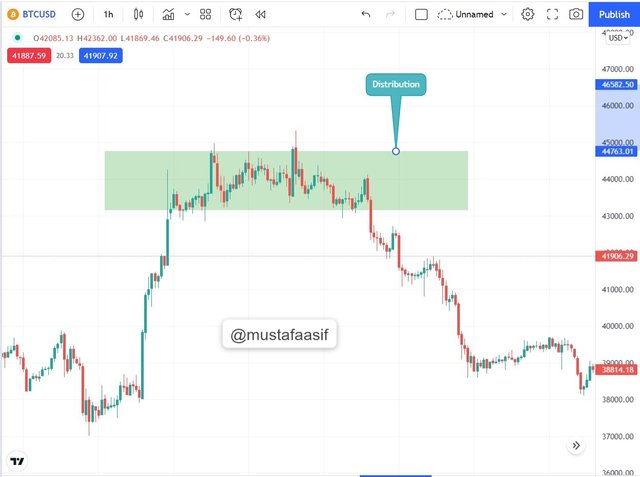
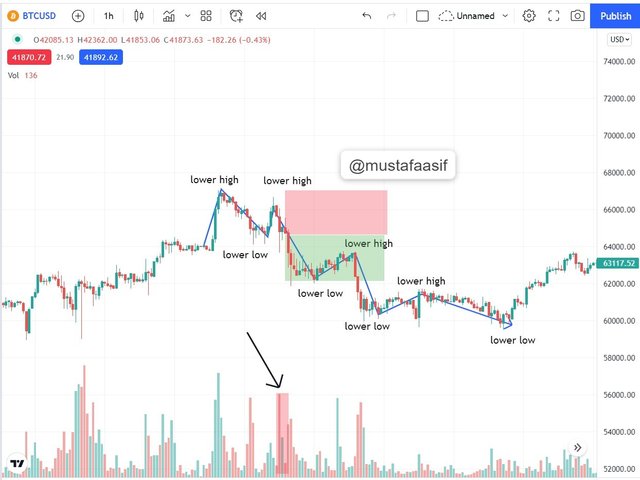
Sellers have an edge at this phase since they are committed to dominating. Looking at the market structure, we can notice a sequence of lower-highs and lower-lows patterns all around, indicating that the market will undoubtedly reverse at some time.
The main tool I generally use to detect distribution phases in the market is the head and shoulder patterns; once this occurs, a decline is imminent. One can rely temporarily on the signal, but I prefer convergence trade all around.
In generally, not only are head and shoulder patterns significant as during delivery process, but there are several additional patterns that may be used to corroborate this phase, such as triple tops.
Explain the 3 phases of the market and how they can be identified on the chart.
I have emphasized the accumulating phase for uptrends and the disposal phase for downtrends; were both formally covered by me, but in this section, I will describe the three market phases, which comprise.
Uptrend
Downtrend and
Sideways.
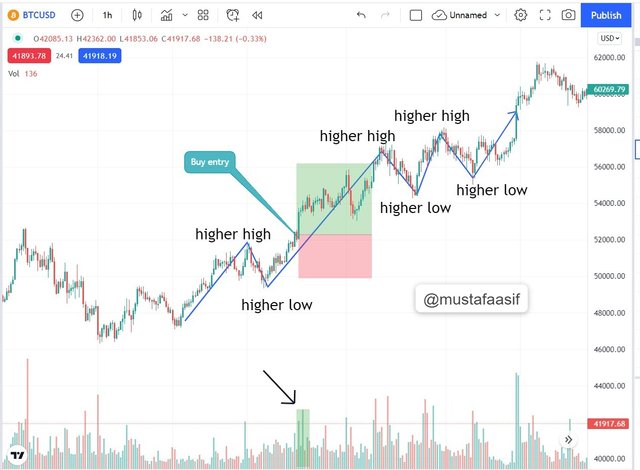
Uptrend; When this occurs in the marketplace, it signifies that there are a succession of escalating higher toughs, and the market as a whole is producing a sequence of higher-highs and higher-lows.
In order to identify this economic period, you may draw a trend line across the point of sliding Lower-highs. The trend-line must be legitimate when the price contacts it numerous times before it is broken.
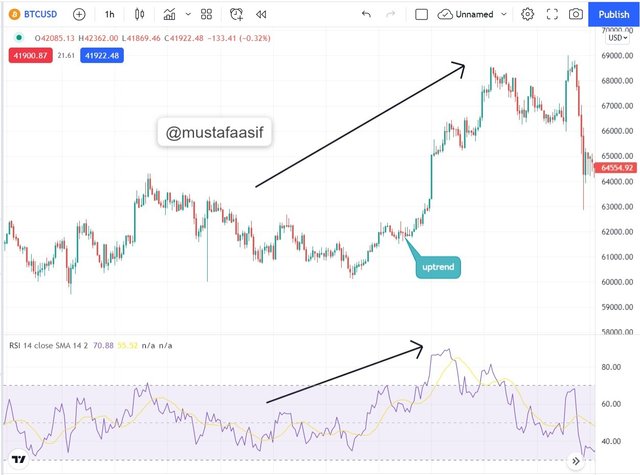
Searching at the chart closely, you will notice a definite bullish phase, with prices generating a succession of higher-highs and higher-lows all around, and it is from the Support level that you should begin looking for purchasing chances.
Responding only on the indicator isn't ideal for me since indicators don't deliver clear signals; instead, they lag and produce a lot of divergence all over the place.
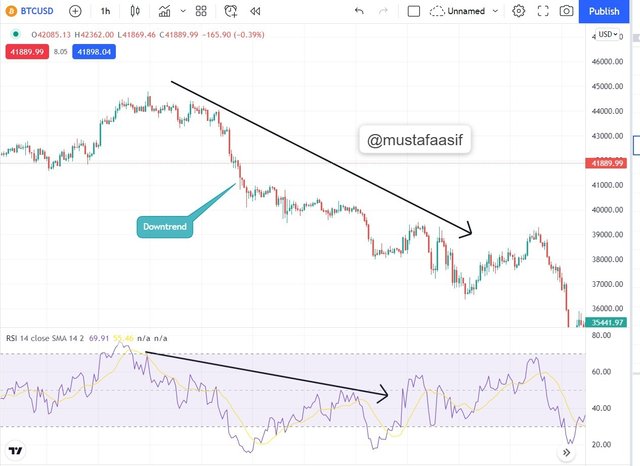
At this stage, a trend-line connects the levels of resistance to the Positive half - cycle, and sellers often take advantage of the resistant step. Looking at the chart, the price continues to build a succession of lower-highs and lower-lows.
For recognizing market phases, I believe that market architecture and pricing movements are the greatest. With something like this, you don't even need any type of indication for price verification all around; all you want is to chart both trend lines.
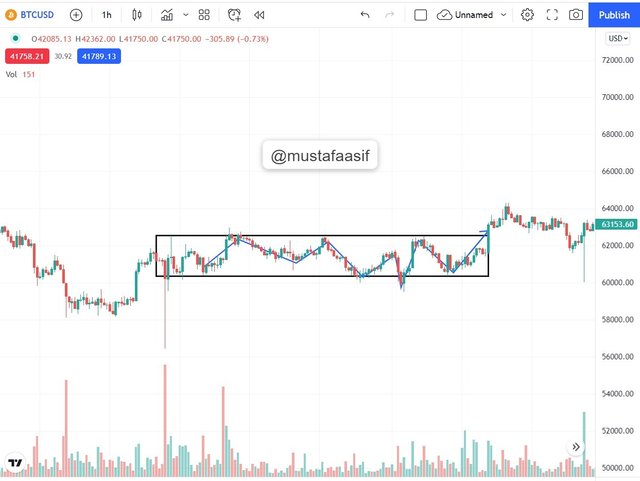
Defining a range or sideways marketplace coincides with a period in which there is a lot of concentration, implying that there is no clear identification as to where the market will head.
When there is range in the market, it suggests that a break-out is imminent, and this break-out might go either way, to the uptrend or to the decline. At this time, the indicator generally lags, presenting contradicting indications overall.
Explain the importance of the Volume indicator. How does volume confirm a trend? Do this for the 3 phases of the market (Screenshots required).
Before we get into the relevance, let's define volume Indicator. Volume Indicator displays how trading Volume varies over time, converging volume Indicator is highly important in crypto trading, volume reveals the strength of a trend.
Volume is quite significant in technical analysis in general, especially when employing an indicator and price actions; here are some takeaways on volume.
Volume may be used to determine the strength of a marketplace over a certain time frame.
When prices fall, volume appears to rise, implying that there is a downward trend.
When the price rises, the quantity appears to fall; at this moment, a reversal may happen.
Volume verifies a pattern through assessing the average number of shares exchanged at a certain timeframe, notifying traders to general market activity. As already said, whenever the market drops, volume is increased, as shown in the chart below.
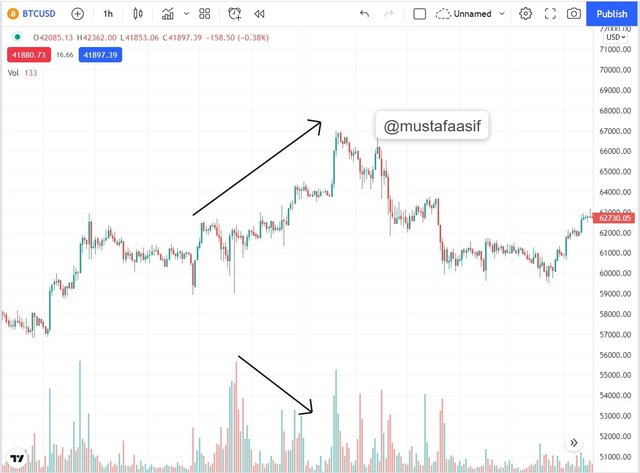
When you witness an increase in volume, it suggests the market is turning bullish, which means there'll be more demand than supply. All you need to do is locate your purchasing position and place your orders.
The type of the volume, whether a gain or reduction, generally gauges the strength of the market through time, offering a comprehensive benefit of the industry's stage at a given moment.
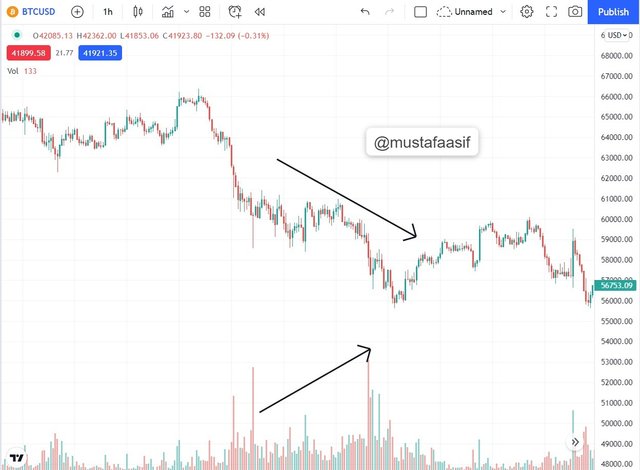
Whenever there is an abnormal enlargement, the economy is anticipated to be on the sell side; at this time, you should be searching for prospective sell positions. The bottom line of all of this research is that quantity determines market trend, whether bullish or bearish.
If you see a range marketplace, the quantity does not really have a specific shape generally, but if you see lesser forms all around, the volume increases, but if you see a range spray, the quantity has no clear shape.
In a volatile market, every indicator employed at the moment appears to be ineffective; the same is true in the case to volume. While trade bands exist, there is also no definite stage as to current market trends till a cut happens.
Explain the trade criteria for the three phases of the market. (show screenshots)
In terms of quantity, one must understand how to place a trade based on sales, which defines direction of the market over a given time interval; one essential trading criterion is the ability to discern different trading points in the marketplace, that are your key resistance levels.
Once you discover your key resistance levels, you will be able choose the next trade you will place based on what quantity is saying you. Let's looking at some significant instances for the three main phases, which are as follows.
Bullish phase.
Bearish phase and.
Ranging/consolidation phase.
Those three stages are critical to any sort of transaction which will be performed out and in terms of Quantity. We all understand what such a positive phase is, which is when the industry is making an upper advance to the resistance level.
For a bullish phase to be verified, various trading criteria must first be considered, such as identifying market patters generally.
Probably wait 2 steps is for marketplace to rise greater before placing a purchase trade from of the Positive half - cycle.
You can choose to cross a trend-line to authenticate the offerings; at the this stage, one can readily predict when reversals will occur.
In terms of quantity, you must keep in mind that as prices rise, volume appears to fall. Let's have a look at the graphic below for a greater grasp.
Reading over the charts in relation to what I previously mentioned, you can clearly understand what it involves to either purchase or sell.
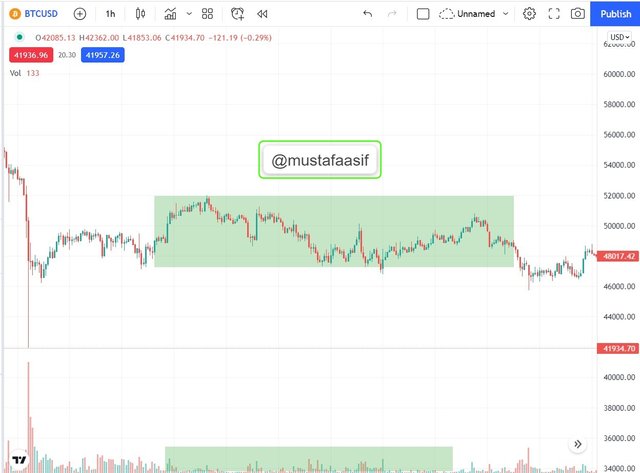
Next, I'll describe trading conditions for a consolidation market, albeit it's tough to map out patterns in this market because it appears to be in equal balance.
The trade stabilization market appears to be in decent shape. What you need to do is understand your support and resistance levels extremely well, and then you'll be good to go in terms about where to buy or sell in general.
However, I like to not play a convergence price up till there is a breakthrough, both to the upswing or downturn stage, at which point I will understand when and how to put my buying and selling orders.
In a ranging market, it's difficult to predict where the market will swing because the changes are generally of comparable size. For a better understanding, please see the screenshot below.
With the Trade criteria discussed in the previous question, open a demo trade for both Buy/ Sell positions.
I addressed the positive stage, bearish phase, and contemplation phase in the original question, and as the question requires, I will initiate a Demo trade in each of the above discussions.
Look for purchasing chances from the Support phase during the bullish phase, as seen in the chart below.
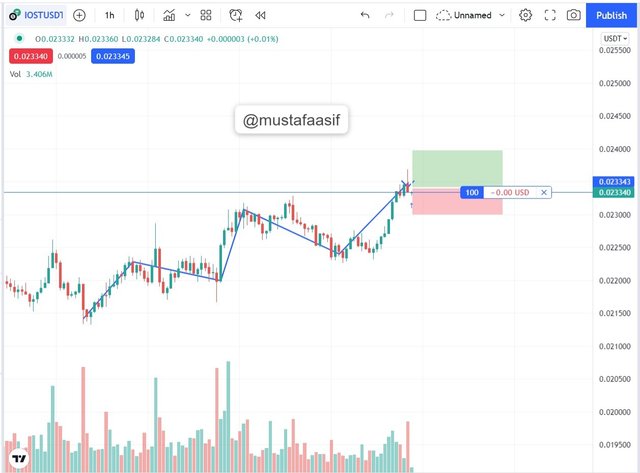
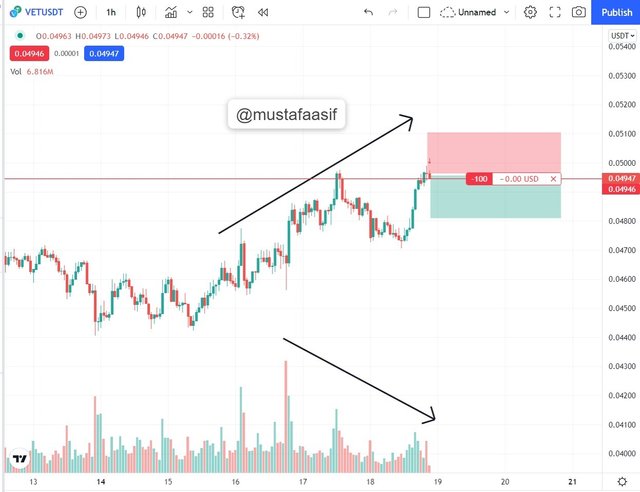
Based on the chart above, you can see that I put a buyout price after seeing a succession of higher-highs and higher-lows formations; the trend is genuine at this point, so I swiftly put my buyout price.
Again for sell order from the resistance phase, I put a bid price knowing full well that the market is on the verge of reversing, and the volume confirmed the veracity of the trend in the market at that time.
After I finished putting my buy and sell orders, I waited for a time to confirm the order outputs, and then the net result appeared, as seen below.
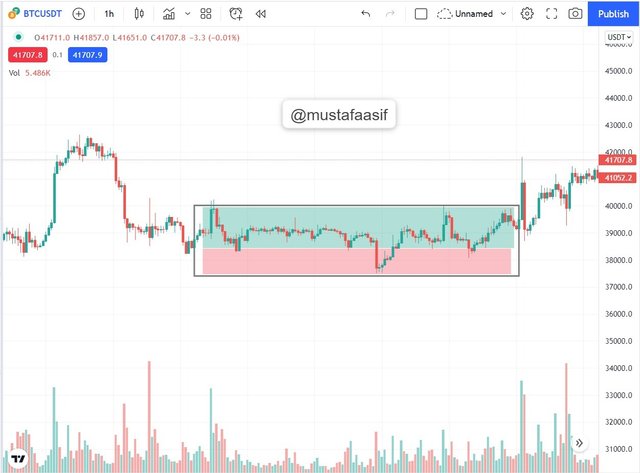
Range market happens when there is no apparent trend these days; as you can see, the price is highly stocked at this time, making trading difficult because there hasn't been any break-out from the Key resistance level.
Let's see how the talk goes thanks to the transaction I made during the contemplation phase. Let's have a look at the results below.

When the marketplace unifies, you'll notice that there are many more losses and more gains on rare occasions, owing to the fact that the trends are quite brief, with no apparent break-out.

After a period of waiting for the many orders I put to materialize, this was my overall net profit, all my transactions were true, and ideally things went as anticipated.
Conclusion
When you compare market movements to dows theory, you will quickly see that actions have a significant influence on the available knowledge on various market motions and patterns.
Lacking trends, the market would not prosper, thus in basic analysis is employed, we search for the examination of numerous chart patterns.
In average, the market goes through three distinct phases: bullish, bearish, and consolidation.
All of these stages are distinguished by distinct market structures and analyses. The various stages cannot be detected without adequate analysis.
I also noted that volume indicates the total number of Assets exchanged in a specific time span, and that as the price rises, volume falls, and vice versa.
Thank you very much, professor @reminiscence01, for this amazing lecture delivered by you. Please keep in mind that all screenshots taken from copyright free sources were indicated.
#reminiscence01-s6week4 #cryptoacademy #club75 #pakistan #steemexclusive
Hello @mustafaasif , I’m glad you participated in the 4th week Season 6 at the Steemit Crypto Academy. Your grades in this Homework task are as follows:
Recommendation / Feedback:
Thank you for submitting your homework task.