Crypto Academy Week 2 Homework Post for @stream4u [India] | How To Read Candlestick Charts In Different Time Frame | @nachomolina
This is my entry to the contest sponsored by @steemitblog
"Steemit Crypto Academy Weekly Update #2 [ February 15th, 2021 ]"
In reply to homework assignment by teacher: @stream4u [India]
I call on all Steemit.com users to join the initiative:
@betzaelcorvo
@juanmolina
@corinadiaz

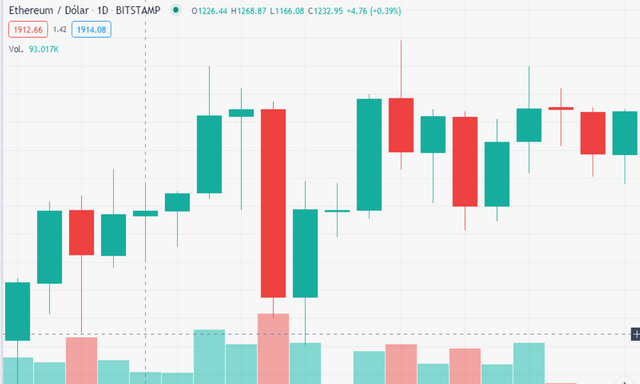
The chart shows the financial behavior of ETH, for February 19, 2021. This will be the digital asset selected to do the present assignment (Tradingview.com).
Introduction
Nothing more interesting to me than the explanation offered by Professor @stream4u:
"Never think against the direction the market is going."
To my thinking, we are here to acquire valuable knowledge and it will be our ability to understand market behavior that will be the only experience that will lead us to make wise decisions.
I think "Winning" in crypto, is all about tracking the market on a given timeline and if we buy crypto in a bullish season.
Maybe, we buy less cryptocurrencies than we expected, but according to the fleeting of the trade we would be managing the possibility of multiplying our investment in a short time and with a certain margin of safety generated by the uptrend, the human behavior and the volume of Tokens in the market.
Cryptocurrency Trading
"That is, the market movement is related to the buying and selling of crypto, which is traded by investors in real time and given the impulsive human condition in the business framework, such volume of digital assets make prices fluctuate for a determined time span which could leave us a profit margin higher than any other market strategy we could apply."
According to my own opinion, it will be the detailed study of the charts, the understanding that we can develop of the market indicators and other statistical data, which can attribute us tenacity and predictive character about the Cryptocurrency and how to take advantage of its volatility.
Different types of traders
Defining to which type of "trader ", could correspond my personal case, is something difficult to say. According to my opinion, people who have little experience in Trading, we usually bet on short term investments.
It is like a way to try our luck with some amount of cryptocurrency we have obtained. Since this is a simple investment, without any consultation or deep study, perhaps, this could create us a misconception about what Trading is really like and its true potential.
"I am personally of the opinion that long-term investments have to be one of the most satisfying, because they allow us to familiarize ourselves with market terms, seek information, advice and even make timely decisions."
On the other hand, the way of trading on the basis of daily or few hours results can lead to profits as well as substantial losses in a short time. However, a trader well prepared in the area of finance and virtual market behavior can develop the ability to make effective, almost instantaneous decisions, thanks to his study and predictive power.
Therefore, I can conclude that each type of trader has a different modality that basically seeks the same purpose "Win", varying only in the procedures carried out to reach that end.
How does a Trader rely on Bullish and Bearish Japanese Candlesticks?
Candlesticks are a statistical tool which accurately identifies the ups and downs of the market. A trader relies on reading these charts to draw conclusions about when to buy or sell crypto. However, it is a detailed process that must be thoroughly understood, as the language used through the charts is complex and 100% technical.

Farrowing chart. Bullish and bearish Japanese candlesticks reflecting ETH/USD behavior for the day February 19, 2021 (Tradingview.com).
What do Green and Red candles mean? How to read them?
A light candle or green candle, indicates the uptrend in a certain time frame, I can see that it has a particular meaning for each type of trader. Thus the short term trader will rely on the 5-15 minute readings in which they can make quick decisions based on their predictive knowledge, they can also look at 30-45 minute ranges to buy. On the other hand, the dark candle or red candle, indicates a bearish period ideal for selling, to which special attention should be paid because when it touches its bottom value, it determines the end of the low and the beginning of the new support cycle or uptrend. You should never think of buying during the down period because you would assume losses.
But for a long term trader will be of real interest readings from one day to one week, onwards, as their trading philosophy is based on longer time spans where the cryptocurrency can fluctuate more significant ranges of value for more leisurely and sustainable investments.
Parts of a Japanese Candle.

Detail of bullish and bearish Japanese Candlesticks noting the high and low prices reached, as well as the opening and closing points on a daily basis (Image created by author).
What are the types of traders in the market? How do they work?
"Technically, the short-term trader relies on short bullish periods, while the long-term trader relies on broader market interpretations, taking into account both bulls and bears, to inform their decision making."
Short-term and long-term traders.
I believe that the Short Term Trader risks his capital in an impulsive manner, whereas a Long Term Trader, is more calculative and relies more on interpreting data over an extended time frame. Perhaps, as a way of investment protection or simply that over time he has been able to develop a more patient attitude where the investment risk becomes somewhat lower and allows him to concentrate on investments of greater financial impact.
Scalping Traders
On the other hand, the Scalping traders, happens to be the most impulsive trader, who does not contemplate any fixed factor of knowledge or technique, basing his investment only on the movement and volatility of market prices in minimum time intervals. Undoubtedly, in search of immediate results.
Based on the above and according to my own opinion, I can say that "Trading" seeks to adapt to any type of investor, taking into account human qualities and their own needs.
What is Support and Resistance? How do they work?
Indeed we must know the precise meaning that indicate the candles which will be our only guide to buy or sell with absolute precision. But there are also other broader aspects that must be taken into account, such as those related to: The buy-sell zones and points, the next possible levels that the market value will reach; according to the information offered by the charts.
Support
The reading reflected by the chart where it becomes possible to buy at the most reasonable price according to the competitiveness of the market, is known as: Buying Zone or Support.
Importance of Support
It is necessary to study the graph to detect the exact point in the history of the currency where it began the last "Sustained Ascent" (Rise), after evaluating for a short period of time to determine that the cryptocurrency repeats the previous behavior, this means, that it is a point of Support and it is the right time to proceed to buy.

Example of how to graph a Support line, what each of its parts mean and how to determine the buy points.

Zoom of the Support chart which allows to see in detail the green and red candles, as well as the days where it is recommended to buy.
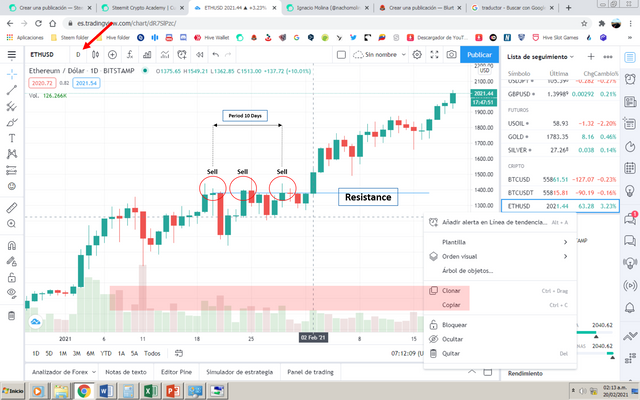
This is an example of support, how to draw it and what meaning each of its parts have. He charted Bullish and Bearish Japanese candles, where he indicated the Ethereum Support from January 10, 2021. During that period the three (03) points that coincide with the Support line were recommended to "Buy" during the 28 following days.
In other words, it is the point where the crypto stops its bearish behavior and starts a bullish behavior that is expected to last for a certain period of time, which indicates that by "Buying" you will obtain safe profits.
Resistance
The Resistance reflected by the chart corresponds to a point where the behavior of the Cryptocurrency will be diametrically opposite to the Support.
Importance of Resistance
That is, after the "Bullish" culminates, the crypto will assume a value of ceiling where its trend will be downward during all that period. Since the value of the currency is falling it is not advisable to buy for any reason, as it will only generate losses until it touches a bottom value, which could be assumed to be the consecutive support that could end the decline and start a new upward cycle.

Example of how to graph a Resistance line, what each of its parts mean and how to determine the sell points.

Zoom of the Resistance chart which allows to see in detail the green and red candles, as well as the days where it is recommended to sell.
This is an example of Resistance, how to draw it and what meaning each of its parts have. He charted Bullish and Bearish Japanese candles, where he indicated the Ethereum Resistance from January 10, 2021. During that period the three (03) points that coincide with the Resistance line were recommended to "Sell".
In other words, when talking about Resistance is the same as saying Bear Market, moment in which it is not recommended to buy since the investment would be irremediably lost.
How to draw a Support and Resistance chart?

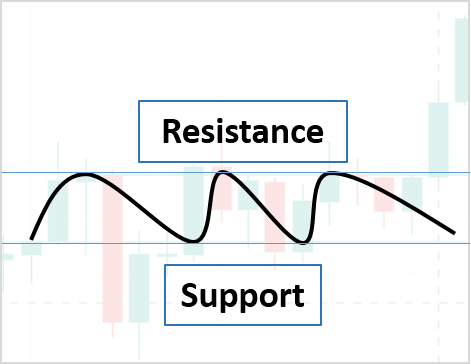
The support and resistance chart has been explained in detail in the previous section. It should be noted that it defines an ascending and descending line in the shape of a "Wave" and for this occasion it is displayed as follows. The background image shows the green and red Japanese candles in "Watermark" mode.
After choosing a chart of a cryptocurrency and configuring it in a certain time interval for Japanese candlesticks (5-15 min is recommended for short term trading and 1 day for long term); then, we will proceed to locate the point where its last bearish behavior culminated and the rise of its value began. From that point, we draw a horizontal line that will represent our Support, to which we will pay attention until it repeats a similar pattern. The moment the chart reaches that value again, it will be time to buy. Similarly we will draw a line at the top of the graph that coincides with the first peak that makes the value of the coin, which will be our Resistance (point where the value of the crypto begins to fall). That line will indicate the points where we must Sell, since the uptrend has culminated where you will have already gained the maximum value that the market will offer for that period. Then you will have to have some patience and continue viewing the graph until you can repeat the same previous Support where you would proceed again to make the purchase order.
How do we determine the recommended levels for Buy-Sell?
The recommended levels for buy-sell, will be those where the chart that we have edited, coincides again in the Support and Resistance points initially established. Whenever the chart touches again those values we should proceed to Buy or Sell respectively, while this does not happen, we must be patient and wait for a new trend cycle.
Buy point
It is the point indicated by the chart where the red candle reaches its last closing value and the uptrend begins. This point we have previously established in our Support and Resistance diagram and every time it repeats we must proceed to buy.
Selling Point
Contrary to the buy point, it refers to the beginning of the downtrend. It is determined by the high closing value of the last Green candle which should coincide with our established Resistance line. Whenever the chart reaches that value we should proceed to sell, because it is the beginning of the downtrend.
When and Where to place a buy order after determining support?
At the moment the chart reaches its lowest level, which we assume to be "Support", we should note the numerical value at which it closed. Then have "PATIENCE " and wait until this numerical value repeats itself identically; only then is it time to place the buy order. This is vitally important, since if we proceed to buy at any other level the data would be uncertain and the results could generate partial or total losses of the invested capital.
There is a characteristic of trading, rather related to a human condition, is the business attitude known as PATIENCE.
This is specifically the quality of knowing how to contain the impulse to buy during any common bullish period which has not been properly analyzed. By the mere fact of seeing a Cryptocurrency in ascending behavior, one should not commit the action of buying impulsively, because one has no idea to which time line it obeys and if perhaps it is about to go down.
- PACIENCE: It consists in waiting for the chart to reach again its Support point, equal to the previous one, the one it had before starting the uptrend that is in progress.
Only in this way can it be predicted that a new upward cycle will begin in which the bullish behavior can be repeated again and having bought right at the Support Point, it could be said that profits will be obtained until the chart indicates it reaches a new peak.
All images were taken from my personal account Tradingview.com:
https://es.tradingview.com/chart/dR7SlPzc/

Hi @nachomolina
Thank You For Showing Your Intrest in Steemit Crypto Academy
You have completed the homework task and made a good post, explained very nicely about How To Read Candlestick Charts In Different Time Frame & Information about Buy-Sell(Support & Resistance).
Remark: Homework Task Completed.
Thank You.
@stream4u
Crypto Professors : Steemit Crypto Academy
#india #affable
Thanks @stream4u!
Published on Twitter:
https://twitter.com/addverso/status/1363037070156066816?s=20
@steemcurator01