Trading with Contractile Diagonals - Crypto Academy / S4W3 - Homework Post for @allbert.
Hello
This is homework post for professor @allbert .


Question : 1
Define in your own words what a contractile diagonal is and why it is important to study it. Explain what happens in the market for this chart pattern to occur. (screenshot required / Bitcoin not allowed)
Answer :
It is a wave pattern which tells about the price action of any asset. It is made up of 5 waves named as 1, 2, 3, 4, 5. These contractile diagonals can be in bullish or bearish directions. They helps us to analyze market with greater depth and also make detailed market prediction base on wave patterns.
Contractile Diagonals are 5 wave sturcture which helps to find new trend in price of asset when price reaches towards contraction point. In these 5 waves 3 of them are in same direction as trend and other 2 of 5 are in opposite direction of trend. Waves which are in same direction of trend are : Wave 1,3,5. Waves which are in opposite direction of trend are : Wave 2,4. When we pass a line through end point of wave 1, 3 ,5 this result in one diagonal(end point of wave 5 must not be in the same line which drawn through the end point of wave 1, 3 but it must be nearby the line.) Similarly, other diagnoal is formed by joining the end point of wave 2, 4.
These contractile diagonals structure can be seen in all type of time frames whether it is 5min, 30min, 1hr, 1day. These diagonals not only predicts the price but also helps to find the correct entry levels and exit levels. These diagonal structure also helps to find out stop loss levels and target levels. Stop loss level using these diagonals should be the end point of wave 5 in either side of trade. Target price using these diagonals will be the end point level of wave 2 in either side of trade.
Two main types of diagonal structure are :
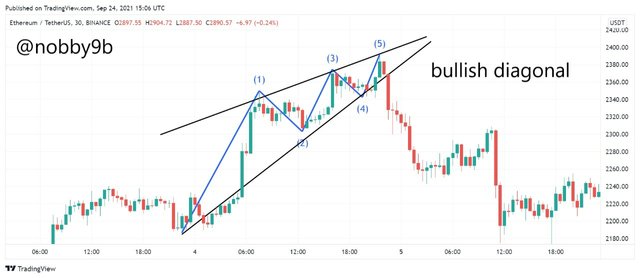
1.Bullish Trend Diagonals : in this diagonal, is contracting in bullish direction and it is ideal for a sell side trade. For example :
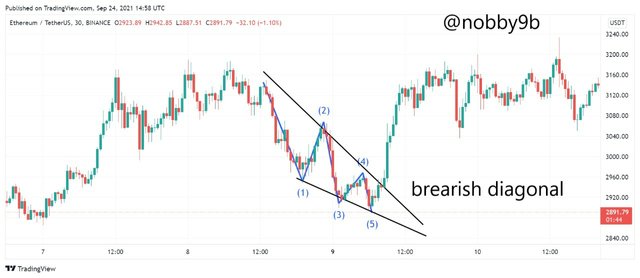
2.Bearish Trend Diagonals : in this diagonal, is contracting in bearish direction and it is ideal for a buy side trade. For example :
Why to study
Contactile Diagonals patterns are very important to be learned. These diagonal patterns can be good technical tools to be used by trades in thier trading. These diagonals helps you to find the very begninning of a new trend that it is very helpful for you. One can get high benefits from these diagonal structures, but, you must need to learn about these diagonals as these are not that easy to be mastered. It needs time,patience and practice to master this diagonals technique. So, you can master this technique only by practice and time and it is very good for you to study it because by this technique you will get to know about the very beginning of a new trend which helps you in your trading.
What happens in market to form these structures
Contractile Diagonals forms when price of asset is in one direction for long time and it will now become weaker, due to this price starts to contract and due to this sellers and buyers depending on direction on trend to trade are exhausted.
Basically the zig-zag movement of market results into these cotractile diagonals formation. These are the most basic structure similar to Elliot waves. In these contractile diagonal structures, usually wave 1, 3 , 5 are in same direction as the trend ad Waves 2, 4 are in opposite direction of trend. And when these all waves are combined and seen together they results in contractile diagonals structures. All the markets, are always somewhere in the basic 5-wave stuructre at the largest degree of trend. This is because the 5-wave pattern is overriding form of market progress and all the other patterns are within this 5-wave structure.
For down trend, Wave 1, 3 , 5 shows the sellers that want to bring the price lower but there is not sufficient volume because asset is lower priced. The break of wave 2, 4 diagonal shows that buyers are now taken over. Diagonals occurs when price of asset is oversold and overbought situation.
Give an example of a Contractile Diagonal that meets the criteria of operability and an example of a Contractile Diagonal that does NOT meet the criteria. (screenshot required / Bitcoin not allowed)
Criteria of operability
Contraction Diagonals mainly used to tell the starting of new trend. At the end of contraction diagonal price will expected to reverse and this is the beginning of new trend. In bullish diagonal structure price is expected to break the structure downward and it is ideal for sell side trades. On the other hand, in bearish diagonal structure price is expected to break the sturucture in uptrend and this is ideal for buy sie trades. As we already discussed that contractile diagonals well help us to find starting of new trend but there are some conditions to be followed or say requirement for Contractile Diagonal Structure. This structure is ideal for trades when it follows some rules which are :
Wave 1 must be larger in size than Wave 3.
Wave 3 must be larger in size than Wave 5.
Wave 2 must be larger in size than Wave 4.
When end point of Wave 1 & 3 are joined it forms one of the diagonals line which should be coincide with the end point of wave 5.(end of wave 5 may not be in exact diagonal line but it must be somewhere near it.)
The end point of Wave 2 & 4 are joined to make another diagonal line.
Both these diagonal lines should converge at nearby point.
When all these requirement are fulfilled than only we trade the pattern otherwise we need to find another pattern.
Example of Contractile Diagonal that meets all these rules :
In the above chart you can see a good example of cotractile diagonals. It follows all the rules. Here, wave 1, 3, 5 are in direction of trend and wave 2, 4 are in opposite trend. Length of wave 1 is more than wave 3 which is more than wave 5. Also, wave 2 is longer than wave 4. Both the diagonals are also croosing at nearby point and as a result of all this you can see a starting of new trend.
Example of Contractile Diagonal that does not meets all these rules :
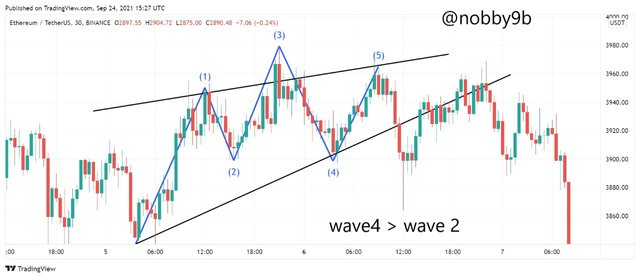
As you can see the wave 4 > wave 2 which is wrong thats why this pattern is not operable. As you can see price of asset does not behave as wanted.
NOTE :
The contractile diagonals usually represent the area of liquidity due to this reason the end points of waves are not always perfectly placed on the diagonal line but they must be nearby the diagonal line.
These contractile diagonals also tells about trend lines where price may retrace or fins support. At the end of contractile zone when two diagonals crosses each other the price will break out from these diagonals and starts a new trend.
Through your Verified exchange account, perform one REAL buy operation (15 USD minimum), through the Contractile Diagonal method. Explain the process and demonstrate the results and graphical analysis through screenshots. Your purchase data must match your analysis data: such as cryptocurrency and entry price.
Buy Trade
Entry
For entry in buy side trade follow these steps :
1.Buy side trades are made in case of bearish contractile diagonals.
2.We need to find the structure of contractile diagonal. In structure for buy side trade the wave 1 is in downtrend along with wave 3 and wave 5. In this case wave 2 and wave 4 are in opposite trend. The lenght of wave 1 > wave 3 > wave 5. And length of wave 2 > wave 4. When this sturcture is found then only we trade.
3.When the structure is found we will wait for a breakout in price which happens along with diagonal line of wave 2,4. So, when price breaks the levels with strong candle than we will start a buy trade at the next candle.
4.Once the entry is made we put the target levels as the end point of wave 2. And stop loss level as end point of wave 5.
For Example :
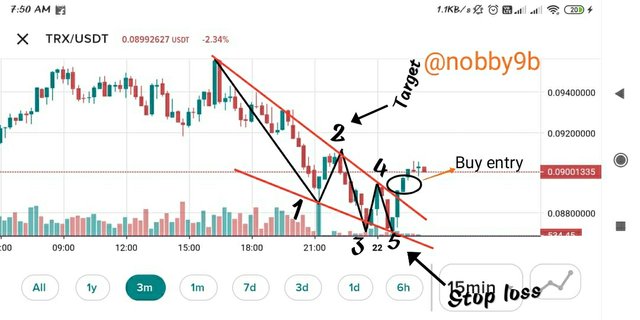
You can see here a clear buy trend setup. The diagonal formed is a bearish diagnonal and all other mentioned rules are followed. The price will break the price through diagonal line 2, 4. At this time, I made this trade on by poloniex account. We take entry after a strong breakout of diagonal.
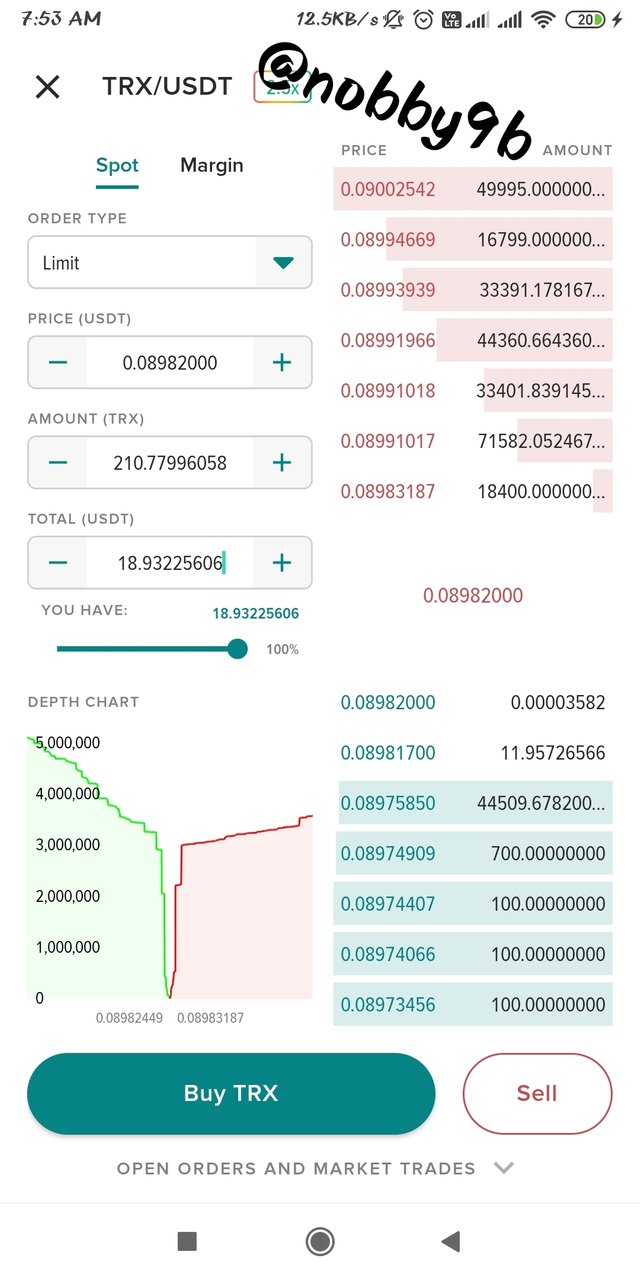
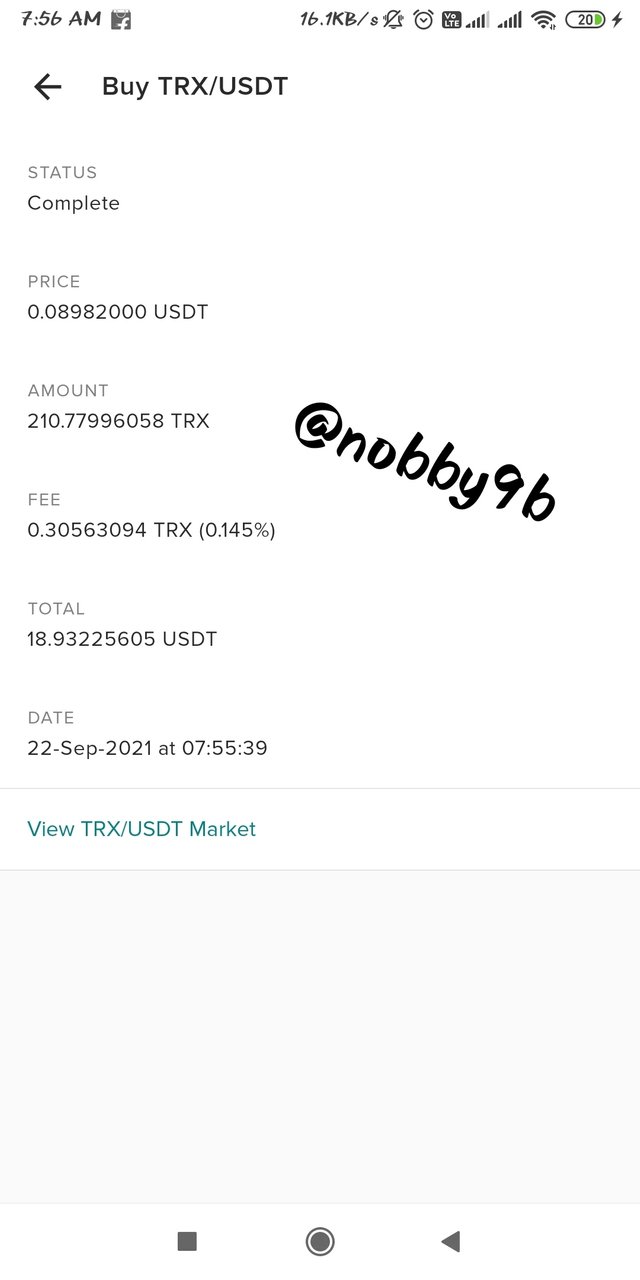
Here you can see the price detalis of my trade. You can check entry and exit levels. In the above picture you can see the buy levels and trade details at entry point.
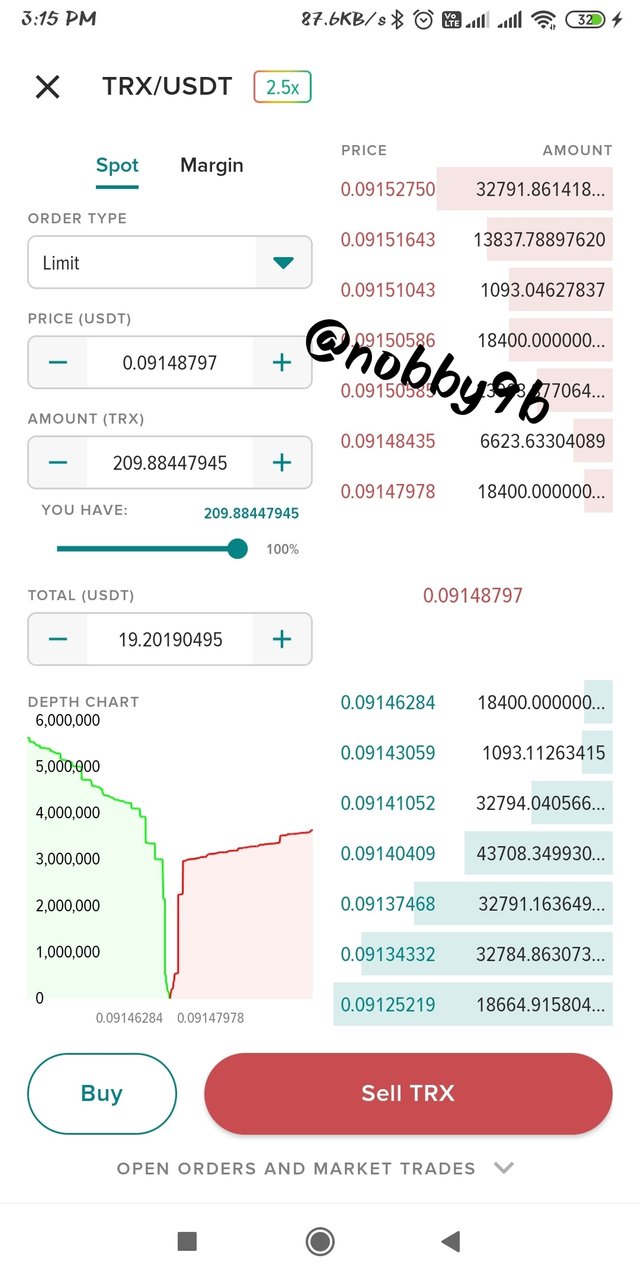
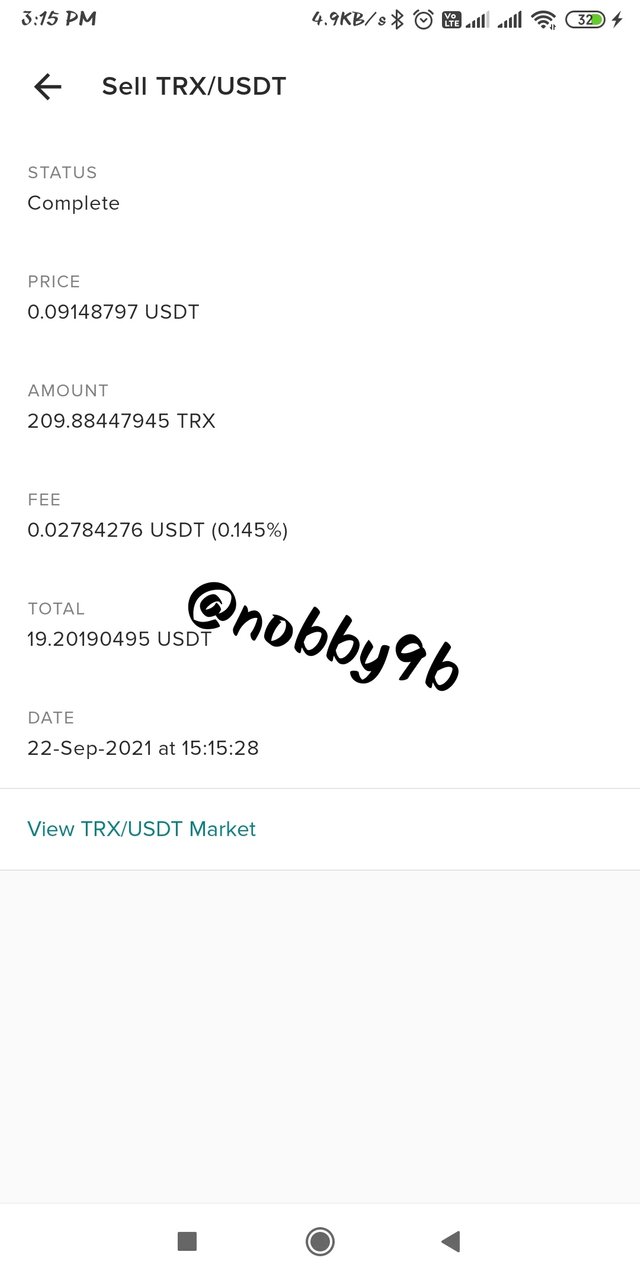
Here , in contractile diagonals , stop loss is end of wave 5 and target is wave 2 end point. In the pictures above you can check the details of my trades at the time of profit booking levels.
Through a DEMO account, perform one sell operation, through the Contractile Diagonal method. Explain the process and demonstrate the results and graphical analysis through screenshots. Bitcoin is not allowed.
Sell Trade
Entry
For entry is sell side trade follow these steps :
1.Sell side trades are made in case of bullish contractile diagonals.
2.We need to find the structure of contractile diagonal. In structure for sell side trade the wave 1 is in uptrend along with wave 3 and wave 5. In this case wave 2 and wave 4 are in bearish trend. The lenght of wave 1 > wave 3 > wave 5. And length of wave 2 > wave 4. When this sturcture is found then only we trade.
3.When the structure is found we will wait for a breakout in price which happens along with diagona line of wave 2,4. So, when price breaks the levels with strong candle than we will start a sell trade at the next candle.
4.Once the entry is made we put the target levels as the end point of wave 2. And stop loss level as end point of wave 5.
For Example :
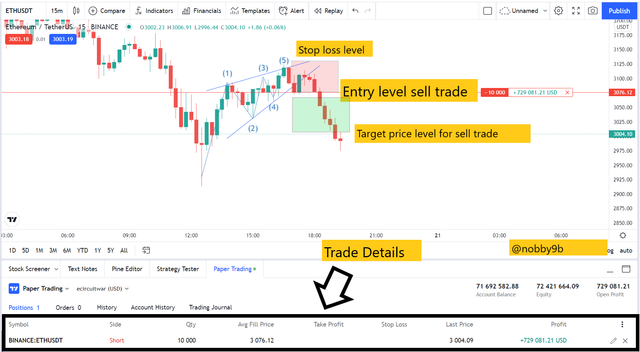.png)
In the above picture I show you a trade setup of sell side trade and details of trade. In trade, we find the bullish structure and this signals for a sell side trade. When the price of asset breaks the diagonal in downtrend with strong candle. We make our entry at the next candle and stop loss should be end of wave 5 and target should be end of wave 2.
Explain and develop why not all contractile diagonals are operative from a practical point of view. (screenshot required / Bitcoin not allowed)
As we all know that nothing is 100% trusworthy. Everything has some plus points along with some minus points. So, contractile diagonals are also not 100% sure. Some of the examples for not operative diagonals are :
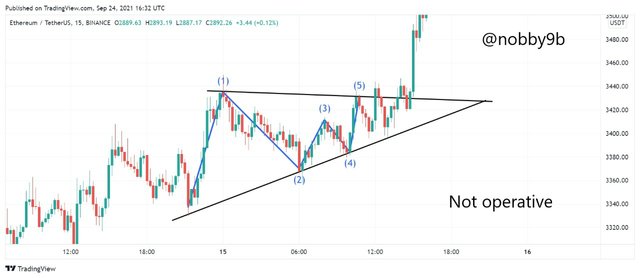
Here, you can see the example of diagonal that is not operative.
As you can see in the picture above the wave 4 > wave 2 due to this diagonals are not crossing at nearby point.So, this is not the right trade setup using contractile diagonals. This is one the way in which contractile diagonals are not operative.
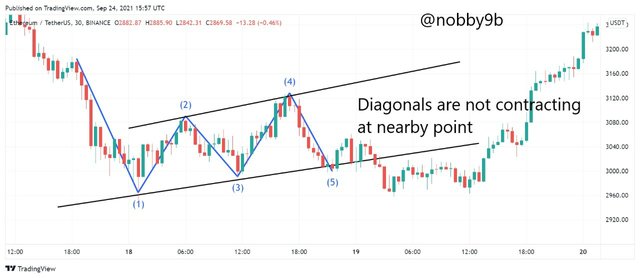
Another example when contractile diagonals are not operative is :
In this example as you can see wave 5 > wave 3. Also, end of wave 3 is not in falling in the diagonal joining end of wave 1 & 5. As you can see the diagonals are crossing but when price not able to break the levels. so, this is another example where contracting diagonals does not work.
Let us look at another example where contractile diagonals are not operative. This is the case when the structure is correct but risk reward ratio is not in favour of trade. We made trade when there is atleast risk reawrd ratio of 1:1.
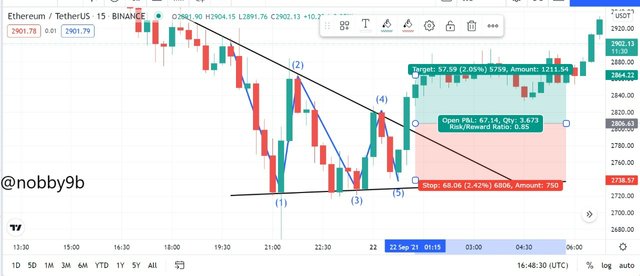
In the above example you can see that the contractile diagonal structure is correct and diagonals are also contracting at nearby points. But the risk-reward ratio in this trade is 0.85 which means higher risk than profit. So this kind of trades are not advised to be initiated. I take stop loss as end of wave 5 and target as end of wave 2. And we get risk - reward ratio of 0.85 we must make trades when there is atleast risk reward of 1:1.
Conclusion
In this article we learn about contractile diagonals. It is a great tool to be used for trading but first you need to understand this properly. Contractile diagonals is very common pattern to be found in charts. This pattern is helpful because it tells about the starting of a new trend. And using this tool we not only can make good trade but it will gives us good entry and exit levels. Trades using contractile diagonals has stop loss as end of wave 5 and target is end of wave 2.
Contractile diagonals can be helpful if traded properly. One must need to know about the weak points of diagonals before using it blindly as they may give a wrong signals.
Congratulation on good ratings you have got,